Trends in heavy precipitation in the southern USA 1
School of Meteorology, University of Oklahoma, Norman, OK, USA 2 Oklahoma Climatological Survey, Norman, OK, USA 3 Southern Climate Impacts Planning Program, Norman, OK, USA
Introduction The Intergovernmental Panel on Climate Change (IPCC), working group 1, report (2007) suggested that increasing global average temperatures are very likely to lead to changes in the distribution and intensity of extreme events, including changes in the global hydrological cycle. Warmer air is able to hold more water vapour, thus increasing the moisture available for precipitation. This is not necessarily uniform over the globe: local precipitation (or lack thereof ) is still dependent on regional environmental conditions which change depending on, for example, pressure, wind direction, terrain, season, upper-level flow, large scale teleconnections (such as El Niño), and even local variations in atmospheric aerosols (e.g. Ntelekos et al., 2009). However, several studies do support the possibility of an enhanced hydrological cycle – that is, when it rains it rains harder and when it does not there may be longer droughts (see Kunkel et al. (1999), Karl and Knight (1998), and Trenberth (1999)). In this paper, we examine whether there have been observed changes in the frequency of 1-day heavy precipitation events in a part of the southern United States of America over the last 60–100 years, using data from individual raingauge stations and state climate divisions. Climate divisions are regional subdivisions within a state: most states typically have between four and ten climate divisions. These regions are designed to coincide with county boundaries, so the choice of domain is more political than meteorological; nevertheless, the divisions are considered to be approximately homogeneous with respect to climate conditions.
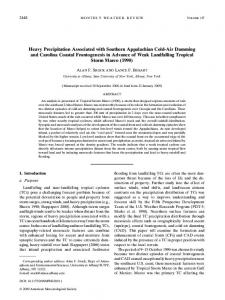
The rationale for such regions relates to the need to obtain long-term average conditions of temperature and precipitation, including agricultural metrics, over a more user-relevant region than an entire state. More information on the history of climate divisions is given by Guttman and Quayle (1996). The area of interest for this study, shown in Figure 1, is focused specifically on the region covered by the ‘Southern Climate Impacts Planning Program’ (SCIPP), which includes the states of Arkansas, Louisiana, Mississippi, Oklahoma, Tennessee and Texas. SCIPP seeks to identify regional weather and climate hazards, working with local stakeholders and governments to assess vulnerability and inform policy that promotes adaptation and mitigation of these hazards. The region is notable for its diverse range of meteorological, climatic and topographic conditions, from desert in the far west to sub-tropical humid forests in the south and east. Extremes of precipitation are not uncommon and were especially salient in 2010, when a series of unprecedented rainfall events occurred over the region (Higgins et al., 2011). In Nashville (Tennessee), 48 hours of heavy precipitation on 1/2 May produced widespread reports of 250– 400mm and record or near-record river flood levels. The Cumberland River that flows through Nashville burst its banks, cresting at near 15.6m and flooding sections of the city centre. On 14 June 2010, a slowmoving thunderstorm complex brought
125–250mm of accumulated precipitation to Oklahoma City, leading to severe disruption in transportation due to flooding of several major roads. Precipitation time-series for 176 stations across these 6 states are examined individually for trends. We then examine spatial trends across each climate division at thresholds between 0.2mm and 127mm (0.01–5in) per day on both annual and seasonal timescales. A partial-duration time series of the top 0.2% of events in the dataset (by magnitude) from 1948 to 2008 is also constructed for stations within each state to examine changes in high-magnitude events over this 60-year period. These simple techniques will allow us to identify robust signals for precipitation changes.
Weather – December 2013, Vol. 68, No. 12
Esther D. Mullens1 Mark Shafer2,3 and James Hocker2
Data and methods Data is obtained from the cooperative (coop) network of rain gauges. This is operated by the National Weather Service and the National Climatic Data Center (NCDC), and is a vital component of the climatological record of the United States. It uses observations from the general public in both official and unofficial capacities. The official coop stations take daily readings, typically at 1200 UTC (0600 or 0700 local time) but sometimes at 0600 UTC or 1800 UTC. Each station has a different length of record and many have short and/or incomplete records: those used in the individual station study have
Figure 1. Study domain. OK = Oklahoma, TX = Texas, AR = Arkansas, LA = Louisiana, MS = Mississippi, TN = Tennessee. Terrain (km above sea level) is shaded.
311
Precipitation trends in southern USA Weather – December 2013, Vol. 68, No. 12 312
records for over 60 years and less than 5% missing data. Raingauges are not perfect instruments, and so there is always likely to be some uncertainty in the exact magnitude of precipitation; furthermore, despite the relative density of the US raingauge network, it is still not at a resolution sufficient to capture all heavy precipitation events, particularly localized convection. Unfortunately, little can be done to rectify this problem for climate analysis using in situ data. Common sources of error for a standard tipping-bucket raingauge include poor siting of the instrument (e.g. near buildings or trees), poor calibration or changes in instrumentation, and human error (reading and transcription). Since this study is looking at trends in certain rainfall thresholds, absolute magnitudes of errors are less important than their changes over time, which could lead to bias. It is believed that these are not significant and so we proceed under that assumption. Another caveat with the dataset is its low temporal resolution. Since measurements are made only once a day, there is little information specifying the subperiod over which the precipitation event occurred, or whether it continues over two days of measurement despite being less than 24 hours in duration; events that are spread over two measurement periods are almost always underestimated in intensity. Unfortunately, these problems cannot be solved using the current dataset and so we must set them aside for this study. In addition, there is no compensation for the different times of measurement, which we believe does not have a great impact on our results as measurements from different stations are not directly compared. A simple technique is used to evaluate possible trends in heavy precipitation. By considering the annual precipitation climatology for each station, and noting that annual average precipitation increases from west to east, varying definitions of ‘heavy’ daily precipitation are used. For semi-arid west and southwest Texas, ‘heavy’ is defined as 38mm (1.5in) per day, for the central region of Texas, through Oklahoma, this is raised to 51mm (2in) per day, and for eastern Texas, Arkansas, Tennessee, Mississippi, Louisiana 63mm (2.5in) is used. ‘Very heavy’ is typically 127mm (5in) per day. Although these definitions are subjective, they are comparable to those from other studies. Kunkel et al. (1999) and Karl et al. (1995) use an average of two inches as a national average measure of heavy precipitation, while a study by Groisman et al. (2001) examined trends in precipitation above 102mm (4in) per day in the upper Midwest. Although our measures do not necessarily represent highimpact precipitation events, they typically are located in the top 10% of the precipitation distribution over the region and have a return period of approximately two years.
Figure 2. Distribution of ‘strong’ and ‘significant’ positive trends in heavy precipitation for (a) all years in individual station record (varies), (b) 1920–2009, (c) 1948–2009. (a)
(b)
(c)
(d)
Figure 3. Trends in the number of days of rain above thresholds from 0.2 mm to 127 mm per day for each climate division. Negative/positive trends are shown in blue/red. Areas without notable trends are shaded in white.
For individual stations we find each location possessing a different temporal record, some starting around 1900 and some nearer 1940. The entire record of each station was
examined and, to facilitate comparison with other station records, the periods 1920– 2009 and 1948–2009 were used. For each station, the number of events exceeding a
(a)
(b)
Trends at individual stations (c)
(d)
(a)
(b)
(c)
(d)
Weather – December 2013, Vol. 68, No. 12
Figure 4. As Figure 3, but for trends during winter (DJF). Scale as in Figure 3.
Figure 2 shows the distribution of stations with positive trends in ‘heavy’ precipitation across the region for three time periods between 1900 and 2009. In this analysis no stations had statistically significant negative trends. In total, approximately 23% of all stations had a significant positive trend through their total time-series, which varied from station to station. This proportion decreased to 15% between 1948 and 2009. States with the strongest signal for increased frequency of heavy precipitation include Oklahoma through central and east-central Texas into parts of Mississippi, far south Louisiana and eastern/southern Arkansas. Tennessee and Arkansas have the lowest proportion of stations with significant trends. We see, therefore, that although there are clear signals for increased heavy precipitation in certain areas, local environmental conditions, high year-to-year variability and the limited spatial extent of the observation area precludes the conclusion that there are more widespread trends.
Precipitation trends in southern USA
defined as that with a p value of less than 0.1 (10%)1. The p-value expresses the probability that the trend is a result of chance: as a guide, the smaller the p-value, the more significant the result.
Trends within climate divisions
Figure 5. As Figure 4, but for spring (MAM).
given threshold was summed for each year and plotted as a time-series. Individual station analysis has the advantage of enabling us to examine specific time-series and events at point locations, but it does not encompass an area and it misses some events that were not recorded by its specific raingauge. Therefore, for the climate division analysis we calculate the total number of precipitation events exceeding specific thresholds between 0.2–127mm per day using data from every active station in each division. This represents a much denser network of observing sites than the individual station analysis, as in that analysis many cooperative stations were eliminated as they only had a short period of record. In this study any active station is considered, no matter the temporal duration. However, in order to weight the resulting dataset correctly, the number of events is normalized by the number of active stations in each climate division in each year. This should
prevent a positive bias toward recent years, which may result from an increase in observing stations. We assess both the total and seasonal number of events as a fraction of the annual total. Seasons are defined as DJF: DecemberJanuary-February (winter); MAM: MarchApril-May (spring); JJA: June-July-August (summer) and SON: September-OctoberNovember (autumn). The choice of thresholds reflects the need for consistency across the six states. The lowest threshold of 0.2mm per day accounts for the total number of rain-days, whilst 51 or 76mm per day, and 127mm per day, account for ‘heavy’ and ‘very heavy’ precipitation over most regions respectively. Linear trend analysis via a basic analysis of variance (ANOVA) is used to determine the statistical significance of the change in the mean number of heavy precipitation events. A ‘significant’ trend is defined as having a p value less than 0.05 (or 5%), with a ‘strong’ trend being
Figure 3 shows the distribution of trends within climate divisions in total number of precipitation events between 0.2mm and 127mm per day between 1948 and 2009. For the total number of rain-days (>0.2mm per day: Figure 3(a)), much of the north and west of the region exhibits significant positive trends. In other words, in these regions, the number of rain-days per year has been increasing since 1948. Conversely, in the south of the region, including much of the Texas Gulf coast, the overall number of raindays has been decreasing. Above 51mm per day (Figure 3(b)) most locations show positive or no trends, especially in Oklahoma, west Texas and the north of Arkansas, Louisiana and Mississippi. A couple of locations on the Louisiana Gulf coast show significant decreasing trends. Above 76mm per day (Figure 3(c)) the only significant trends are positive and are concentrated mainly in western portions of the region, specifically Texas, Oklahoma and Mississippi. Above 127mm per day (Figure 3(d)) very few divisions have significant trends (largely due to the low frequency of such events, so linear trend analysis is less reliable) but 1
In many studies, a p-value of 0.1 is considered an absolute minimum threshold for statistical significance. In this study, we express the trend as ‘strong’ but not ‘significant’.
313
Precipitation trends in southern USA Weather – December 2013, Vol. 68, No. 12
(a)
(b)
(c)
(d)
Figure 6. As Figure 4, but for summer (JJA).
(a)
(b)
(c)
(d)
Figure 7. As Figure 4, but for autumn (SON).
there is a signal for increasing event frequencies in east Texas, western Oklahoma and the Texan Panhandles. This spatial analysis finds regional trends to be much more prominent than the individual long-duration station analysis. A qualitative comparison between Figure 2(c) and Figure 3 for events between 51 and 76mm per day shows some consistency between them in terms of location, which is expected; nonetheless, discrepancies arise from the aforementioned high variability and local climate influences that lead to increased ‘noise’ in individual station records.
Seasonal trends
314
Figures 4–7 show the distribution of trends for the aforementioned precipitation thresholds during winter, spring, summer and autumn respectively. In order to establish a baseline with which to compare these seasonal trends, climatological distributions of
precipitation for each season were constructed for each state and each threshold. Due to its large land area and distinct difference in climatological characteristics, Texas was split into two components: east and west. Contributions from each climate division were weighted by area. For all states peak precipitation occurred during summer, but generally high amounts of precipitation also occurred during spring and autumn, and in winter for the Gulf Coast states and Tennessee. Figure 8 shows these distributions as a schematic, also indicating the observed changes in seasonal precipitation greater than 51mm per day since 1948. Although there is a large amount of variability across climate divisions and between seasons, we summarize the broad results below for each threshold. For the number of rain-days per year, the only statistically significant trends occurred during the summer and autumn. The data is suggestive of a shift of rain-days from
between these seasons, due to positive trends in rain-days in autumn alongside negative trends in summer events for parts of Oklahoma, while decreasing trends in north and east Texas summer precipitation remain uncompensated for in other seasons (Figure 3). Trends are largest over the northern sections of the region, specifically west and north Texas, Oklahoma and Arkansas. For precipitation greater than 51mm per day, the most notable trends include an increase in winter heavy precipitation over parts of Oklahoma. Trends in springtime are very few, and mostly negative, but fall below statistical significance. In summer, eastern Oklahoma trends are negative, but only a couple reach significance. Autumn trends are mostly positive and most substantial in the eastern sections of the domain. Therefore, for this precipitation threshold, relative fractions of wintertime heavy precipitation have increased for Oklahoma, and autumn heavy precipitation frequency has increased in the east and northeast. For precipitation greater than 76mm per day, Oklahoma and parts of north Texas show increases in wintertime heavy precipitation, which is a similar result to the 51mm per day threshold. Northern and central Texas also exhibit an increase in the proportion of summertime events. Conversely, parts of northern Texas show significant decreases in the proportion of spring events. During autumn, the significant trends are all positive and concentrated in Arkansas, Mississippi, Louisiana and Tennessee. The results are suggestive of a shift in events characterized by more heavy precipitation events in Oklahoma and northern Texas during the winter, as well as portions of the eastern states during the autumn. Meanwhile, there is a reduction in spring heavy rainfall in parts of northeastern and central Texas. For very heavy precipitation events, greater than 127mm per day, significant trends are more sporadic, given the limitations of establishing linear trends with sparse data. Winter shows an increase in frequency for northern Texas, while data in a couple of climate divisions show statistical significance in negative trends during this season. Spring reveals sporadic and generally weaker trends, nearly all of which are negative. Summer is similar to spring: the only significant positive trend is in far western Texas, which also has a decreasing trend during the autumn, indicating a possible season shift of extreme precipitation in this region. Most trends during autumn are again positive, and again concentrated in eastern sections of the region.
Trends in top events by magnitude The top 60 events by magnitude from each individual station time-series with a
Precipitation trends in southern USA Weather – December 2013, Vol. 68, No. 12
(1998), the southern US, similar to our domain (minus Tennessee), showed a statistically significant increase in >51mm per day precipitation events during 1910–1995 that exceeded the national average trend. Their analysis also suggested that about 53% of the total increase in precipitation amounts that had been observed nationally was contributed by the upper 10% of the precipitation distribution. Clearly, however, there may be substantial regional differences. Along the Gulf coast states, Groisman et al. (2004) suggested that trends may in some cases be masked by the high interannual variability contributed by tropical cyclones. Some of these studies also examine seasonal precipitation changes, noting greatest changes in the number of rain-days during the transition seasons of spring and autumn, consistent with some of the results of this work. In addition, an increase in the frequency of heavy precipitation during autumn was also found in earlier studies and lends further credibility to our results. For the plains regions, studies by Garbrecht and Rossel (2002) and Garbrecht et al. (2004) show a marked increase in annual average precipitation over the last two decades of the 20th Century. This is also clearly shown in Figure 3 for parts of Oklahoma and west Texas. In those studies, the authors did not consider changes in heavy precipitation.
Summary Figure 8. Average seasonal contributions to total annual precipitation (from left to right in each graph: DJF, MAM, JJA, SON). Arrows are a schematic representation of the direction and magnitude of observed changes between 1948 and 2009. Upward/downward arrows indicate an increase/decrease in the seasonal contribution to the total number of heavy precipitation events (between 51 and 76mm per day): the longer the arrow, the more significant the trend.
significant positive trend (see Figure 2) were selected and binned into decadal intervals between 1948 and 2008. Stations were grouped and displayed by state, as shown in Figure 9. For each of the six states, the majority of high magnitude precipitation events occurred during the most recent three decades (1988–2007). Thus, for the 60 years since 1948 there has been an increase in the frequency of high magnitude daily precipitation. Ideally, a longer duration dataset should be examined, as we cannot discount the role of natural variability on a 60-year timescale, whilst a 100-plus year dataset would allow us to make stronger inferences regarding the role of climate change. In addition, future work should examine a greater number of stations – as in this case we consider a relatively low sample size due to time constraints. Figure 9
should be interpreted with this caveat in mind, especially for the eastern states. Nonetheless, broadly speaking, the results presented here are consistent with current climate change projections of an enhanced hydrological cycle.
Comparison with other studies The results shown here have been compared with some earlier studies that used similar methodologies to determine changes in heavy precipitation. We did this in order to examine whether our results are in some agreement with the existing body of research. In the literature, most trend analysis considers the USA as a whole (Karl and Knight, 1998; Kunkel et al., 1999; Groisman et al., 2004). However, there are some examples of regional analysis. In work by Karl et al.
This paper has examined trends in heavy precipitation over a part of the southern United States, and has identified variable, yet compelling, evidence for an increase in the frequency of such events over portions of the domain since 1948. While the increase in heavy precipitation is an expected consequence of a warming world, it is also symptomatic of regional climate variability. Since our precipitation record extends predominantly between 1920/1948–2007, long-term natural variability versus climate change signal is not necessarily clear. Moreover, increasing trends since the midcentury may be simply a result of a drier mid-century compared with later years. For example, Kunkel et al. (1999) and Karl and Knight (1998) note that the 1930s and 1950s were generally dry across much of the contiguous US, whereas the 1980s and 1990s were particularly wet. Thus a trend between 1950 and 2000 may show a significant positive trend, but from 1900 to 2000 this linear trend may actually disappear if earlier parts of the century were also wetter. Interestingly, despite the 1980s and 1990s being abnormally wet when compared with much of the twentieth century, the highest average number of high-magnitude precipitation events (Figure 9) are found in the early-mid 2000s on average over the SCIPP domain. This contrasts with an overall decrease in
315
Precipitation trends in southern USA Weather – December 2013, Vol. 68, No. 12
Figure 9. Top 0.2% of precipitation events broken down by decade for all stations with strong or significant trends in heavy precipitation (representing about 79 stations over the 6 states, or 45% of the total individual stations). The y-axis shows the number of stations with the most number of events in a given decade (e.g. four stations in Arkansas had the largest number of high magnitude events during 1998–2007, and the other two stations had their highest number of events during 1978–1987). Number of stations: Texas = 30, Oklahoma = 17, Arkansas = 6, Louisiana = 13, Mississippi = 7, Tennessee = 6.
lower-threshold precipitation (e.g., frequency of rain-days) during the same time period (not shown). In earlier decades, heavy precipitation was better collocated with years of higher total annual precipitation. Future work could examine the number of dry days per year, to determine whether there has been a shift to longer-duration dry spells collocated in time with an increase in short-duration heavy precipitation. In addition, the meteorological conditions that may contribute to the observed increase in heavy precipitation are not well known and require further study. Nevertheless, given the socioeconomic dangers of flooding, particularly flash flooding, the results shown here can be used by state and regional planners in future adaptation and mitigation strategies in a changing climate.
Acknowledgements This work was supported by the Southern Climate Impacts Planning Program (http:// www.southernclimate.org/) and the Oklahoma Climatological Survey, who provided the cooperative network raingauge data (http://climate.ok.gov/). Thanks also to Dr Barry Keim (Louisiana State University) for his helpful suggestions.
316
References Garbrecht J, Rossel FE. 2002. Decadescale precipitation increase in Great Plains at end of 20th century. J. Hydrol. Eng. 7(1): 64–75. Garbrecht J, Van Liew M, Brown GO. 2004. Trends in precipitation, streamflow and evapotranspiration in the Great Plains of the United States. J. Hydrol. Eng. 9(5): 360–367. Groisman PY, Knight RW, Karl TR. 2001. Heavy precipitation and high streamflow in the contiguous United States: trends in the twentieth century. Bull. Am. Meteorol. Soc. 82: 219–246. Groisman PY, Knight RW, Karl TR et al. 2004. Contemporary changes of the hydrological cycle over the contiguous United States: trends derived from in-situ observations. J. Hydrometeorol. 5: 64–85. Guttman NB, Quayle RG. 1996. A historical perspective of U.S climate divisions. Bull. Am. Meteorol. Soc. 77: 293–303. Higgins RW, Kousky VE, Xie P. 2011. Extreme precipitation events in the SouthCentral United States during spring 2010: historical perspective, role of ENSO and trends. J. Hydrometeorol. 12: 1056–1070. Intergovernmental Panel on Climate Change (IPCC). 2007. Climate Change 2007: The Physical Science Basis, Summary for Policymakers. Contribution of the
Working Group I to the Fourth Assessment Report of the Intergovernmental Panel on Climate Change. Cambridge University Press: Cambridge, UK. Karl TR, Knight RW. 1998. Secular trends of precipitation amount, frequency and intensity of the United States, Bull. Am. Meteorol. Soc. 79: 231–241. Karl TR, Knight RW, Easterling DR, Quayle RG. 1995. Trends in U.S. climate during the twentieth century. Consequences 1: 3–12. Kunkel KE, Andsager K, Easterling DR. 1999. Long-term trends in extreme precipitation events over the conterminous United States and Canada. J. Clim. 12: 2515–2527. Ntelekos AA, Smith JA, Donner L et al. 2009. The effects of aerosols on intense convective precipitation in the northeastern United States. Q. J. R. Meteorol. Soc. 135: 1367–1391. Trenberth KE. 1999. Conceptual framework for changes of extremes of the hydrologic cycle with climate change. Clim. Change 42: 327–339.
Correspondence to: E. D. Mullens
[email protected] © 2013 Royal Meteorological Society DOI: 10.1002/wea.2113