J Pediatr Endocr Met 2013;26(7-8):651–656 © 2013 by Walter de Gruyter • Berlin • Boston. DOI 10.1515/jpem-2012-0018
Trends of body composition among adolescents according to maturation stage and body mass index
Silvia D. Castilho1,*, Caroline A. Bento2, Caroline D. Pinheiro3, Antônio A. Barros-Filho4 and Monize Cocetti5 1
Department of Pediatrics, School of Medicine, Pontifícia Universidade Católica de Campinas, Campinas, Brazil 2 School of Medicine, Pontifícia Universidade Católica de Campinas, Campinas, Brazil 3 School of Medicine, Pontifícia Universidade Católica de Campinas, Campinas, Brazil 4 Department of Pediatrics, School of Medical Sciences, Universidade Estadual de Campinas, Campinas, Brazil 5 School of Nutrition, Pontifícia Universidade Católica de Campinas, Campinas, Brazil
Abstract Background: Excessive increases in percentage body fat (%BF) according to sex may pose greater risks of chronic diseases. Objective: To evaluate trends of body composition according to sexual maturation stage and body mass index (BMI) of adolescents. Method: Data about weight, height, lean mass, fat mass, %BF, BMI and sexual maturation of 1345 private school students (685 girls) aged from 7 to 18 years were collected in 2001 and compared with data of 1450 students (750 girls) collected in 2010 in Campinas, Brazil. χ2-test, ANOVA and logistic regression were used for statistical analyses (p < 0.05). Results: Obesity prevalence increased, and number of boys and girls with normal BMI (p=0.0183 and p=0.0041) decreased. Differences in the median values of the study variables according to time point and nutritional diagnosis were not significant, except for lean mass (p=0.0484) and height (p=0.0275) in B2 (Breast stage) and %BF (p=0.0324) in G5 (Genitalia stage). Conclusion: Body composition did not change significantly, although overweight increased. Keywords: adolescent; body composition; body mass index; trends.
Introduction Obesity has become an important public health problem in the last decades, not only because of its epidemic nature and *Corresponding author: Silvia Diez Castilho, Av. Princesa D’Oeste, 1144, apto 171, Jd. Paraíso, CEP 13100-040 – Campinas, SP, Brazil Phone: +55 19 3295 4237, Mobile: +55 19 9611 7363, E-mail:
[email protected];
[email protected] Received January 25, 2012; accepted April 27, 2012; previously published online June 7, 2012
repercussions on morbidity and mortality, but also because of its costs (1). Some studies indicate that developed countries, such as Great Britain and Germany, have experienced a decrease in the prevalence of obesity in certain age groups, whereas in others, such as the USA, it remains high and apparently stable among adolescents despite all the efforts made to reverse this trend. In many other parts of the world, even in countries plagued by malnutrition until very recently, obesity rates continue to increase (2–4). Special attention should be taken, however, when comparing data, because obesity prevalence rates and trends are not homogeneous, not even within a single population, due to ethnic, age, geographic, social and economic differences. Body mass index (BMI) expresses the relation between weight and height and has been used to estimate obesity and the risks associated with it. It is easy and inexpensive to estimate and, except in special cases, such as regular exercise practice or edema, increases in BMI are associated with increases in body fat (5). Obesity in adolescence is not easily assessed because boys and girls are growing and their body composition (BC) undergoes changes as part of the sexual maturation process. As BMI does not differentiate weight associated with lean mass (LM) from that associated with fat mass (FM) in this age group, other methods should be used. The use of BMI alone may mask the inherent risks of an increase in fat above what is expected for each maturation stage (6, 7). Obesity is a serious public health problem and the contribution of LM and FM to the increase of BMI during growth should be investigated. This study evaluated the trend of nutritional diagnoses and changes in BC according to sexual maturation in adolescents of a high socioeconomic level in one decade. The identification of excessive fat increases according to sex and maturation stage may provide useful information for interventions to reduce health risks in adulthood.
Materials and methods This study, which described and compared data for two cross-sectional samples, enrolled 2795 private school students (1345 in 2001 and 1450 in 2010) aged 7–18 years, in Campinas, Brazil. The boys and girls were healthy, most had a good social and economic conditions [according to studies that investigated inequalities, education and school performance in Brazil found that socioeconomic variables determine the type of school that children attend (public or private) and their performance in achievement tests that measure acquired knowledge (8–10)], did not use any medication that might interfere in their growth or weight gain, and had no health problems that might interfere in measurements. The order of participating schools was determined by randomly drawing school names and the sequence was the same at the two time points. All students included
Authenticated |
[email protected] author's copy Download Date | 9/3/13 7:28 AM
652
Castilho et al.: Trends of body composition among adolescents
had a written consent from the school principal and their parents or guardians, and expressed their willingness to participate in the study before evaluations. Based on other studies conducted with Brazilian adolescents (11, 12), mean age was calculated for each Tanner maturation stage (13) and, for each mean age, BMI variability. For convenience, to balance groups and to ensure that variables were analyzed according to sexual maturation, we used the highest number of participants for each Tanner stage according to the sample size formula for a quantitative variable of a descriptive study, taking into account the lowest sample error (d = 0.7 kg/m2), the greatest standard deviation estimation (S = 2.9 kg/m2) and the level of significance of 1%. Each sample should be composed of at least 1140 subjects [114 subjects for each Tanner maturation stage, defined as breast (B) for girls and genitalia (G) for boys]. Students were evaluated by the same author at two time points (2001 and 2010) using international anthropometric standards. Weight and height were measured, and LM, FM and %BF were assessed using bioimpedance (Tanita TBF-305). Based on these data, BMI, LM and FM indices (LMI and FMI) were calculated; BMI = LMI+FMI, or weight/height2 = LM/height2+FM/height2. For BMI (Z score), the cut-off points of the WHO curve (2007) were used (14). Maturational stages were defined according to comparative self-evaluation using pictures that illustrate pubertal growth (Tanner maturation stages). To validate data, the author confirmed self-evaluation of students whose parents granted permission for that (529 girls and 429 boys; 70.5% and 61.3% of total number of girls and boys). The girls were asked about menarche (status quo method; yes/no) at the time of the evaluation. Data were analyzed using the Statistical Analysis System for Windows 9.2 (SAS Institute Inc., 2002–2008, Cary, NC). To analyze BC variables, the adolescents were divided into two groups: overweight (including overweight and obesity) and non-overweight (normal weight and underweight). Bar graphs were built to assess the rate at which LMI and FMI affected BMI in each Tanner stage. A χ2-test was used to compare proportions, and ANOVA, after rank transformation, to compare measures according to time point and nutritional diagnosis, and to check possible interaction effects. Weighed kappa was used to analyze agreement between self-evaluation and the evaluation made by the author. The age at menarche was estimated using logistic regression (logit). The level of significance was set at 5%. This study was approved by the Ethics Committee of Pontifícia Universidade Católica de Campinas, Campinas, Brazil, under number 693/09. The authors have complied with the World Medical Association Declaration of Helsinki regarding ethical conduct of research involving human subjects.
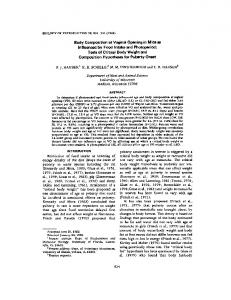
Results The number of girls (685) and boys (660) evaluated in 2001 was similar to the numbers in 2010 (750 and 700) (p = 0.6745). The agreement between self-evaluation and evaluation by the author that conducted examinations, both for boys (0.9644; 95%CI 0.9510–0.9779) and for girls (0.9558; 95%CI 0.9410–0.9707), was excellent. All adolescents that met study criteria were included. The maturational stage used in the study was the one defined by the author for all participants whose parents granted permission to examine them and the stage defined in the self-evaluation for all the others. Sample distribution according to Tanner stages (Table 1) was similar at the two time points. Between 2001 and 2010, there was an increase in obesity prevalence and a decrease in normal BMI for both boys and girls (Table 2). Figures 1 and 2 show BC of overweight and non-overweight girls and boys at the two time points. There was no variation in BMI, LMI or FMI in the comparison of groups with the same nutritional diagnosis in 2001 and 2010 (p > 0.05) according to sex and maturation stage. However, the median values of these variables were systematically greater for overweight than for non-overweight adolescents of the same sex at the same time point (p < 0.0001 for all maturation stages of both boys and girls). Table 3 shows the interaction effects of time point and nutritional diagnosis for median values of BMI (LMI+FMI), LM, FM, %BF and height for each Tanner stage. The interaction of these effects was not significant (p > 0.05), except for lean mass and height in B2 and %BF in G5. For LM in B2, results showed significant differences when the nutritional diagnosis was compared at the same time point (p < 0.0001 for 2001 and p = 0.0200 for 2010): overweight girls had more LM than non-overweight girls at the two time points. Comparing the same diagnoses in 2001 and 2010, there were no significant differences (p = 0.1712) for non-overweight girls, but there were differences (p = 0.0005) among those with a BMI above the recommended value. Overweight girls at B2 had less LM (28.9 kg) in 2010 than in 2001 (30.4 kg).
Table 1 Comparative distribution of 2001 and 2010 samples of adolescents evaluated in private schools in Campinas, Brazil, according to Tanner maturation stages for girls [breast (B)] and boys [genitalia (G)]. Maturation stage
B1 B2 B3 B4 B5 Total
Girlsa
Maturation stage
Boysb
2001
2010
2001
2010
n, %
n, %
n, %
n, %
117 (17.08) 150 (21.90) 141 (20.58) 150 (21.90) 127 (18.54) 685 (47.74)
138 (18.40) 135 (18.00) 145 (19.33) 193 (25.73) 139 (18.53) 750 (52.26)
145 (21.97) 141 (21.36) 129 (19.55) 124 (18.79) 121 (18.33) 660 (48.53)
174 (24.86) 135 (19.29) 130 (18.57) 129 (28.43) 132 (18.86) 700 (51.47)
G1 G2 G3 G4 G5 Total
p = 0.2333, bp = 0.7039.
a
Authenticated |
[email protected] author's copy Download Date | 9/3/13 7:28 AM
Castilho et al.: Trends of body composition among adolescents
Table 2 Descriptive analysis and comparison of nutritional diagnoses of adolescent boys and girls evaluated in private schools in Campinas, Brazil, in 2001 and 2010, according to BMI/age Z score of WHO 2007 charts. BMI Z-score
Girlsa
2010 were shorter (142.4 cm) than those evaluated in 2001 (148.1 cm). There were differences in %BF at G5 when the same time point was used for the comparison of different nutritional diagnoses (p < 0.0001 for 2001 and p < 0.0001 for 2010). When the diagnosis was the same and the time points varied, there were no statistical differences (p = 0.9318) between non-overweight boys, but differences were significant (p = 0.004) in the overweight group. At G5, %BF was greater for overweight boys in 2010 (20.5% in 2001 and 25.9% in 2010). Menarche was earlier for overweight girls in 2001 (12.08 years) and in 2010 (11.6 years) than for non-overweight girls (12.45 and 12.33 years); (p = 0.0214 in 2001 and p < 0.0001 in 2010).
Boysb
2001
2010
2001
2010
n, %
n, %
n, %
n, %
653
Underweight 9 (1.31) 5 (0.67) 7 (1.06) 17 (2.43) Normal weight 494 (72.12) 499 (66.53) 395 (59.85) 383 (54.71) Overweight 145 (21.17) 171 (22.88) 161 (24.39) 163 (23.29) Obese 37 (5.40) 75 (10.00) 97 (14.70) 137 (19.57) Total 685 (47.74) 750 (52.26) 660 (48.53) 700 (51.47) BMI, body mass index; ap = 0.0041, bp = 0.0183.
The results of height at B2 showed that the comparison of nutritional diagnoses at the same time point revealed no differences (p = 0.2665) between the height of non-overweight (146.7 cm) and overweight girls (148.1 cm) in 2001, but there were significant differences in 2010 (p = 0.0466), when these values were 146.1 cm and 142.4 cm. Overweight girls evaluated in 2010 were shorter than non-overweight girls. When the same nutritional diagnosis was compared at the two time points, there were no significant differences for non-overweight girls (p = 0.1956), but there were differences in the overweight group (p = 0.0002). Overweight girls evaluated in
Discussion This study evaluated the trend of obesity and overweight among Brazilian adolescents of a good socioeconomic condition and changes in BC according to maturation stage and nutritional diagnosis. Although there was an increase in the prevalence of obesity, there was no consistent increase in its intensity, as BC of overweight adolescents was, in general, similar in the two samples. Two samples with a representative number of individuals were analyzed, and overweight vs. non-overweight Girls
2001 30
Non-overweight 30 25
20 5.23
5.94
3.72
4.45
12.59
12.83
13.68
14.10
14.66
B1
B2
B3
B4
B5
2.89
BMI, kg/m2
BMI, kg/m2
25
15 10 5 0
2010
Non-overweight
20 15
0
14.38
B3
B4
B5
B1
B2
30 25 7.13
7.20
7.10
8.16
BMI, kg/m2
BMI, kg/m2
14.22
12.93
Overweight
25 9.20
15 10
0
13.55
12.13
Overweight
5
5.85
4.23
10 5
30
20
5.25
4.03
3.47
14.37
14.32
15.45
15.74
20
B2
B3
B4
13.80
14.25
14.91
15.92
16.23
B1
B2
B3
B4
B5
15
5 B1
0
B5 FMI
10.06
7.37
10
15.93
8.43
8.19
7.07
LMI
Figure 1 BMI median (LMI+FMI) according to Tanner maturation stage (breasts) of overweight and non-overweight girls evaluated in 2001 and 2010 in private schools of Campinas, Brazil. BMI, body mass index; LMI, lean mass index; FMI, fat mass index; B, breast. Authenticated |
[email protected] author's copy Download Date | 9/3/13 7:28 AM
654
Castilho et al.: Trends of body composition among adolescents
Boys
2001
2010 Non-overweight
30
30
25
25
20 15
2.58
2.65
14.02
14.00
10 5 0
2.98
2.56
2.43
20 15
2.38
5 G1
G2
G3
G4
0
G5
17.29
G4
G5
5.62
5.57
18.31
19.55
20.20
G3
G4
G5
15.19
G1
G2
G3 Overweight
6.48
25
5.29
5.13 6.05
6.68
BMI, kg/m2
BMI, kg/m2
17.06
14.43
30
25
15 10 15.34
19.51
19.25
17.12
15.89
20
5.45 5.97
6.60
15.39
15.47
G1
G2
15 10 5
5 0
2.80
13.61
Overweight 30
20
2.63
2.77
2.76
10
17.53
16.42
15.36
BMI, kg/m2
BMI, kg/m2
Non-overweight
G1
G2
G3
G4
0
G5 FMI
LMI
Figure 2 BMI median (LMI+FMI) according to Tanner maturation stage (genitalia) of overweight and non-overweight boys evaluated in 2001 and 2010 in private schools of Campinas, Brazil. BMI, body mass index; LMI, lean mass index; FMI, fat mass index; G, genitalia.
adolescents in the same socioeconomic group were compared using data collected by the same author at a 10-year interval. However, one of the limitations of this study was its crosssectional design, as it was difficult to interpret BC changes along the maturation process when the adolescents evaluated at each maturational stage were not the same. Therefore, differences in variables at only two time points (B2 and G5) should be interpreted carefully. Among Brazilian children and adolescents, the increase in the prevalence of overweight and obesity has been
documented for decades (4). Both in 2001 and 2010, obesity was more prevalent among boys (14.7% and 19.57%) than among girls (5.4% and 10%). However, while the percentage of obese boys increased 33.13%, that of girls almost doubled (85.19%). If this trend continues, in a few years there will be the same number of obese boys and girls in this social class, which points to a greater deterioration of female health. The increase in obesity has been parallel to a decrease in the number of individuals whose BMI was normal, whereas the percentage of underweight and overweight adolescents changed
Table 3 ANOVA results (p-values) after rank transformation comparing median variable measures of children and adolescents evaluated in private schools in Campinas, Brazil, according to time point (2001 and 2010) and nutritional diagnosis (overweight and non-overweight) to check possible interaction effects. Variables/ tanner stage
Girls
Boys
B1
B2
B3
B4
B5
G1
G2
G3
G4
G5
LM FM %BF Height BMI LMI FMI
0.5515 0.0531 0.4495 0.0724 0.8486 0.8196 0.6525
0.0484a 0.3187 0.7328 0.0275a 0.3853 0.3463 0.4581
0.7439 0.0757 0.6098 0.4146 0.1830 0.4813 0.4965
0.5113 0.2712 0.5292 0.2909 0.8046 0.7906 0.5952
0.1257 0.0819 0.2654 0.9528 0.1210 0.0594 0.1985
0.2763 0.0531 0.0706 0.4584 0.0515 0.2002 0.0692
0.1848 0.3187 0.3124 0.4076 0.3562 0.2110 0.4543
0.7760 0.0757 0.0511 0.6012 0.2972 0.9598 0.0532
0.4190 0.2712 0.1532 0.2033 0.6966 0.8408 0.1547
0.8122 0.0819 0.0324a 0.9839 0.7660 0.3471 0.0812
%BF, percentage body fat; BMI, body mass index; FMI, fat mass index; LMI, lean mass index; FM, fat mass; LM, lean mass; B, breast; G, genitalia.ap < 0.05. Authenticated |
[email protected] author's copy Download Date | 9/3/13 7:28 AM
Castilho et al.: Trends of body composition among adolescents
very little. Data of the 2008–2009 National Family Budget Survey in Brazil (15) showed that obesity and overweight increased among adolescents, but was greater among those of a higher socioeconomic class (34% of the boys and 24% of the girls in the highest income groups vs. 11.5% and 14.2% in the poorest groups). The same survey revealed a growing trend in the prevalence of obesity in the last 34 years (1974/75 and 2008/09) regardless of socioeconomic class, from 0.4% to 5.9% among boys aged from 10 to 19 years and from 0.7% to 4.0% among girls of the same age, an increase that, in contrast to what was found in our study, was greater among boys. According to Biro and Wien (16), children have been gaining more adipose tissue than expected. Several authors have studied changes in BC during maturation using different methods (6, 17–21). Mihalopoulos et al. (19) conducted a mixed study that evaluated 633 normal-weight boys and girls of good socioeconomic conditions, aged 8, 11 and 14 years, and followed them up for 4 years. They concluded that the increase in %BF during puberty is abnormal, particularly among boys. Their findings differ from those reported in other studies, which included adolescents but did not classify them according to nutritional diagnosis and found that girls gained both LM and FM during maturation (more FM than LM proportionally), whereas boys are expected to lose FM as they mature or, otherwise, run the risk of becoming overweight (6, 18, 20, 21). The analysis of this dynamic process should take into consideration that at certain times, such as at the beginning of the growth spurt, the high consumption of energy necessary to accelerate growth may complicate the evaluation of adiposity (22). In our study, the analysis of data for all adolescents found an increase in FMI both in overweight and nonoverweight girls. Moreover, the decrease of FMI among boys at the time they go from G1 to G5 is almost imperceptible in the non-overweight group. Although BMI has a good correlation with weight and body fat (23), during maturation, a time when this index usually increases, it is difficult to detect specific changes in LM and FM gains (24). Moreover, LM is heavier than FM and, therefore, fat increase may be underestimated. For this assessment, LMI and FMI are better choices (25). Biro et al. (17) also found that, although the correlation with LM is weak in individuals with a BMI above the median value, in those with a lower BMI the correlation is strong, and the opposite is true for FM. When comparing all adolescents, those with a BMI above normal values have more LM than those whose weight is normal, and, therefore, are heavier not only due to more adipose tissue. According to Wells (26), body shape provides valuable information about BC by the fact that fat and lean tissue deposit in different parts of the body. Therefore, while waist circumference reflects the amount of abdominal fat, hip circumference represents subcutaneous fat and shoulder diameter is more closely associated with lean mass. For this reason, overweight girls tend to express less intensively the dimorphism characteristic of the pubertal process. The analysis of maturation stages and nutritional diagnoses revealed no differences in median BMI, LMI and FMI between 2001 and 2010. Although the number of obese individuals was
655
higher, obesity did not become more intense in the same time interval. Differently from our findings, Ogden et al. (3) analyzed data of the National Health and Nutrition Examination Survey (NHANES) 2007–2008 and found that the prevalence of overweight and obesity in the USA has remained stable in the last 10 years, but that boys aged from 6 to 19 years with a higher BMI have become fatter. The nutritional transition that has taken place in Brazil in the last decades may explain these differences (27). While in Brazil undernourishment has been replaced by weight gain proportional to the greater food offer, in the USA the same eating errors may deteriorate the BC of individuals already obese. Obesity and overweight result in earlier menarche (28). The comparison of height and LM of obese and overweight girls in 2001 and 2010 suggests that in 2010 they started at a shorter height at the beginning of the growth spurt because they matured and menstruated earlier, which might be compensated during the coming stages due to the greater duration of the peak growth velocity period (13). This fact, however, should be analyzed carefully because this study evaluated puberty within the limitations of a cross-sectional study at two time points. High costs and the long time necessary for a cohort study favor cross-sectional studies, not the most appropriate design to study changes in BC during maturation because the individuals included in the evaluation in each maturation stage were not the same, and several factors, such as family eating habits, education, physical activity and sociocultural values, may be the source of biases that are not always controllable (26, 29). Limitations are greater when trends are to be compared. Boys with BMI greater than expected had a greater %BF at G5 in 2010. In this phase, growth slows down, and the imbalance between energy gain and expenditure, probably not detected in the previous maturation stages due to the energy consumed for growth, may now be noticed. If this increase in obesity intensity (%BF) is not an artifact of study design, it may point to a greater risk in adulthood of chronic diseases, such as heart diseases, diabetes and cancer, and the consequent increase in healthcare expenses (16). Several studies have discussed that fighting overweight is especially difficult because the roots of the problem go beyond laziness and overeating (30). The speed at which habits have changed may not have allowed time for adaptation (31). In fact, our organism is better prepared to protect us against weight loss than weight gain. In conclusion, the increase in obesity prevalence in both sexes is, alone, a sign of health deterioration among the population under study. If the increase of %BF in G5 is not a study bias, greater complications for human health may be expected. Urgent measures should be taken to reverse this trend, as well as to avoid that obese individuals become even more obese.
Acknowledgments We thank the Rectory of Pontifícia Universidade Católica de Campinas (PUC Campinas) for the grant received from its Undergraduate Research Fund (FAPIC/Reitoria).
Authenticated |
[email protected] author's copy Download Date | 9/3/13 7:28 AM
656
Castilho et al.: Trends of body composition among adolescents
References 1. Chan RS, Woo J. Prevention of overweight and obesity: how effective is current public health approach. Int J Environ Res Public Health 2010;7:765–83. 2. Low S, Chin MC, Deurenberg-Yap M. Review on epidemic of obesity. Ann Acad Med Singapore 2009;38:57–65. 3. Ogden CL, Carroll MD, Curtin LR, Lamb MM, Flegal KM. Prevalence of high body mass index in US children and adolescents, 2007–2008. J Am Med Assoc 2010;303:242–9. 4. Wang Y, Monteiro C, Popkin BM. Trends of obesity and underweight in older children and adolescents in United States, Brazil, China, and Russia. Am J Clin Nutr 2002;75:971–7. 5. World Health Organization. WHO Technical Report Series 894. Obesity: preventing and managing the global epidemic. Geneva: World Health Organization, 2000 (reprinted 2004): 253 pp. 6. Castilho SD, Cocetti M, de Azevedo Barros Filho A. Body mass index and body composition in relation to sexual maturation. J Pediatr Endocrinol Metab 2008;21:127–33. 7. Lomba-Albrecht LA, Styne DM. Effect of puberty on body composition. Curr Opin Endocrinol Diabetes Obes 2009;16: 10–5. 8. Soares JF, César CC, Mambrini J. Determinantes do desempenho dos alunos do ensino básico brasileiro: evidências do SAEB de 1997. Em C Franco (org) Avaliação, ciclos e promoção na educação (pp. 121–153). Porto Alegre: Artes médicas, 2001: 172 pp. 9. de Jesus GR, Laros JA. School effectiveness: multilevel regression of large scale assessment data. Avaliacao Psicol 2004;3: 93–106. 10. Alves MT, Soares JF. Medidas de nível socioeconômico em pesquisas sociais: uma aplicação de dados de uma pesquisa educacional. Opiniao Publica, Campinas 2009;15:1–30. 11. Colli AS. Crescimento e desenvolvimento pubertário em crianças e adolescentes brasileiros, VI: maturação sexual. São Paulo: Editora Brasileira de Ciências, 1988. 12. Anjos LA, Veiga GA, Castro IR. Distribuição dos valores do índice de massa corporal da população brasileira até 25 anos. Pan Am J Public Health 1998;3:164–73. 13. Tanner JM. Growth at adolescence, 2nd ed. Oxford: Blackwell Scientific Publications Ltd, 1962. 14. de Onis M, Onyango AW, Borghi E, Siyam A, Nishida C, Siekmann J. Development of a WHO growth reference for school-aged children and adolescents. Bull World Health Organ 2007;85:660–7. 15. Instituto Brasileiro de Geografia e Estatística. Pesquisa Nacional de Orçamentos Familiares 2008–2009. Antropometria e Estado Nutricional de Crianças, Adolescentes e Adultos no Brasil. Rio de Janeiro, 2010. Available at: http://www.ibge.gov.br/home/
estatistica/populacao/condicaodevida/pof/2008_2009_encaa/ default.shtm. 16. Biro FM, Wien M. Childhood obesity and adult morbidities. Am J Clin Nutr 2010;91:1499S–1505S. 17. Biro FM, Huang B, Morrison JA, Horn PS, Daniels SR. Body mass index and waist-to-height changes during teen years in girls are influenced by childhood body mass index. J Adolesc Health 2010;46:245–50. 18. Klapowitz PB. Link between body fat and the timing of puberty. Pediatrics 2008;121(Suppl 3):S208–17. 19. Mihalopoulos NL, Holubkov R, Young P, Daí S, Labarthe DR. Expected changes in clinical measures of adiposity during puberty. J Adolesc Health 2010;47:360–6. 20. Taylor RW, Grant AM, Williams SM, Goulding A. Sex differences in regional body fat distribution from pre- to postpuberty. Obesity (Silver Spring) 2010;18:1410–6. 21. Vink EE, van Coevern SC, van Mill EG, Felius BA, van Leerdam FJ, et al. Changes and tracking of fat mass in pubertal girls. Obesity (Silver Spring) 2010;18:1247–51. 22. Hillman JB, Biro FM. Dynamic changes of adiposity during puberty: life may not be linear. J Adolesc Health 2010;47: 322–3. 23. Pietrobelli A, Faith MS, Allison DB, Gallagher D, Chiumello G, et al. Body mass index as a measure of adiposity among children and adolescents: a validation study. J Pediatr 1998;132:204–10. 24. Maynard LM, Wisemandle W, Roche AF, Chumlea WC, Guo SS, et al. Childhood body composition in relation to body mass index. Pediatrics 2001;107:344–50. 25. Kyle UG, Schultz Y, Depertuis YM, Pichard C. Body composition interpretation. Contributions of fat-free mass index and the body fat mass index. Nutrition 2003;19:597–604. 26. Wells JC. Sexual dimorphism of body composition. Best Pract Res Clin Endocrinol Metab 2007;21:415–30. 27. Batista Filho M, Rissin A. A transição nutricional no Brasil: tendências regionais e temporais. Cad Saude Pública 2003;19(Suppl 1):S181–91. 28. Wang Y. Is obesity associated with early maturation? A comparison of the association in American boys versus girls. Pediatrics 2002;110:903–10. 29. Williams SM, Goulding A. Patterns of growth associated with the timing of adiposity rebound. Obesity (Silver Spring) 2009;17:335–41. 30. Hall KD, Sacks G, Chandramohan D, Chow CC, Wang YC, et al. Quantification of the effect of energy imbalance on bodyweight. Lancet 2011;378:826–37. 31. Slater ME, Sirard JR, Laska MN, Pereira M, Lytle LA. Relationships between energy balance knowledge and the home environment. J Am Diet Assoc 2011;111:556–60.
Authenticated |
[email protected] author's copy Download Date | 9/3/13 7:28 AM