ject model features that can be used to recognize the object and to determine ... The synthetic image data is used to bootstrap the prob- .... know the view point, we do not have to match a whole 3D model ... tual camera images is quite difficult.
Triplet-Based Object Recognition Using Synthetic and Real Probability Models Kari Pulli and Linda G. Shapiro Dept. of Comp. Sci. & Eng., University of Washington Seattle WA 98195-2350, U.S.A.
Abstract We describe a model-based object recognition system that uses a probabilistic model for recognizing and locating objects. For each major view class of each 3D object, a probability model consisting of triplets of visible features, their parametrization, and their frequency of detection is constructed from a set of synthetic training images. These synthetic probability models are used to recognize and locate the 3D object from real 2D camera images. The features captured from the real images are then used to create a new, more accurate probability model. Keywords: Model-based recognition, probability models.
1 Introduction Model-based object recognition systems attempt to find a set of correspondences between image features and 3D object model features that can be used to recognize the object and to determine its position and orientation (pose). CADmodel-based systems begin with geometric models of the 3D objects; these are used to determine features that can be used in the recognition process [1, 4, 7, 10, 13]. We use a probabilistic approach for evaluating partial matches, and our approach is related to PREMIO system of Camps [3], which constructs view-dependent probability models that incorporate the errors due to the interplay of surface reflectance properties, lighting conditions, and image processing operators. The system described in this paper is called TRIBORS (Triplet-Based Object Recognition System). Like PREMIO, TRIBORS uses synthesized images to create probability models for matching. TRIBORS differs from PREMIO in the following aspects:
� �
TRIBORS probability models are based on matching feature triplets whose parametrization is invariant to translation, rotation, and scaling. The matching is done by a hypothesize-and-test method rather than a full cost-based search.
Create synthetic images
Obtain real images
Match image lines by projecting a wireframe
Create Prob. Model: triplets, their parameters and frequencies
Match objects using the Prob. Model and a pose estimator
Prune the Probability Model
Create new Probability Model
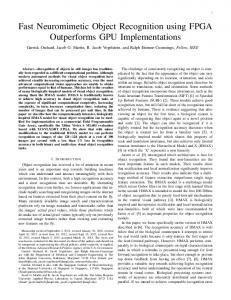
Figure 1: Creation of the Probability Model for matching.
�
The synthetic image data is used to bootstrap the probability models used in matching, but new probability models are created using features from real images.
In this paper we describe the training and matching methods employed by the TRIBORS system. Figure 1 gives an overview of our method and shows the steps in creating a probability model for matching objects.
2 Probability models
2.1 View classes The shape of the projection of a 3D object onto a 2D image plane can greatly change when the object is viewed from different directions. Small changes in view point, however, do not normally change the appearance very much. From this fact arises the idea of view classes [11, 5]. Definition 1 A view class is a set of views V , so that if �1 , �2 2 V and Si is a structural description of the features visible from �i , i 2 f1, 2g, then F� (S1 , S2 ) < � for some relational distance function F� and threshold �. The idea of view classes is very close to aspect graphs (see, e.g., [6]), but our formulation leads to far fewer view classes for an object than there would be aspects in an aspect graph. The determination of the correct view class could be done by geometric hashing [12] where some salient features vote for the directions where they can be observed, or the application can be one where only a few different view classes are possible. In this work, we assume that the view class has been either identified or hypothesized, and we look for a correct match and pose within a view class.
γ2
l2
l3
γ3
d3
θ3
d2 θ2 l1
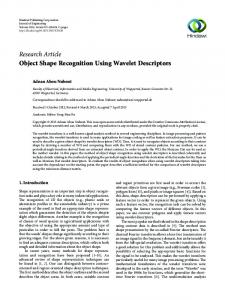
Figure 2: Parametrization of a line triplet. Concentrating on a single view class at a time makes it possible to do the actual matching for 3D objects in 2D. Parameters describing the projections of features and their interrelationships can be calculated, and many of them will remain in relatively compact volumes of the parameter space. Once the matching has been done in 2D, we can map the correspondences back to the 3D CAD model to calculate the pose of the object. Knowing the pose gives us a way of verifying the correctness of the match using 3D knowledge.
2.2 Feature triplets Our use of a succinct set of features, such as line triplets, as the basis for matching is motivated by the local feature focus method [2]. Our method is also related to representative patterns [9], but in our work, the line triplets are parametrized in a way that is invariant to translations, rotations and scaling on a plane. Definition 2 A triplet T is a tuple T = (L1 , L2 , L3 , P� , P� ) where L1 , L2 and L3 are three non-collinear line segments, and P� and P� are the means and standard deviations of the parametrization of T with respect to a view class V . Individual line triplets are often formed from the edges, but virtual line triplets can be derived by connecting feature locations: points, centers of holes, corners, etc. To enable matching of line triplets we need to parametrize their shapes. A robust representation of the features and their combinations remains invariant even when a triplet is translated or rotated on the image plane. Definition 3 A parametrization P of a triplet T with respect to a view class V is a tuple P = (D, O), where D is a tuple of distance parameters D = fl1 , l2 , l3 , d2 , d3 ) and O is a tuple of orientation parameters O = ( 2 , 3 , �2 , �3 ). Figure 2 shows the parametrization of a line triplet. The line with the arrow head is chosen to be the basis line, and all the distances and orientations are calculated relative to that. Three of the parameters, l1 , l2 and l3 , represent the lengths of the lines, and two parameters, d2 and d3 , represent the distances from the midpoint of the first line to the midpoints of the other two lines. Two parameters, �2 and
�3 , define the directions of the other lines' midpoints from the first line. In order to disambiguate the directions, we have to define a direction for the first line so that the midpoint of the second line lies counterclockwise from the first line, i.e., �2 must be in the range of [0, � ). The two remaining arguments, 2 and 3 , denote the difference of the orientations of the second and third lines from the base line. For disambiguation this angle is restricted to ( ?� , 0]. This parametrization is now invariant to translation and orientation on the image plane. Invariance with respect to scaling is achieved by dividing all the length parameters in D by the length of the base line l1 . We want to stress that only the parametrization of a 2D triplet is invariant to rotation, translation, and scaling. The same 3D feature triplet will produce different parameter values when viewed from different view points within a view class, but usually the parameter values do not vary much. Should the parameter values for some particular triplet vary a lot, the triplet will be judged unreliable and removed from the probability model.
2.3 Probability model de nition Definition 4 A probability model M is a set of tuples (T , pT ) where T is a triplet and pT is the probability of T being extracted from an image taken from some direction � 2 V , where V is the view class of M. 2.3.1 The information in a probability model Our probability model contains the identities of features used for matching, the expected parameter values, their distributions, and their frequency of appearance. The reason for calculating the frequencies of appearance of an object or of a feature is that we can penalize or disqualify an unlikely choice. If we have models for several objects or for several view classes of an object, we can associate a higher matching cost for the models that seldom appear. We can also prune the probability model by discarding rare combinations of features or those that are often matched incorrectly. So that we can match features, we need to know what they look like, i.e., what are the expected values � and the standard deviations � of the parameters describing the features. These parameters give us a way of normalizing the differences in parameter values. The distance of a parameter p from its expected value �p can be normalized by p0 =
j p ? �p j . �p
(1)
The normalized distances are summed together to get the total cost of the fit. One may want to be able to express the relative relevance of parameters by giving variables different
relative weights; in that case the total cost C(Fimage , Fmodel ) of mapping image features Fimage to model features Fmodel becomes the weighted sum C(Fimage , Fmodel ) =
X
wi � p0i .
(2)
pi 2Fmodel
2.3.2 Building the probability model Initially we have a bootstrapping problem: to be able to calculate a probability model that can be used to expedite matching, we need to have a set of matched images showing the line correspondences. We do not know the accurate relative positions between the camera and the object in the real images. However, if we generate a set of images ourselves, we know the values of these parameters. We first construct a geometric description of the object along with the colors and reflectivities of the surfaces and the lighting parameters. Then a ray tracer is called several times to create views from several viewing directions so that the view points cover the view class uniformly. Since we know the view point, we do not have to match a whole 3D model, but only the 2D projections of the 3D lines against the extracted 2D lines. The matched lines are used in constructing the probability model. Obtaining synthetic images that are very much like actual camera images is quite difficult. The reflectance properties of the real objects are not quite uniform and simple to model, even if the whole object is manufactured from the same material. The reflectance model of the graphics system may not be realistic enough; ray tracing is good in producing shadows and specular reflections, but it ignores diffuse reflections. Even if the graphics system takes care of the global illumination to various degrees of approximation, the lighting conditions with filtered flood lights and indirect lighting may be difficult to model. Regardless of the limitations, the synthetic images provide an approximation of the real data that is often good enough to produce probability models for matching real images. Having matched image lines to model lines we can combine the matched 2D lines to triplets and calculate the triplet detection probabilities as well as the parameter means and standard deviations. 2.3.3 Pruning the probability model We start building the probability model by creating all the possible triplets. We calculate the frequency of appearance for each triplet (the probability term pT of Def. 4) by counting the number of training images in which all three lines of the triplet were detected. If that frequency is too low, the triplet is discarded. For each permutation of each remaining triplet, we calculate the means P� and standard deviations P� of the pa-
rameters. Since parameter sets with small standard deviations allow fewer false matches, we retain only the permutation whose squared sum of standard deviations is the smallest. For the remaining triplets and for all the images where all the lines of the triplet have been detected, we calculate the cost of fitting the correct three lines. This is done by calculating the parameters P , normalizing with P� the differences from P� using Eq. 1 and summing them up using Eq. 2. Then, for each image, we calculate the costs of the fits for all possible line triplets created from the extracted lines and count how many false triplets, on the average, have a lower fitting cost than the correct one. Triplets that are quite different from the other possible triplets tend to do well here: their fitting cost is rather low compared to the costs of fitting random triplets. On the other hand, when there are random triplets within the view class that have parameters similar to a given triplet, that triplet is likely to do poorly. Such undistinguished triplets are removed in this phase.
3 Matching In our system, we assume that the object is known and the view class has been identified or hypothesized. Matching is thus the process of finding the correspondence between triplets of the image and triplets of the view class, estimating the pose of the object, and verifying the match.
3.1 Matching the model triplets to the image features Our matching procedure begins by extracting edges from the input image. We then randomly choose a batch of a few triplets from the probability model and search for image line triplets that resemble a model line triplet in the batch. The matching or fitting cost is defined by taking the absolute value of the difference of each triplet parameter value from the expected value. Since the different parameters have different types (some measure relative angles, others relative distances or lengths) and some parameters vary more than the others, the differences are not directly comparable. Therefore the differences are normalized and summed, using Eqs. 1 and 2. Because the line orientations can be recovered more accurately than the lengths, the orientation terms will receive greater weights wi in Eq. 2. Our matching method allows for changes in the scale, i.e., the observation distance can be greater or smaller than the distance used when the training set was created. This is achieved by calculating a scaling factor by averaging the individual ideal scaling factors of the different parameters: s=
1 5
X a2D
�a , a
D = fl1 , l2 , l3 , d2 , d3 g.
(3)
The scaling factor s is used as the weight wi for the distance parameters in Eq. 2, but the user can give the allowed range of s and hence determine the allowed distance range.
3.2 Initial pose estimation Once we have determined which image line triplets have a low matching cost against the model triplets, we hypothesize for each low cost match that it is a correct match. The next step is to obtain an initial estimate for the pose of the object. Our matching method does not depend on any particular pose estimation algorithm. We used an iterative, point-to-point, correspondence-based exterior orientation algorithm described in [8].
3.3 Match veri cation So far we have guessed the identity of an object and its pose based on a small set of features. Now we need to verify that hypothesis. The pose estimate we have allows us to predict locations of the other object features by projecting the visible features of the object onto the image. The verification starts with the creation of a wireframe image of the object model so that the pose of the wireframe equals the initial pose estimate. The visibility of the edges of the wireframe can be determined by a hidden line detection algorithm. Once the visible edges and their locations have been predicted, the algorithm searches for image lines that would inexactly match them. For each predicted edge, the closest image line is found; however, one image line can map to only one predicted edge and vice versa. If the initial pose estimate was close to the correct pose, more matching lines in addition to the three from the current triplet can be found. In that case the new line matches give more information to the pose estimator, and a new, more accurate estimate is obtained. This pose estimation - line matching cycle is iterated as long as more line pairs can be matched. There are two numbers on the basis of which we can determine the success of the match verification. One is the number of matched lines and the other is the sum of the fitting costs for the line matches. Once we can match real images using the probability model created from synthetic images, it is possible to take several different images from typical viewing directions within a view class at the application site with the existing lighting conditions and camera parameters. The images are analyzed and matched, and the recovered features are stored. The resulting data can be used to create a new probability model that better fits the conditions at the application site.
4 Results We tested our system using two 3D objects called c3c and fork. Probability models were generated for three view classes of c3c and for two view classes of fork.
Figure 3: Representative images from the five view classes. For testing the matching algorithm we took 100 real camera images. The images form five sets of 20 images that each represent a view class. Each view class contains two image sets taken from a different distance. Within the 10-image sets the object is placed in a stable position and it is slightly manually rotated from image to image.
Figure 4: The complete set of images for one of the view classes. The viewing directions for the synthesized images used for synthetic probability models were chosen so that they cover the view class approximately uniformly. Figure 5 (a) shows a typical synthesized image.
Figure 5: (a) A synthesized image of c3c. (b) Extracted edges. (c) The matched lines of the synthesized image. Notice that several of the visible edges could not be reliably extracted: the contrasts over the edges may have been low, and in few cases the line detection algorithm broke an edge into two. The fact that we get results like this from synthesized images shows that the matching algorithm needs to be robust against missing and sometimes erroneous data in order to work with real images. Using the collection of matched lines from all the synthesized images within the view class, a synthetic probability model consisting of parametrized triplets was created. This enabled the procedure to actually match real images, by first finding potential matches based on triplet information and
then verifying the match, while at the same time refining the pose estimate of the object. Figure 6 shows the steps in matching the first image of Fig. 3. Figure 6 (a) shows the results of edge detection. Notice that although the orientations of the real object and the synthesized one are almost the same, and light comes from the same direction in both images, there are several edge lines detected in the synthetic image that were not detected in the real image, and conversely some edge lines in the real image that were not detected in the synthetic image. Figure 6 (b) shows the results of the initial match of a probability model triplet (the thick lines) and the initial pose estimation. In this particular case, fourteen of the detected lines were considered to match some model lines. The pose was then re-estimated using this new and larger set of line correspondences, producing 24 line correspondences. Another round did not improve the result (Fig. 6 (c)).
Figure 6: (a) The edges extracted from the real image. (b) The matched triplet (thick lines) and the initial pose estimate. (c) The final match and pose. Our algorithm was able to correctly match and obtain the pose for all 100 test images using the probability model created from the synthesized images. This was achieved without any special handtuning: once we got the system working reliably for a single test image, it was able to match all 99 other images. Figure 7 presents the matching results for the fifth view class.
the four image line triplets that matched it best. We then tested whether any of the four candidates would lead to a full match. The following table shows the results. For example, using image 3 of the first view class of the object c3c, the synthetic probability model yielded a match in 14.3% of the tries, whereas the real probability model yielded a match in 17.5% of the tries. The results show that in most cases the real probability model performs better. object view image synth real
c3c 1 3
fork
2 17
3
3 17
3
Avrg
1 17
3
2 17
3
17
14.3 12.2
11.1 9.3
17.6 23.3
12.0 16.5
11.6 21.9
14.98
17.5 11.6
12.2 12.2
33.8 44.6
14.7 15.8
19.3 37.5
21.92
5 Conclusions The TRIBORS system uses the probability model concept developed by Camps for PREMIO [3], but employs a hypothesize-and-test matching scheme that matches parametrized model triplets to similar image triplets. Although implemented only for triplets of line segments, the method is equally applicable to triplets of other features, as long as each feature has a detectable distinguished point, such as a centroid. Matching results on 100 real images from five view classes of two polyhedral objects were 100% successful, although such a high success rate would not be expected on more difficult objects with less discernable features. Tests that compare the use of synthetic probability models to their real counterparts showed that the recognition rate of the triplets of a real model was higher than that of a synthetic model, which directly translates to faster recognition.
References [1] F. Arman and J. K. Aggarwal. Automatic generation of recognition strategies using cad models. In IEEE Workshop on Directions on Automated CAD-Based Vision, pages 116–124, 1991. [2] R. C. Bolles and R. A. Cain. Recognizing and locating partially visible objects: The local-feature-focus method. International Journal of Robotics Research, 1(3):57–82, 1982. [3] O. I. Camps, L. G. Shapiro, and R. M. Haralick. A probabilistic matching algorithm for computer vision. Annals of Mathematics and Artificial Intelligence, 6(1-2), 1994. [4] C-H Chen and P. G. Mulgaonkar. Cad-based feature-utility measures for automatic vision programming. In IEEE Workshop on Directions on Automated CAD-Based Vision, pages 106–114, 1991. [5] S. Chen and H. Freeman. On the characteristic view of quadric surfaced solids. In IEEE Workshop on Directions on Automated CAD-Based Vision, pages 34–43, 1991. [6] S. J. Dickinson, A. P. Pentland, and A. Rosenfeld. From volumes to views: An approach to 3-d object recognition. In IEEE Workshop on Directions on Automated CAD-Based Vision, pages 85–96, 1991.
Figure 7: Matching results: a white wireframe shows where the program thinks the object is.
[7] P. J. Flynn and A. K. Jain. 3d object recognition using invariant feature indexing of interpretation tables. In IEEE Workshop on Directions on Automated CAD-Based Vision, pages 115–123, 1991. [8] R. M. Haralick and L. G. Shapiro. Computer and Robot Vision, volume 2. Addison-Wesley, New York, 1992.
Finally, we tested whether there is any difference in the performance of the probability models generated from synthetic vs. real image data. For each view class we generated a real probability model using the matched lines of 18 images, leaving two images outside of the training set. Then we compared the performance of the synthetic and real probability models in matching the two images. For each triplet in a probability model, we searched for
[9] J. Henikoff and L. G. Shapiro. Representative patterns for model-based matching. 26(7):1087–1098, 1993.
Pattern Recognition,
[10] K. Ikeuchi. Generating an interpretation tree from a cad model for 3d-object recognition in bin-picking tasks. International Journal of Computer Vision, 1(2):145–165, 1989. [11] K. B. Thornton and L. G. Shapiro. Image matching for view class construction. In Proc. 6th Israeli Conf. on AI, Vision, and Pattern Recognition, pages 220–229, 1989. [12] F. C. D. Tsai. Geometric hashing with line features. Pattern Recognition, 27(3):377–389, 1994. [13] M. D. Wheeler and K. Ikeuchi. Sensor modeling, probabilistic hypothesis generation, and robust localization for object recognition. PAMI, 17(3):252–265, 1995.