Sep 30, 2004 ... JavaTM 2 Platform, Standard Edition 5.0 ... Sun, Sun Microsystems, the Sun logo,
Java, Jini, Solaris, J2SE, JDK, JDBC, Java HotSpot, JMX and.
JavaTM 2 Platform, Standard Edition 5.0
Troubleshooting and Diagnostic Guide
1
Copyright (c) 2007 Sun Microsystems, Inc., 4150 Network Circle, Santa Clara, California 95054, U.S.A. All rights reserved. This distribution may include materials developed by third parties. Sun, Sun Microsystems, the Sun logo, Java, Jini, Solaris, J2SE, JDK, JDBC, Java HotSpot, JMX and NetBeans are trademarks or registered trademarks of Sun Microsystems, Inc. in the U.S. and other countries. All SPARC trademarks are used under license and are trademarks or registered trademarks of SPARC International, Inc. in the U.S. And other countries. Products bearing SPARC trademarks are based upon architecture developed by Sun Microsystems, Inc. UNIX is a registered trademark in the U.S. and other countries, exclusively licensed through X/Open Company, Ltd. The PostScript logo is a trademark or registered trademark of Adobe Systems, Incorporated.
2
Table of Contents Preface..................................................................................................................................................6 About this Document...................................................................................................................6 Target Audience and Prerequisites...............................................................................................6 Structure of this Document..........................................................................................................6 Document History........................................................................................................................7 Feedback and Suggestions...........................................................................................................7 Limitations of this Document.......................................................................................................7 Other Resources...........................................................................................................................7 Commercial Support....................................................................................................................8 Community Support.....................................................................................................................9 1 Diagnostics Tools and Options.........................................................................................................10 1.1 Introduction..............................................................................................................................10 1.1.1 Caveats and Other Notes...................................................................................................10 1.1.2 Post-Mortem Diagnostics .................................................................................................11 1.1.3 Hung Processes.................................................................................................................11 1.1.4 Monitoring Tools..............................................................................................................12 1.1.5 Other Tools and Options...................................................................................................12 1.2 jinfo..........................................................................................................................................14 1.3 jmap .........................................................................................................................................16 1.3.1 Heap Configuration and Usage.........................................................................................16 1.3.2 Heap Histogram...............................................................................................................17 1.3.3 Getting Information on the Permanent Generation............................................................18 1.4 jstack.........................................................................................................................................20 1.5 jconsole.....................................................................................................................................24 1.6 jps.............................................................................................................................................27 1.7 jstat ..........................................................................................................................................28 1.7.1 visualgc.............................................................................................................................30 1.8 HPROF - Heap Profiler............................................................................................................31 1.9 HeapDumpOnOutOfMemoryError Option...............................................................................36 1.10 HeapDumpOnCtrlBreak Option..............................................................................................36 1.11 Heap Analysis Tool.................................................................................................................37 1.12 Java Heap Analysis Tool (jhat)...............................................................................................39 1.13 Fatal Error Handling...............................................................................................................40 1.13.1 Fatal Error Log................................................................................................................40 1.13.2 OnError Option...............................................................................................................40 1.13.3 ShowMessageBoxOnError Option..................................................................................41 1.14 dbx..........................................................................................................................................44 1.15 Using jdb to Attach to a Core File or Hung Process................................................................46 1.15.1 Attaching to a Process.....................................................................................................46 1.15.2 Attaching to a Core File..................................................................................................48 1.16 Ctrl-Break Handler.................................................................................................................50 1.16.1 Deadlock Detection.........................................................................................................52 1.17 Other Options and System Properties.....................................................................................55 1.17.1 -verbose:gc......................................................................................................................55 1.17.2 -verbose:class..................................................................................................................55 1.17.3 -Xcheck:jni option...........................................................................................................55 1.17.4 -verbose:jni.....................................................................................................................57 3
1.17.5 JAVA_TOOL_OPTIONS Environment Variable...........................................................57 1.17.6 java.security.debug System Property...............................................................................58 1.18 Operating System Tools..........................................................................................................59 1.18.1 Solaris Operating System................................................................................................59 1.18.2 Linux ..............................................................................................................................60 1.18.3 Microsoft Windows.........................................................................................................60 1.18.4 Solaris 10 Operating System Tools.................................................................................60 1.18.4.1 Improved pmap........................................................................................................61 1.18.4.2 Improved pstack......................................................................................................61 1.18.4.3 dtrace.......................................................................................................................61 1.19 Developing Diagnostic Tools..................................................................................................63 2 Troubleshooting Information............................................................................................................66 2.1 Diagnosing Memory Leaks.......................................................................................................67 2.1.1 What does OutOfMemoryError mean?.............................................................................67 2.1.2 Diagnosing Leaks in Java Language Code........................................................................69 2.1.2.1 The NetBeans Profiler...............................................................................................69 2.1.2.2 Using HAT................................................................................................................69 2.1.2.3 Obtaining an Object Histogram on Solaris or Linux..................................................72 2.1.2.4 Obtaining an Object Histogram at VM Shutdown on Solaris....................................73 2.1.2.5 Monitoring the Number of Objects that are Pending Finalization..............................74 2.1.2.6 Third Party Memory Debuggers................................................................................74 2.1.3 Diagnosing Leaks in Native Code.....................................................................................74 2.1.3.1 Using dbx to find leaks..............................................................................................76 2.1.3.2 Using libumem on Solaris 10 to Find Leaks..............................................................77 2.2 Crashes....................................................................................................................................79 2.2.1 Format of the Fatal Error Log...........................................................................................79 2.2.1.1 Header.......................................................................................................................79 2.2.1.2 Thread.......................................................................................................................81 2.2.1.3 Process......................................................................................................................84 2.2.1.4 System.......................................................................................................................89 2.2.2 Sample Crashes.................................................................................................................93 2.2.2.1 Crash in Native Code................................................................................................93 2.2.2.2 Crash due to a Stack Overflow..................................................................................94 2.2.2.3 Crash in a HotSpot Compiler Thread.........................................................................95 2.2.2.4 Crash in Compiled Code............................................................................................95 2.2.2.5 Crash in the VM Thread............................................................................................96 2.2.3 Finding a Workaround......................................................................................................96 2.2.3.1 Crash in HotSpot Compiler Thread or Compiled Code..............................................96 2.2.3.2 Crash during Garbage Collection..............................................................................98 2.2.3.3 Class Data Sharing....................................................................................................99 2.2.4 Visual C++ Version........................................................................................................100 2.3 Hangs and Looping Processes.................................................................................................101 2.3.1 Diagnosing a Looping Process........................................................................................101 2.3.2 Diagnosing a Hung Process.............................................................................................102 2.3.3 Solaris 8 Thread Library.................................................................................................105 2.4 Signal Handling......................................................................................................................106 2.4.1 Signal Handling on Solaris and Linux.............................................................................106 2.4.1.1 Reducing Signal Usage............................................................................................107 2.4.1.2 Alternative Signals..................................................................................................107 2.4.1.3 Signal Chaining.......................................................................................................107 4
2.4.2 Exception Handling on Windows....................................................................................108 2.4.2.1 Signal Handling in the HotSpot Virtual Machine....................................................110 2.4.2.2 Console Handlers.....................................................................................................110 3 Submitting Bug Reports.................................................................................................................112 3.1 Collecting Data for a Bug Report............................................................................................113 3.2 Collecting Core Dumps...........................................................................................................117 3.2.1 Collecting Core Dumps on Solaris..................................................................................117 3.2.1.1 Suspending a Process using truss.............................................................................118 3.2.2 Collecting Core Dumps on Linux....................................................................................118 3.2.3 Reasons for Not Getting a Core File...............................................................................119 3.2.4 Collecting Crash Dumps on Windows.............................................................................121 3.2.4.1 Configuring Dr Watson...........................................................................................121 3.2.4.2 Forcing a Crash Dump............................................................................................123
5
Preface About this Document This document is a guide to help troubleshoot problems that might arise with applications that are developed using the Sun Microsystems Inc. release of JavaTM 2 Platform, Standard Edition Development Kit 5.0 (JDKTM 5.0 release or J2SE 5.0 release). The document provides a description of the tools, command line options, and other items that can be used when analyzing a problem. The document also provides guidance on how to approach some general issues such as a crash, hang, or memory resource issues. Finally the document provides direction for the data collection and the process to follow when preparing a bug report or support call. This present document addresses possible problems between the application and the Java HotSpotTM virtual machine. For help in troubleshooting applications that use the Java SE desktop technologies (for example, AWT, Java 2D, Swing, and others), see the Troubleshooting Guide for Java SE 6 Desktop Technologies, which applies to both releases 5.0 and 6 of Java SE: PDF: http://java.sun.com/javase/6/webnotes/trouble/TSG-Desktop/TSG-Desktop.pdf HTML: http://java.sun.com/javase/6/webnotes/trouble/TSG-Desktop/html/toc.html
Target Audience and Prerequisites The target audience for this document is both developers who are working with J2SE 5.0 and support or administration persons who maintain applications that are deployed with J2SE 5.0. In both cases the document assumes some prerequisite knowledge. Readers should have at least a high-level understanding of the components of the Java Virtual Machine and also have some understanding of concepts such as garbage collection, threads, native libraries, and so on. In addition, it is assumed that the reader is reasonably proficient on the operating system where the J2SE application is installed.
Structure of this Document This document is structured into three chapters: Chapter 1 describes the command line utilities, options, and log files available in J2SE 5.0. Many of the utilities are new in 5.0 and were not available in earlier releases. It also provides a list of the operating system tools and utilities that may be used in conjunction with the J2SE utilities and options. Readers should peruse this chapter to get acquainted with the capabilities of the utilities and options that are available. Chapter 2 deals with issues of memory leaks, crashes, hangs, and applications that use signal handlers. The chapter includes a detailed descripion of the fatal error log and suggestions on things to try when you encounter a problem. Chapter 3 provides guidance on how to submit a bug report. It includes suggestions on what to try before submitting a report and suggestions on what data to collect for the report. 6
Document History Version Date
Changes
September 30, 2004
JDK5.0
April 2006
Corrections to Signal Handling section
October 2006
Correction to example output of using jdb to attach to a process
December 2006
Updated directory name in example to improve formatting
August 2007
Added links to Troubleshooting Guide for Java SE 6 Desktop Technologies. Now using new Feedback form in place of visible email address. Updated links from SDN Support site to SDN Services site. Minor corrections.
September 2007
Added 3 new options: HeapDumpOnOutOfMemoryError, HeapDumpPath, HeapDumpOnCtrlBreak.
Feedback and Suggestions Troubleshooting is a very important topic. If you have feedback on this document or if you have suggestions for topics that could be covered in a future version, use the Feedback Form (http://developers.sun.com/contact/feedback.jsp?category=javase). Fill in the relevant fields and click Send. Note: Do not use this feedback form for support requests: they will not be answered. Technical support is provided at the Services site for Sun Developer Network (http://developers.sun.com/services).
Limitations of this Document The initial version of this document is focused on providing information about the tools and options available for diagnostics and monitoring. It does not include information on garbage collection or diagnosing performance issues at this time.
Other Resources In addition to this document the reader should be aware of other online troubleshooting resources. For help in troubleshooting applications that use the Java SE desktop technologies (for example, AWT, Java 2D, Swing, and others), see the Troubleshooting Guide for Java SE 6 Desktop Technologies, which applies to both releases 5.0 and 6 of Java SE: PDF: http://java.sun.com/javase/6/webnotes/trouble/TSG-Desktop/TSG-Desktop.pdf HTML: http://java.sun.com/javase/6/webnotes/trouble/TSG-Desktop/html/index.html 7
The Garbage Collection Tuning document for J2SE 5.0 can be found here: http://java.sun.com/docs/hotspot/gc5.0/gc_tuning_5.html The J2SE 5.0 Installation Notes for the Microsoft Windows platform provides tips to work around issues that can arises during or following installation: http://java.sun.com/j2se/1.5.0/install-windows.html#troubleshooting The Java Plugin Guide provides a troubleshooting FAQ and in addition provides information on how to enable tracing when trying to diagnose issues with the Java Plugin: http://java.sun.com/j2se/1.5.0/docs/guide/plugin/developer_guide/contents.html The Java Web Start FAQ has a troubleshooting section dealing with issues that might arise with Java Web Start: http://java.sun.com/products/javawebstart/faq.html The bug database can be a useful resource to search for problems and solutions. The bug database can be found at: http://developer.java.sun.com/developer/bugParade/index.jshtml
Commercial Support Sun provides a wide range of support offerings, from developer technical support for software developers using Sun development products or technologies, to support for production systems in enterprise environments. Two support options are summarized here: 1. Developer Technical Support This is development time support aimed at developers who are using Sun development products or technologies, and are working at the source code level of their own applications. Email and telephone support is available. Single incident, multiple incident, and yearly support options are available. The type of support provided by the Developer Technical Support offering includes responding to technical questions, providing diagnostic/troubleshooting help, suggesting best practices, and bug escalation. More details on this support offering can be found at the Services site for Sun Developer Network (http://developers.sun.com/services).
2. Java Multiplatform Support offering
8
This support offering is designed to provide production support for shipping releases of Java technology-based applications using Sun's Java 2 Runtime Environments and distributed to end users in heterogeneous environments. The support offering helps on optimizing application performance and helps reduce time spent keeping applications up and running. The highest level of this support offering can include accelerated access to an engineer and emergency software fixes. More details on this support offering are available here :http://www.sun.com/service/sunps/jdc/javamultiplatform.html
Community Support Community support can often be obtained using the Java Technology Forums. The forums provide a way to share information and locate solutions to problems. The forums are here: http://forums.java.sun.com
9
1 Diagnostics Tools and Options 1.1 Introduction This chapter introduces the various diagnostic and monitoring tools which can be used with J2SE 5.0. The tools described here include command line utilities, command line options, and log files. In almost all cases the command line utilities described in this chapter are either included in the Java 2 Platform Standard Edition Development Kit (JDK 5.0), or are operating system tools and utilities. Although the JDK 5.0 command line utilities are included in the JDK download, it is important to note that they can be used to diagnose issues and monitor applications that are deployed with the Java 2 Platform Standard Edition Runtime Environment 5.0 (JRE 5.0). In general, the diagnostic tools and options described in this chapter use various mechanisms to obtain the information they report. In many cases the mechanisms are specific to the virtual machine implementation (5.0 in the case of this document), operating system, and version of each. Consequently, there is some overlap of the information reported by some of the tools. This should be viewed in the context of the various problems and issues for which these tools are intended. In many cases only a subset of the tools will be applicable to an issue at a particular point in time.
1.1.1 Caveats and Other Notes Some of the command line utilities described in this chapter are experimental. The jstack, jinfo, and jmap utilities are examples of utilities that are experimental. These utilities are subject to change in future JDK releases, and may not be included in future releases. The format of log files and other output from command line utilities or options is version specific. For example, if you develop a script that relies on the format of the fatal error log (hs_err_pid.log file) then this script may cease to work as expected if the format of the log file changes in the future. Command line options that are prefixed with -XX are Java HotSpotTM Virtual Machine specific options. In general, most -XX options are unsupported, undocumented, and were originally included for the purposes of testing components of the HotSpot Virtual Machine during its development. However many -XX options are important for performance tuning and diagnostic purposes, and are therefore described in this chapter. In some cases, the command tool utilities described here are not included in the JDK release on all operating systems. For example, the jstack, jinfo, and jmap command line utilities are included in the JDK release for Solaris and Linux only. In addition to operating system specific utilities we also describe a number of diagnostic features and tools that are specific to the Solaris 10 Operating Environment. Solaris 10 has many advanced diagnostic features that are usable in production environments, and many of the native tools are capable of providing information that is specific to the Java Runtime Environment.
10
1.1.2 Post-Mortem Diagnostics A number of the options and tools described in this chapter are designed for post-mortem diagnostics. That is, if the application crashes because of an application or JRE bug, these are the options and tools that can be used to obtain additional information (either at the time of the crash or later using information from the crash dump). Tool or Option
Description and Usage
Fatal Error Log
The fatal error log (hs_err_.log) contains a lot of information obtained at the time of the fatal error (crash). In many cases it will be the first thing to examine when a crash happens.
-XX:OnError
Used to specify a sequence of user-supplied scripts or commands to be executed when a fatal error (crash) occurs. For example, on Windows, it can be used to execute a command to force a crash dump – very useful on systems that do not have post-mortem debugger configured.
-XX:+ShowMessageBoxOnError
Used to suspend the process when a fatal error (crash) occurs. Depending on the user response it can launch the native debugger (dbx, gdb, msdev) to attach to the VM. The option is very useful in the development environment to attach the native debugger when a crash happens.
jinfo (Solaris and Linux only)
The jinfo utility can obtain configuration information from a core file obtained from a crash (or a core obtained using the gcore utility).
jmap (Solaris and Linux only)
The jmap utility can obtain memory map information, including a heap histogram, from a core file obtained from a crash (or a core obtained using the gcore utility).
jstack
jdb
(Solaris and Linux only)
(Solaris and Linux only)
Native tools
The jstack utility can obtain java and native stack information from a core file obtained from a crash (or a core obtained using the gcore utility). The debugger support in the JDK includes an AttachingConnector which allows jdb, and other Java Language debuggers to attach to a core file. This can be very useful when trying to understand what the application was doing at the time of the crash. Each operating system has native tools and utilities that can be used for post-mortem diagnosis. A list of native tools is provided later in this chapter.
1.1.3 Hung Processes Some of the options and tools described in this chapter can help in scenarios involving a hung or deadlocked process. Tools in the following list do not require that the application be started with any special options. 11
Tool or Option Ctrl-Break Handler
jstack
jdb
(Solaris and Linux only)
(Solaris and Linux only)
Native tools
Description and Usage Used to get thread dump information. It also executes a deadlock detection algorithm and will report any deadlocks detected involving synchronized code. The jstack utility can obtain java and native stack information from a running process even in cases where the ctrl-break handler does not respond. The debugger support in the JDK includes an AttachingConnector which allows jdb, and other Java Language debuggers to attach to a hung process. This can be useful when trying to understand what each thread is doing at the time of the hang/deadlock. Each operating system has native tools and utilities that can be useful in hang/deadlock scenarios. A list of native tools is provided later in this chapter.
1.1.4 Monitoring Tools The following options and tools described in this chapter are designed for monitoring running applications. Tool
Description and Usage
jconsole
The JDK includes a Java Management Extensions (JMX)based monitoring tool called jconsole. The tool uses the built-in JMX instrumentation in the Java Virtual Machine to provide information on performance and resource consumption of running applications.
jstat
The jstat utility uses the built-in instrumentation in the HotSpot VM to provide information on performance and resource consumption of running applications. The tool can be used when diagnosing performance issues, and in particular issues related to heap sizing and garbage collection. The utility does not require that the application be started with any special options as instrumentation is enabled by default.
Native tools
Each operating system has native tools and utilities that can be useful for monitoring purposes. The dynamic tracing (dtrace) capability on Solaris 10 can do very advanced monitoring. A list of native tools is provided later in this chapter.
1.1.5 Other Tools and Options In addition to the tools listed in the previous categories this chapter also describes a number of options and tools that can be useful to diagnose other issues : 12
Tool or Option
Description and Usage
HPROF Profiler
The HPROF profiler is a simple profiler included in the JDK. It is capable of presenting CPU usage, heap allocation statistics and monitor contention profiles. In addition it can also report complete heap dumps and states of all the monitors and threads in the Java virtual machine. In terms of diagnosing problems, HPROF can be useful when analyzing performance, lock contention, memory leaks, and other issues.
Heap Analysis Tool (HAT)
The Heap Analysis Tool (HAT) is not included in JDK 5.0 but it can be downloaded from the java.net site. It is a useful tool when diagnosing unnecessary object retention (or memory leaks). It can be used to browse an object dump, view all reachable objects in the heap, and understand which references are keeping an object alive.
Java Heap Analysis Tool (jhat)
The jhat utility provides several improvements over HAT. See section 1.12. It is delivered with Java SE 6 but can read heap dumps created on Java SE 5.0 systems.
-XX:+HeapDumpOnOutOfMemoryError
Used to generate a heap dump when the VM detects an OutOfMemoryError. (Introduced in Java SE 5.0 update 7.)
-XX:+HeapDumpOnCtrlBreak
Used to generate a heap dump with Ctrl-Break. (Introduced in Java SE 5.0 update 14.)
-Xcheck:jni
The -Xcheck:jni option is useful option when trying to diagnose problems with applications that use the Java Native Interface (JNI). This option can be be useful when an application employs third-party libraries (some JDBC drivers for example).
13
1.2 jinfo The jinfo command-line utility gets configuration information from a running java process or crash dump. It is included in the Solaris and Linux releases of the JDK. It is not included in the JDK5.0 release on Windows. prints the system properties or the command line flags that were used to start the VM. Following is an example to demonstrate the output: jinfo
$ jinfo 19846 Attaching to process ID 19846, please wait... Debugger attached successfully. Server compiler detected. JVM version is 1.5.0-rc-b63 Java System Properties: java.runtime.name = Java(TM) 2 Runtime Environment, Standard Edition sun.boot.library.path = /net/server/export/disk09/jdk/1.5.0/rc/b63/binaries/solsparc/jre/lib/sparc java.vm.version = 1.5.0-rc-b63 java.vm.vendor = Sun Microsystems Inc. java.vendor.url = http://java.sun.com/ path.separator = : java.vm.name = Java HotSpot(TM) Server VM file.encoding.pkg = sun.io sun.os.patch.level = unknown java.vm.specification.name = Java Virtual Machine Specification user.dir = /space/user/jakarta-tomcat-5.0.12/bin java.runtime.version = 1.5.0-rc-b63 java.awt.graphicsenv = sun.awt.X11GraphicsEnvironment java.endorsed.dirs = /space/user/jakarta-tomcat-5.0.12/common/endorsed os.arch = sparc java.io.tmpdir = /space/user/jakarta-tomcat-5.0.12/temp line.separator = java.vm.specification.vendor = Sun Microsystems Inc. java.naming.factory.url.pkgs = org.apache.naming os.name = SunOS sun.jnu.encoding = ISO646-US java.library.path = /net/server/export/disk09/jdk/1.5.0/rc/b63/binaries/solsparc/jre/lib/sparc/server :/net/server/export/disk09/jdk/1.5.0/rc/b63/binaries/solsparc/jre/lib/sparc:/net/ server/export/disk09/jdk/1.5.0/rc/b63/binaries/solsparc/jre/../lib/sparc:/usr/lib java.specification.name = Java Platform API Specification java.class.version = 49.0 sun.management.compiler = HotSpot Server Compiler os.version = 5.10 user.home = /home/user catalina.useNaming = true user.timezone = Asia/Calcutta java.awt.printerjob = sun.print.PSPrinterJob file.encoding = ISO646-US java.specification.version = 1.5 catalina.home = /space/user/jakarta-tomcat-5.0.12 java.class.path = /net/myserver/export1/user/j2sdk1.5.0/lib/tools.jar:/space/user/jakarta-tomcat5.0.12/bin/bootstrap.jar
14
user.name = user java.naming.factory.initial = org.apache.naming.java.javaURLContextFactory java.vm.specification.version = 1.0 java.home = /net/server/export/disk09/jdk/1.5.0/rc/b63/binaries/solsparc/jre sun.arch.data.model = 32 user.language = en java.specification.vendor = Sun Microsystems Inc. java.vm.info = mixed mode java.version = 1.5.0-rc java.ext.dirs = /net/server/export/disk09/jdk/1.5.0/rc/b63/binaries/solsparc/jre/lib/ext sun.boot.class.path = /space/user/jakarta-tomcat5.0.12/common/endorsed/xercesImpl.jar:/space/user/jakarta-tomcat5.0.12/common/endorsed/xmlParserAPIs.jar:/net/server/export/disk09/jdk/1.5.0/rc/b 63/binaries/solsparc/jre/lib/rt.jar:/net/server/export/disk09/jdk/1.5.0/rc/b63/bi naries/solsparc/jre/lib/i18n.jar:/net/server/export/disk09/jdk/1.5.0/rc/b63/binar ies/solsparc/jre/lib/sunrsasign.jar:/net/server/export/disk09/jdk/1.5.0/rc/b63/bi naries/solsparc/jre/lib/jsse.jar:/net/server/export/disk09/jdk/1.5.0/rc/b63/binar ies/solsparc/jre/lib/jce.jar:/net/server/export/disk09/jdk/1.5.0/rc/b63/binaries/ solsparc/jre/lib/charsets.jar:/net/server/export/disk09/jdk/1.5.0/rc/b63/binaries /solsparc/jre/classes java.vendor = Sun Microsystems Inc. catalina.base = /space/user/jakarta-tomcat-5.0.12 file.separator = / java.vendor.url.bug = http://java.sun.com/cgi-bin/bugreport.cgi sun.io.unicode.encoding = UnicodeBig sun.cpu.endian = big sun.cpu.isalist = sparcv9+vis2 sparcv9+vis sparcv9 sparcv8plus+vis sparcv8plus sparcv8 sparcv8-fsmuld sparcv7 sparc VM Flags: -Djava.endorsed.dirs=/space/user/jakarta-tomcat-5.0.12/common/endorsed -Dcatalina .base=/space/user/jakarta-tomcat-5.0.12 -Dcatalina.home=/space/user/jakartatomcat-5.0.12 -Djava.io.tmpdir=/space/user/jakarta-tomcat-5.0.12/temp
The above example was based on a Jakarta Tomcat server. The “VM Flags” output shows that the server is using the endorsed override mechanism to override the implementation of some classes – this type of information is useful when, for example, an XML-related issue requires investigation. The classpath and bootclasspath output can also be very useful for debugging class loader issues. In addition to obtaining information from a process, the jinfo tool can use a core file as input. On Solaris, for example, we could use the gcore utility to get a core file of the Tomcat process in the above example. The core file will be named core.19846 and will be generated in the working directory of the process. The path to the java executable and the core file must be specified as arguments. jinfo $JAVA_HOME/bin/java core.19846
(JAVA_HOME indicates the home directory of the JDK installation.) Sometimes the binary name will not be “java”. This arises when the VM is created using the JNI invocation API. The jinfo tool requires the binary from which the core file was generated. For more information, the manual page for jinfo is available at: http://java.sun.com/j2se/1.5.0/docs/tooldocs/share/jinfo.html 15
1.3 jmap The jmap command-line utility is included in the Solaris and Linux releases of the JDK. It is not included in the JDK5.0 release on Windows. jmap prints memory related statistics for a running VM or core file. If jmap is used with a process or core file without any command line options then it prints the list of shared objects loaded (the output is similar to the Solaris pmap utility). For more specific information the -heap, -histo, or -permstat options can be used. These are described in the following sections.
1.3.1 Heap Configuration and Usage The -heap option is used to obtain java heap information including: 1. GC algorithm specific information: This includes the name of the GC algorithm (Parallel GC for example) and algorithm specific details (such as number of threads for parallel GC). 2. Heap configuration: The heap configuration may have been specified as command line options or selected by the VM based on the machine configuration. 3. Heap usage summary: For each generation it prints the total capacity, in-use and available free memory. If a generation is organized as a collection of spaces (the new generation for example), then a space-wise memory size summary is included. The following is example output from jmap -heap : $ jmap -heap 19846 Attaching to process ID 19846, please wait... Debugger attached successfully. Server compiler detected. JVM version is 1.5.0-rc-b63 using thread-local object allocation. Parallel GC with 2 thread(s) Heap Configuration: MinHeapFreeRatio MaxHeapFreeRatio MaxHeapSize NewSize MaxNewSize OldSize NewRatio SurvivorRatio PermSize MaxPermSize
= = = = = = = = = =
40 70 536870912 (512.0MB) 2228224 (2.125MB) 4294901760 (4095.9375MB) 1441792 (1.375MB) 2 32 16777216 (16.0MB) 67108864 (64.0MB)
Heap Usage: PS Young Generation Eden Space: capacity = 9240576 (8.8125MB) used = 9159544 (8.735221862792969MB) free = 81032 (0.07727813720703125MB) 99.12308496786348% used From Space: capacity = 2555904 (2.4375MB)
16
used = 2431992 (2.3193283081054688MB) free = 123912 (0.11817169189453125MB) 95.1519305889423% used To Space: capacity = 2686976 (2.5625MB) used = 0 (0.0MB) free = 2686976 (2.5625MB) 0.0% used PS Old Generation capacity = 25165824 (24.0MB) used = 2426464 (2.314056396484375MB) free = 22739360 (21.685943603515625MB) 9.641901652018229% used PS Perm Generation capacity = 16777216 (16.0MB) used = 9523600 (9.082412719726562MB) free = 7253616 (6.9175872802734375MB) 56.765079498291016% used
1.3.2 Heap Histogram The -histo option can be used to obtain a class-wise histogram of the heap. For each class, it prints the number of objects, memory size in bytes, and fully qualified class name. Note that internal classes in the HotSpot VM are prefixed with an “*”. The histogram is useful when trying to understand how the heap is used. To get the size of an object you need to divide the total size by the count of that object type. The following shows an example of jmap -histo output: $ jmap -histo 19846 Attaching to process ID 19846, please wait... Debugger attached successfully. Server compiler detected. JVM version is 1.5.0-rc-b63 Iterating over heap. This may take a while... Object Histogram: Size Count Class description ------------------------------------------------------4473488 44525 char[] 2663464 21830 * ConstMethodKlass 1575128 21830 * MethodKlass 1297600 40550 java.util.HashMap$ValueIterator 1272064 34452 * SymbolKlass 1262664 52611 java.lang.String 1129928 2142 byte[] 1042984 1761 * ConstantPoolKlass 80235240186 org.apache.catalina.Container[] 6730721535 * ConstantPoolCacheKlass 6518321761 * InstanceKlassKlass 5524564326 int[] 3482404353 java.lang.reflect.Method 3189604430 org.apache.naming.resources.FileDirContext$FileResourceAttributes
17
2861363274 java.lang.Object[] 2321205815 java.lang.String[] 2178009075 java.util.HashMap$Entry 2020002005 java.util.HashMap$Entry[] 1760962393 short[] 1747681986 java.lang.Class 142808495 * MethodDataKlass 1393842771 java.lang.Object[] 1070246689 java.io.File 81336 3389 java.util.Hashtable$Entry 79080 1977 java.util.HashMap 70560 4410 java.lang.StringBuilder 66600 875 java.util.Hashtable$Entry[] 63400 3733 java.lang.Class[] 60032 1876 java.util.LinkedHashMap$Entry 56448 196 * ObjArrayKlassKlass 49608 2067 java.util.ArrayList 44832 1401 java.lang.ref.SoftReference 41408 1294 org.apache.xerces.dom.DeferredAttrImpl 38232 1593 java.lang.ref.WeakReference 37104 1546 java.io.ExpiringCache$Entry 35520 555 org.apache.commons.modeler.AttributeInfo 35008 2188 javax.management.modelmbean.DescriptorSupport$CaseIgnoreString 33880 847 java.util.Hashtable 31344 653 java.beans.MethodDescriptor 23160 222 java.lang.reflect.Method[] 22976 359 java.lang.reflect.Constructor 19952 325 javax.management.modelmbean.ModelMBeanAttributeInfo[] 19416 809 org.apache.xerces.xni.QName 18336 382 org.apache.xerces.dom.DeferredElementImpl 17280 720 java.util.Vector 17264 83 org.apache.catalina.core.StandardWrapper 16744 299 java.nio.DirectByteBuffer 14472 603 javax.management.ObjectName$Property 14400 450 org.apache.xerces.dom.DeferredTextImpl 13376 209 java.beans.PropertyDescriptor 11960 299 sun.misc.Cleaner [... more lines removed here to reduce output ...] 8 1 sun.reflect.GeneratedMethodAccessor31 Heap traversal tool 7.12 seconds.
1.3.3 Getting Information on the Permanent Generation The permanent generation is the area of heap that holds all the reflective data of the virtual machine itself, such as class and method objects (also called “method area” in The Java Virtual Machine Specification). Configuring the size of the permanent generation can be important for applications that dynamically generate and load a very large number of classes (Java Server Pages/web containers for example). If an application loads “too many” classes then it is possible it will abort with an OutOfMemoryError. The specific error is: “Exception in thread XXXX java.lang.OutOfMemoryError: PermGen space” (See section 2.1.1 for a description of this and other reasons for OutOfMemoryError.)
18
To get further information about the permanent generation, the -permstat option can be used. It prints statistics for the objects in the permanent generation. Here is a sample of the output: $ jmap -permstat 19846 Attaching to process ID 19846, please wait... Debugger attached successfully. Server compiler detected. JVM version is 1.5.0-rc-b63 finding class loader instances .. done. computing per loader stat ..done. please wait.. computing liveness..........................................................done. class_loader
classes bytes
parent_loader
alive? type
0xee431d58 0xee3fbd08 0xee3fb860 0xee3fc330 0xee3fc4f8 0xee431578 0xee431198 0xee431f68 0xee3fb4b0 0xee3fc628 [.. more lines total = 65
1189 2727472 null live 1 1392 0xee22b3d0 dead sun/reflect/DelegatingClassLoader@0xd4042360 1 1400 0xee227418 dead sun/reflect/DelegatingClassLoader@0xd4042360 1 1400 0xee227ba0 dead sun/reflect/DelegatingClassLoader@0xd4042360 1 1400 0xee227418 dead sun/reflect/DelegatingClassLoader@0xd4042360 1 1400 0xee227418 dead sun/reflect/DelegatingClassLoader@0xd4042360 1 1400 0xee227418 dead sun/reflect/DelegatingClassLoader@0xd4042360 1 1400 null dead sun/reflect/DelegatingClassLoader@0xd4042360 1 1400 0xee22b3d0 dead sun/reflect/DelegatingClassLoader@0xd4042360 1 848 null dead sun/reflect/DelegatingClassLoader@0xd4042360 1 1392 0xee227418 dead sun/reflect/DelegatingClassLoader@0xd4042360 removed here to reduce output...] 2303 5900688 N/A alive=11, dead=54 N/A
For each class loader object, the following details are printed: 1. The address of the class loader object – at the snapshot when the utility was run. 2. The number of classes loaded (defined by this loader with the method java.lang.ClassLoader.defineClass). 3. The approximate number of bytes consumed by meta-data for all classes loaded by this class loader. 4. The address of the parent class loader (if any). 5. A “live” or “dead” indication – indicates whether the loader object will be garbage collected in the future. 6. The class name of this class loader. For more information, refer to the jmap manual page at: http://java.sun.com/j2se/1.5.0/docs/tooldocs/share/jmap.info
19
1.4 jstack The jstack command-line utility is included in the Solaris and Linux releases of the JDK. It is not included in the JDK5.0 release on Windows. The utility attaches to the specified process (or core file) and prints the stack traces of all threads that are attached to the virtual machine (this includes Java threads and VM internal threads). A stack trace of all threads can be useful when trying to diagnose a number of issues such as deadlocks or hangs. In many cases a thread dump can be obtained by pressing Ctrl-\ at the application console (standard input) or by sending the process a QUIT signal (section 1.16). Thread dumps can also be obtained programmatically using the Thread.getAllStackTraces method, or in the debugger using the debugger option to print all thread stacks (the “where” command in the case of the jdb sample debugger). In these examples the VM process must be in a state where it can execute code. In rare cases (for example if you encounter a bug in the thread library or HotSpot VM) this may not be possible, but it may be possible with the jstack utility as it attaches to the process using an operating system interface. Here is example output from the jstack command to demonstrate how the output looks :
$ jstack 7034 Debugger attached successfully. Server compiler detected. JVM version is 1.5.0-rc-b63 Thread t@44: (state = BLOCKED) - java.lang.Object.wait(long) (Interpreted frame) - java.lang.Object.wait(long) (Interpreted frame) - org.apache.tomcat.util.threads.ThreadPool$MonitorRunnable.run() @bci=8, line=549 (Interpreted frame) - java.lang.Thread.run() @bci=11, line=595 (Interpreted frame) Thread t@43: (state = IN_NATIVE) - java.net.PlainSocketImpl.socketAccept(java.net.SocketImpl) (Interpreted frame) - java.net.PlainSocketImpl.socketAccept(java.net.SocketImpl) (Interpreted frame) - java.net.PlainSocketImpl.accept(java.net.SocketImpl) @bci=7, line=384 (Interpreted frame) - java.net.ServerSocket.implAccept(java.net.Socket) @bci=50, line=450 (Interpreted frame) - java.net.ServerSocket.accept() @bci=48, line=421 (Interpreted frame) - org.apache.jk.common.ChannelSocket.accept(org.apache.jk.core.MsgContext) @bci=12, line=278 (Interpreted frame) - org.apache.jk.common.ChannelSocket.acceptConnections() @bci=71, line=572 (Interpreted frame) - org.apache.jk.common.SocketAcceptor.runIt(java.lang.Object[]) @bci=4, line=758 (Interpreted frame) - org.apache.tomcat.util.threads.ThreadPool$ControlRunnable.run() @bci=174, line=666 (Interpreted frame) - java.lang.Thread.run() @bci=11, line=595 (Interpreted frame) Thread t@42: (state = BLOCKED) - java.lang.Object.wait(long) (Interpreted frame) - java.lang.Object.wait(long) (Interpreted frame)
20
- java.lang.Object.wait() @bci=2, line=474 (Interpreted frame) - org.apache.tomcat.util.threads.ThreadPool$ControlRunnable.run() @bci=19, line=642 (Interpreted frame) - java.lang.Thread.run() @bci=11, line=595 (Interpreted frame) Thread t@41: (state = BLOCKED) - java.lang.Object.wait(long) (Interpreted frame) - java.lang.Object.wait(long) (Interpreted frame) - java.lang.Object.wait() @bci=2, line=474 (Interpreted frame) - org.apache.tomcat.util.threads.ThreadPool$ControlRunnable.run() @bci=19, line=642 (Interpreted frame) - java.lang.Thread.run() @bci=11, line=595 (Interpreted frame) [... more lines removed here to reduce output ...]
The jstack utility can also try to obtain stack traces from a core dump: jstack $JAVA_HOME/bin/java core
(JAVA_HOME indicates the JDK installation directory.) For each thread, it prints the thread identifier (an integer) and the thread state. The following are the possible thread states that can be printed: UNINTIALIZED
Thread is not created. This will normally not happen (unless there is a serious bug such as memory corruption).
NEW
Thread has been created but it has not started running yet.
IN_NATIVE
Thread is running native code.
IN_VM
Thread is running VM code.
IN_JAVA
Thread is running (either interpreted or compiled) Java code.
BLOCKED
Thread is blocked.
..._TRANS
If you see any of the above states but followed by "_TRANS", it means the thread is changing to a different state.
These are the thread states as of JDK5.0 – future releases may include new or different states. After the thread information, there is a line of output for each java stack frame formatted as follows: java.lang.Thread.run() @bci=11, line=595 (Interpreted frame) | | | | | | | | | +-- Method compiled/interpreted? | | | +-------------- Source line number | | +----------------------- Byte code index | +------------------------------ Method name +----------------------------------------------- Fully qualified class name
21
The bci and line are not printed for JNI/native methods. If a method accepts arguments, then the argument types are printed (as shown below) so that overloaded methods can be differentiated. org.apache.jk.common.SocketAcceptor.runIt(java.lang.Object[]) @bci=4, line=758 (Interpreted frame)
The jstack utility may also be used to print a mixed stack. That is, it can print native stack frames in addition to the java stack. Native frames are the C/C++ frames associated with VM code, and JNI/native code. To print a mixed stack the -m option is used. An output example follows: $ jstack -m 7034 Debugger attached successfully. Server compiler detected. JVM version is 1.5.0-rc-b63 ----------------- t@1 ----------------0xff32cf84 _so_accept + 0x4 0xfa8db248 Java_java_net_PlainSocketImpl_socketAccept + 0x200 0xf880c280 * java.net.PlainSocketImpl.socketAccept(java.net.SocketImpl) bci:7852 (Interpreted frame) 0xf880c224 * java.net.PlainSocketImpl.socketAccept(java.net.SocketImpl) bci:0 (Interpreted frame) 0xf8805764 * java.net.PlainSocketImpl.accept(java.net.SocketImpl) bci:7 line:384 (Interpreted frame) 0xf8805764 * java.net.ServerSocket.implAccept(java.net.Socket) bci:50 line:450 (Interpreted frame) 0xf8805764 * java.net.ServerSocket.accept() bci:48 line:421 (Interpreted frame) 0xf8805874 * org.apache.catalina.core.StandardServer.await() bci:74 line:552 (Interpreted frame) 0xf8805c2c * org.apache.catalina.startup.Catalina.await() bci:4 line:634 (Interpreted frame) 0xf8805764 * org.apache.catalina.startup.Catalina.start() bci:113 line:596 (Interpreted frame) 0xf8800218 0xfe98dfd8 void JavaCalls::call_helper(JavaValue*,methodHandle*,JavaCallArguments*,Thread*) + 0x528 0xfea25954 oopDesc*Reflection::invoke(instanceKlassHandle,methodHandle,Handle,int,objArrayHandle,Bas icType,objArrayHandle,int,Thread*) + 0x14a8 0xfeaeac9c oopDesc*Reflection::invoke_method(oopDesc*,Handle,objArrayHandle,Thread*) + 0x268 0xfeae8ca8 JVM_InvokeMethod + 0x234 0xfe7a0314 Java_sun_reflect_NativeMethodAccessorImpl_invoke0 + 0x10 method entry point (kind = native) 0xf880c224 * sun.reflect.NativeMethodAccessorImpl.invoke0(java.lang.reflect.Method, java.lang.Object, java.lang.Object[]) bci:0 (Interpreted frame) 0xf8805874 * sun.reflect.NativeMethodAccessorImpl.invoke(java.lang.Object, java.lang.Object[]) bci:87 line:39 (Interpreted frame) 0xf8805874 * sun.reflect.DelegatingMethodAccessorImpl.invoke(java.lang.Object, java.lang.Object[]) bci:6 line:25 (Interpreted frame) 0xf8805d3c * java.lang.reflect.Method.invoke(java.lang.Object, java.lang.Object[]) bci:111 line:585 (Interpreted frame) 0xf8805874 * org.apache.catalina.startup.Bootstrap.start() bci:31 line:295 (Interpreted frame) 0xf8805764 * org.apache.catalina.startup.Bootstrap.main(java.lang.String[]) bci:114 line:392 (Interpreted frame) 0xf8800218 0xfe98dfd8 void JavaCalls::call_helper(JavaValue*,methodHandle*,JavaCallArguments*,Thread*) + 0x528 0xfeac8160 jni_CallStaticVoidMethod + 0x46c
22
0x000123b4 main + 0x1314 0x00011088 _start + 0x108 [... more thread stacks removed here to reduce output ...]
Note that the output in the previous example was obtained using the following command (where JAVA_HOME indicates the JDK installation directory): jstack -m $JAVA_HOME/bin/java core | c++filt
Frames prefixed with '*' are Java frames, and others are native C/C++ frames. The output of the utility was piped through c++filt to demangle C++ mangled symbol names. The HotSpot Virtual Mahcine is developed in the C++ Language so jstack prints C++ mangled symbol names for the HotSpot internal functions. For more information, the manual page for jstack is available at: http://java.sun.com/j2se/1.5.0/docs/tooldocs/share/jstack.html
23
1.5 jconsole J2SE 5.0 has comprehensive monitoring and management support. Among the tools included in the JDK download is a Java Management Extensions (JMX)-compliant monitoring tool called jconsole. The tool uses the built-in JMX instrumentation in the Java Virtual Machine to provide information on performance and resource consumption of running applications. Although the tool is included in the JDK download it can also be used to monitor and manage applications deployed with the Java 2 Platform Standard Edition Runtime Environment 5.0 (JRE 5.0). jconsole can attach to any application that is started with the JMX agent. A system property defined on the command line enables the JMX agent. Once attached jconsole can be used to display useful information such as thread usage, memory consumption, and details about class loading, runtime compilation, and the operating system. Following is an overview of the information that can be monitored using jconsole. Each heading corresponds to a tab pane in the monitoring tool: Summary • • •
Uptime: how long the JVM has been running Total compile time: the amount of time spent in runtime compilation Process CPU time: the total amount of CPU time consumed by the JVM
Memory • • • • •
Current heap size: Number of Kbytes currently occupied by the heap Committed memory: Total amount of memory allocated for use by the heap Maximum heap size: Maximum number of Kbytes occupied by the heap Objects pending for finalization: Number of objects pending for finalization Garbage collector information: Information on GC, including the garbage collector names, number of collections performed, and total time spent performing GC
Threads • • • •
Live threads: Current number of live daemon threads plus non-daemon threads Peak: Highest number of live threads since JVM started Daemon threads: Current number of live daemon threads Total started: Total number of threads started since the JVM started (including daemon, nondaemon, and terminated)
Classes • • •
Current classes loaded: Number of classes currently loaded into memory Total classes loaded: Total number of classes loaded into memory since the JVM started, including those subsequently unloaded Total classes unloaded: Number of classes unloaded from memory since the JVM started
Operating System • • •
Total physical memory: Amount of random-access memory (RAM) that the machine has. Free physical memory: Amount of free RAM the machine has. Committed virtual memory: Amount of virtual memory guaranteed to be available to the running process.
24
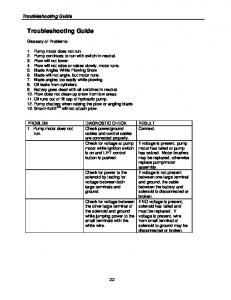
In addition to monitoring, jconsole can be used to dynamically change several parameters in the running system. For example, the setting of the -verbose:gc option can be changed so that garbage collection trace output can be dynamically enabled or disabled for a running application. A complete tutorial on the jconsole tool is beyond the scope of this document. However getting started with jconsole is straight-forward : 1. Start the application with the -Dcom.sun.management.jmxremote option. This option sets the com.sun.management.jmxremote system property which enabled the JMX agent. 2. Start jconsole with the jconsole command. Jconsole ships as a binary in the $JAVA_HOME/bin directory. (JAVA_HOME indicates the home directory of the J2SE installation.) 3. When jconsole starts, it shows a window with the list of managed VMs on the machine. The process-id (pid) and command line arguments for each VM are printed. Select a VM, and jconsole will attach to it. As an example of the output of the monitoring tool, following is a sample screen-shot showing a chart of heap memory usage:
25
In summary, jconsole can be useful in providing high-level diagnosis on problems such as memory leaks, excessive class loading or running threads. It can also be useful when tuning or heap sizing. jconsole can also be used to view more detailed information about the running application. For example, it can examine the stack traces of running threads, if the application has additional instrumentation. The following documents describe in more detail the monitoring and management capabilities, and how to use jconsole: Monitoring and Management for the Java Platform : http://java.sun.com/j2se/1.5.0/docs/guide/management/index.html Monitoring and Management Using JMX : http://java.sun.com/j2se/1.5.0/docs/guide/management/agent.html Using jconsole : http://java.sun.com/j2se/1.5.0/docs/guide/management/jconsole.html
26
1.6 jps The jps utility lists the instrumented HotSpot Virtual Machines on the target system. The utility is very useful in environments where the VM is embedded (meaning it is started using the JNI Invocation API rather than the java launcher). In these environments it is not always easy to recognize the java processes in the process list. The following example demonstrates its usage : $ jps 16217 MyApplication 16342 jps
The utility lists the virtual machines for which the user has access rights. This is determined by operating system specific access control mechanisms. On Solaris, for example, if a non-root user executes the jps utility then it lists the virtual machines that were started with that user's uid. In addition to listing the process id the utility provides options to output the arguments passed to the application's main method, the complete list of VM arguments, and the full package name of the application's main class. jps can also list processes on a remote system if the remote system is running the jstat daemon (jstatd). The documentation for the utility can be found here : http://java.sun.com/j2se/1.5.0/docs/tooldocs/share/jps.html The document includes examples that obtain the process status from a remote host. The utility is included in the JDK download for all operating system platforms supported by Sun. However, the HotSpot instrumentation is not accessible on Windows 98 or Windows ME. In addition the instrumentation may not be accessible on Windows if the temporary directory is on a FAT32 file system1.
1 Workarounds to this issue can be found in the FAQ at http://developers.sun.com/dev/coolstuff/jvmstat/faq.html
27
1.7 jstat The jstat utility uses the built-in instrumentation in the HotSpot VM to provide information on performance and resource consumption of running applications. The tool can be used when diagnosing performance issues, and in particular issues related to heap sizing and garbage collection. The jstat utility does not require the VM to be started with any special options. The built-in instrumentation in the HotSpot VM is enabled by default. The utility is included in the JDK download for all operating system platforms supported by Sun. However, the instrumentation is not accessible on Windows 98 or Windows ME2. Following are the jstat utility options : •
-class – prints statistics on the behavior of the class loader.
•
-compiler – prints statistics of the behavior of the HotSpot compiler.
•
-gc – prints statistics of the behavior of the garbage collected heap.
•
-gccapacity – prints statistics of the capacities of the generations and their corresponding spaces.
•
-gccause – prints the summary of garbage collection statistics (same as -gcutil), with the cause of the last and current (if applicable) garbage collection events.
•
-gcnew – prints statistics of the behavior of the new generation.
•
-gcnewcapacity - prints statistics of the sizes of the new generations and its corresponding spaces.
•
-gcold – prints statistics of the behavior of the old and permanent generations.
•
-gcoldcapacity – prints statistics of the sizes of the old generation.
•
-gcpermcapacity – print statistics of the sizes of the permanent generation.
•
-gcutil – prints a summary of garbage collection statistics.
•
-printcompilation – prints HotSpot compilation method statistics.
The jstat tool documentation provides a complete description of the tool : http://java.sun.com/j2se/1.5.0/docs/tooldocs/share/jstat.html The documentation includes a number of examples. A few of these examples are repeated here. The jstat utility uses a vmid to identify the target process. The documentation describes the syntax of a vmid but in the simplest case a vmid can be a local virtual machine identifier. In the case of Solaris, Linux, and Windows, it can be considered to be the process id. (This is typical but may not always be the case.) Here is an example of the -gcutil option. The example attaches to lvmid 21891 and takes 7 samples 2 Instrumentation is also not accessible on Windows NT, 2000, or XP if a FAT32 file system is used. 28
at 250 millisecond intervals and displays the output as specified by the -gcutil option. jstat -gcutil 21891 250 7 S0 S1 E O 12.44 0.00 27.20 9.49 12.44 0.00 62.16 9.49 12.44 0.00 83.97 9.49 0.00 7.74 0.00 9.51 0.00 7.74 23.37 9.51 0.00 7.74 43.82 9.51 0.00 7.74 58.11 9.51
P 96.70 96.70 96.70 96.70 96.70 96.70 96.71
YGC 78 78 78 79 79 79 79
YGCT 0.176 0.176 0.176 0.177 0.177 0.177 0.177
FGC
5 5 5 5 5 5 5
FGCT 0.495 0.495 0.495 0.495 0.495 0.495 0.495
GCT 0.672 0.672 0.672 0.673 0.673 0.673 0.673
The output of this example shows that a young generation collection occurred between the 3rd and 4th sample. The collection took 0.001 seconds and promoted objects from the eden space (E) to the old space (O), resulting in an increase of old space utilization from 9.49% to 9.51%. Before the collection, the survivor space was 12.44% utilized, but after this collection it is only 7.74% utilized. The following example attaches to lvmid 21891 and takes samples at 250 millisecond intervals and displays the output as specified by the -gcutil option. In addition, it uses the -h3 option to output the column header after every 3 lines of data. jstat -gcnew -h3 21891 250 S0C S1C S0U S1U 64.0 64.0 0.0 31.7 64.0 64.0 0.0 31.7 64.0 64.0 35.4 0.0 S0C S1C S0U S1U 64.0 64.0 35.4 0.0 64.0 64.0 35.4 0.0 64.0 64.0 0.0 19.0 S0C S1C S0U S1U 64.0 64.0 0.0 19.0
TT MTT 31 31 31 31 2 31 TT MTT 2 31 2 31 31 31 TT MTT 31 31
DSS 32.0 32.0 32.0 DSS 32.0 32.0 32.0 DSS 32.0
EC 512.0 512.0 512.0 EC 512.0 512.0 512.0 EC 512.0
EU 178.6 355.5 21.9 EU 245.9 421.1 84.4 EU 306.7
YGC 249 249 250 YGC 250 250 251 YGC 251
YGCT 0.203 0.203 0.204 YGCT 0.204 0.204 0.204 YGCT 0.204
In addition to showing the repeating header string, this example shows that between the 2nd and 3rd samples, a young GC occurred. Its duration was 0.001 seconds. The collection found enough live data that the survivor space 0 utilization (S0U) would have exceeded the Desired Survivor Size (DSS). As a result, objects were promoted to the old generation (not visible in this output), and the tenuring threshold (TT) was lowered from 31 to 2. Another collection occurs between the 5th and 6th samples. This collection found very few survivors and returned the tenuring threshold to 31. This example attaches to lvmid 21891 and takes 3 samples at 250 millisecond intervals. The -t option is used to generate a time stamp for each sample in the first column. A small font is used here so that the output doesn't wrap. jstat -gcoldcapacity -t 21891 250 3 Timestamp OGCMN OGCMX 150.1 1408.0 60544.0 150.4 1408.0 60544.0 150.7 1408.0 60544.0
OGC 11696.0 13820.0 13820.0
OC 11696.0 13820.0 13820.0
YGC 194 194 194
FGC 80 81 81
FGCT 2.874 2.938 2.938
GCT 3.799 3.863 3.863
The Timestamp column reports the elapsed time in seconds since the start of the target JVM. In 29
addition, the -gcoldcapacity output shows the old generation capacity (OGC) and the old space capacity (OC) increasing as the heap expands to meet allocation and/or promotion demands. The old generation capacity (OGC) has grown from 11696 KB to 13820 KB after the 81st Full GC (FGC). The maximum capacity of the generation (and space) is 60544 KB (OGCMX), so it still has room to expand.
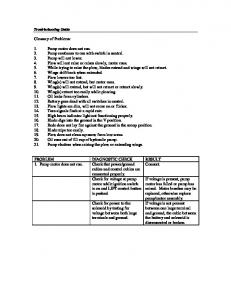
1.7.1 visualgc A related tool to jstat is the visualgc tool. The visualgc tool provides a graphical view of the garbage collection system. As with jstat it uses the built-in instrumentation of the HotSpot VM. The visualgc tool is not included in JDK5.0 but is available as a separate download from this site : -http://developers.sun.com/dev/coolstuff/jvmstat/index.html Following is a sample screen-shot to demonstrate how the GC and heap are visualized :
30
1.8 HPROF - Heap Profiler HPROF is a simple profiler agent shipped with JDK 5.0. It is a dynamically-linked library that interfaces to the VM using the Java Virtual Machine Tools Interface (JVM TI). It writes out profiling information either to a file or to a socket in ASCII or binary format. This information can be further processed by a profiler front-end tool. HPROF is capable of presenting CPU usage, heap allocation statistics and monitor contention profiles. In addition it can also report complete heap dumps and states of all the monitors and threads in the Java virtual machine. In terms of diagnosing problems, HPROF is useful when analyzing performance, lock contention, memory leaks, and other issues. In addition to the HPROF library the JDK also includes the source to HPROF as a JVM TI demonstration code. It can be found in the $JAVA_HOME/demo/jvmti/hprof directory (where $JAVA_HOME indicates the directory where the JDK is installed). HPROF is invoked as follows : java -agentlib:hprof
Depending on the type of profiling requested, HPROF instructs the virtual machine to send it the relevant events and processes the event data into profiling information. For example, the following command obtains the heap allocation profile: java -agentlib:hprof=heap=sites ToBeProfiledClass
The complete list of options is printed if the HPROF agent is provided with the help option: $ java -agentlib:hprof=help HPROF: Heap and CPU Profiling Agent (JVMTI Demonstration Code) hprof usage: java -agentlib:hprof=[help]|[=, ...] Option Name and Value Description Default --------------------- ----------------heap=dump|sites|all heap profiling all cpu=samples|times|old CPU usage off monitor=y|n monitor contention n format=a|b text(txt) or binary output a file= write data to file java.hprof[.txt] net=: send data over a socket off depth= stack trace depth 4 interval= sample interval in ms 10 cutoff= output cutoff point 0.0001 lineno=y|n line number in traces? y thread=y|n thread in traces? n doe=y|n dump on exit? y msa=y|n Solaris micro state accounting n force=y|n force output to y verbose=y|n print messages about dumps y Obsolete Options ---------------gc_okay=y|n Examples
31
-------- Get sample cpu information every 20 millisec, with a stack depth of 3: java -agentlib:hprof=cpu=samples,interval=20,depth=3 classname - Get heap usage information based on the allocation sites: java -agentlib:hprof=heap=sites classname Notes ----- The option format=b cannot be used with monitor=y. - The option format=b cannot be used with cpu=old|times. - Use of the -Xrunhprof interface can still be used, e.g. java -Xrunhprof:[help]|[=, ...] will behave exactly the same as: java -agentlib:hprof=[help]|[=, ...] Warnings -------- This is demonstration code for the JVMTI interface and use of BCI, it is not an official product or formal part of the J2SE. - The -Xrunhprof interface will be removed in a future release. - The option format=b is considered experimental, this format may change in a future release.
By default, heap profiling information (sites and dump) is written out to java.hprof.txt (ASCII) in the current working directory. The output is normally generated when the VM exits, although this can be disabled by setting the “dump on exit” option to “n” (doe=n). In addition, a profile is generated when Ctrl-\ or Ctrl-Break (depending on platform) is pressed. On Solaris and Linux a profile is also generated when a QUIT signal is received (kill -QUIT ). If Ctrl-\ or Ctrl-Break is pressed multiple times then multiple profiles are generated to the one file. The output in most cases will contain ID's for traces, threads, and objects. Each type of ID will typically start with a different number than do the other ID's. For example, traces might start with 300000.
Heap Allocation Profiles (heap=sites) Following is the heap allocation profile generated by running the Java compiler (javac) on a set of input files. Only parts of the profiler output are shown here. $ javac -J-agentlib:hprof=heap=sites Hello.java SITES BEGIN (ordered by live bytes) Fri Feb 6 13:13:42 2004 percent live alloc'ed stack class rank self accum bytes objs bytes objs trace name 1 44.13% 44.13% 1117360 13967 1117360 13967 301926 java.util.zip.ZipEntry 2 8.83% 52.95% 223472 13967 223472 13967 301927 com.sun.tools.javac.util.List 3 5.18% 58.13% 131088 1 131088 1 300996 byte[] 4 5.18% 63.31% 131088 1 131088 1 300995 com.sun.tools.javac.util.Name[]
32
A crucial piece of information in the heap profile is the amount of allocation that occurs in various parts of the program. The SITES record above tells us that 44.13% of the total space was allocated for java.util.zip.ZipEntry objects. A good way to relate allocation sites to the source code is to record the dynamic stack traces that led to the heap allocation. Following is another part of the profiler output that illustrates the stack traces referred to by the four allocation sites in output shown above. TRACE 301926: java.util.zip.ZipEntry.(ZipEntry.java:101) java.util.zip.ZipFile+3.nextElement(ZipFile.java:417) com.sun.tools.javac.jvm.ClassReader.openArchive(ClassReader.java:1374) com.sun.tools.javac.jvm.ClassReader.list(ClassReader.java:1631) TRACE 301927: com.sun.tools.javac.util.List.(List.java:42) com.sun.tools.javac.util.List.(List.java:50) com.sun.tools.javac.util.ListBuffer.append(ListBuffer.java:94) com.sun.tools.javac.jvm.ClassReader.openArchive(ClassReader.java:1374) TRACE 300996: com.sun.tools.javac.util.Name$Table.(Name.java:379) com.sun.tools.javac.util.Name$Table.(Name.java:481) com.sun.tools.javac.util.Name$Table.make(Name.java:332) com.sun.tools.javac.util.Name$Table.instance(Name.java:349) TRACE 300995: com.sun.tools.javac.util.Name$Table.(Name.java:378) com.sun.tools.javac.util.Name$Table.(Name.java:481) com.sun.tools.javac.util.Name$Table.make(Name.java:332) com.sun.tools.javac.util.Name$Table.instance(Name.java:349)
Each frame in the stack trace contains class name, method name, source file name, and the line number. The user can set the maximum number of frames collected by the HPROF agent. The default limit is 4. Stack traces reveal not only which methods performed heap allocation, but also which methods were ultimately responsible for making calls that resulted in memory allocation.
Heap Dump (heap=dump) A heap dump is obtained using the heap=dump option. The heap dump is either ASCII or binary format depending on the setting of the format option. Tools such as HAT (see section 1.11) use the binary format and therefore the format=b option is required. A complete dump is obtained with the command: javac -J-agentlib:hprof=heap=dump Hello.java
The output is a large file. It consists of the root set as determined by the garbage collector, and an entry for each java object in the heap that can be reached from the root set. The following is a selection of records from a sample heap dump:
HEAP ROOT ROOT ROOT
DUMP BEGIN (39793 objects, 2628264 bytes) Fri Sep 24 13:54:03 2004 50000114 (kind=, id=200002, trace=300000) 50000006 (kind=, id=8, trace=300000) 50008c6f (kind=, thread=200000, frame=5)
33
: CLS 50000006 (name=java.lang.annotation.Annotation, trace=300000) loader 90000001 OBJ 50000114 (sz=96, trace=300001, class=java.lang.Thread@50000106) name 50000116 group 50008c6c contextClassLoader 50008c53 inheritedAccessControlContext 50008c79 blockerLock 50000115 OBJ 50008c6c (sz=48, trace=300000, class=java.lang.ThreadGroup@50000068) name 50008c7d threads 50008c7c groups 50008c7b ARR 50008c6f (sz=16, trace=300000, nelems=1, elem type=java.lang.String[]@5000008e) [0] 500007a5 CLS 5000008e (name=java.lang.String[], trace=300000) super 50000012 loader 90000001 : HEAP DUMP END
Each record is a ROOT, OBJ, CLS, or ARR to represent a root, an object instance, a class, or an array. The hexidecimal numbers are identifiers assigned by HPROF. They are used to show the references from an object to another object. For example, in the above sample, the java.lang.Thread instance 50000114 has a reference to its thread group (50008c6c) and other objects. In general, as the output is very large, it is necessary to use a tool to visualize or process the output of a heap dump. The Heap Analysis Tool (HAT) is one such tool (see section 1.11).
CPU Usage Sampling Profiles (cpu=samples) HPROF can collect CPU usage information by sampling threads. Following is part of the output collected from a run of the javac compiler. $ javac -J-agentlib:hprof=cpu=samples Hello.java CPU SAMPLES BEGIN (total = 462) Fri Feb 6 13:33:07 2004 rank self accum count trace method 1 49.57% 49.57% 229 300187 java.util.zip.ZipFile.getNextEntry 2 6.93% 56.49% 32 300190 java.util.zip.ZipEntry.initFields 3 4.76% 61.26% 22 300122 java.lang.ClassLoader.defineClass2 4 2.81% 64.07% 13 300188 java.util.zip.ZipFile.freeEntry 5 1.95% 66.02% 9 300129 java.util.Vector.addElement 6 1.73% 67.75% 8 300124 java.util.zip.ZipFile.getEntry 7 1.52% 69.26% 7 300125 java.lang.ClassLoader.findBootstrapClass 8 0.87% 70.13% 4 300172 com.sun.tools.javac.main.JavaCompiler. 9 0.65% 70.78% 3 300030 java.util.zip.ZipFile.open 10 0.65% 71.43% 3 300175 com.sun.tools.javac.main.JavaCompiler. ... CPU SAMPLES END
The HPROF agent periodically samples the stack of all running threads to record the most frequently 34
active stack traces. The count field above indicates how many times a particular stack trace was found to be active. These stack traces correspond to the CPU usage hot spots in the application.
CPU Usage Times Profile (cpu=times) HPROF can collect CPU usage information by injecting code into every method entry and exit, keeping track of exact method call counts and the time spent in each method. This uses Byte Code Injection (BCI) and runs considerably slower than cpu=samples. Following is part of the output collected from a run of the javac compiler. $ javac -J-agentlib:hprof=cpu=times Hello.java CPU TIME (ms) BEGIN (total = 2082665289) Fri Feb 6 13:43:42 2004 rank self accum count trace method 1 3.70% 3.70% 1 311243 com.sun.tools.javac.Main.compile 2 3.64% 7.34% 1 311242 com.sun.tools.javac.main.Main.compile 3 3.64% 10.97% 1 311241 com.sun.tools.javac.main.Main.compile 4 3.11% 14.08% 1 311173 com.sun.tools.javac.main.JavaCompiler.compile 5 2.54% 16.62% 8 306183 com.sun.tools.javac.jvm.ClassReader.listAll 6 2.53% 19.15% 36 306182 com.sun.tools.javac.jvm.ClassReader.list 7 2.03% 21.18% 1 307195 com.sun.tools.javac.comp.Enter.main 8 2.03% 23.21% 1 307194 com.sun.tools.javac.comp.Enter.complete 9 1.68% 24.90% 1 306392 com.sun.tools.javac.comp.Enter.classEnter 10 1.68% 26.58% 1 306388 com.sun.tools.javac.comp.Enter.classEnter ... CPU TIME (ms) END
Here the count represents the true count of the times this method was entered, and the percentages represent a measure of thread CPU time spent in those methods.
35
1.9 HeapDumpOnOutOfMemoryError Option The -XX:+HeapDumpOnOutOfMemoryError command-line option was introduced in Java SE release 5.0 update 7. This option tells the HotSpot VM to generate a heap dump when the first thread throws a java.lang.OutOfMemoryError because the Java heap or the permanent generation is full. There is no overhead in running with this option, and so it can be useful for production systems where OutOfMemoryError takes a long time to surface. The heap dump is in HPROF binary format, and so it can be anaylzed by any tool that can import this format, for example the Heap Analysis Tool (HAT). By default the heap dump is created in a file called java_pid.hprof in the working directory of the VM, where is the process ID. You can specify an alternative file name or directory with the -XX:HeapDumpPath= option. For example, -XX:HeapDumpPath=/disk2/dumps will cause the heap dump to be generated in the /disk2/dumps directory.
1.10 HeapDumpOnCtrlBreak Option The -XX:+HeapDumpOnCtrlBreak command-line option was introduced in Java SE release 5.0 update 14. This option tells the HotSpot VM to generate a heap dump when a Ctrl-Break or SIGQUIT signal is received. This provides a way to trigger a heap dump on demand. The heap dump is in HPROF binary format, and so it can be anaylzed by any tool that can import this format, for example the Heap Analysis Tool (HAT). The heap dump contains only live objects. By default the heap dump is created in a file called java_pid.hprof.. in the working directory of the VM, where is the process ID, and . is the approximate time when the heap dump was generated. You can specify an alternative file name or directory with the -XX:HeapDumpPath= option. For example, -XX:HeapDumpPath=/disk2/dumps will cause the heap dump to be generated in the /disk2/dumps directory. If both the -XX:+HeapDumpOnCtrlBreak and -XX:+PrintClassHistogram options are enabled, the heap dump and the heap histogram are obtained from the same heap snapshot.
36
1.11 Heap Analysis Tool The Heap Analysis Tool (HAT) is a tool to help debug unintentional object retention. This term is used to describe an object that is no longer needed but it kept alive due to references through some path from the rootset. This can happen, for example, if an unintentional static reference to an object remains after the object is no longer needed, if an Observer or Listener fails to de-register itself from its subject when it is no longer needed, or if a Thread that refers to an object does not terminate when it should. Unintentional object retention is the Java Language equivalent of a memory leak. HAT provides a convenient means to browse the object topology in a heap snapshot. The tool allows a number of queries, including "show me all reference paths from the rootset to this object". It is this query that is most useful for finding unnecessary object retention. HAT is not included in JDK5.0 but it can be downloaded (in both source and binary form) from the site: http://hat.dev.java.net Note: The Java Heap Analysis Tool (jhat) provides the same functionality as HAT, with several additional enhancements and improvements. See section 1.12. The input to HAT (or jhat) must be a binary format heap dump. There are various ways to obtain this dump: •
The application can be run with the HPROF profile (see section 1.8).
•
As of Java SE 5.0 update 7, the -XX:+HeapDumpOnOutOfMemoryError command-line option tells the HotSpot VM to generate a heap dump when an OutOfMemoryError occurs (see section 1.9).
•
As of Java SE 5.0 update 14, the -XX:+HeapDumpOnCtrlBreak command-line option tells the HotSpot VM to generate a heap dump when a Ctrl-Break or SIGQUIT signal is received (see section 1.10).
HAT processes the heap dump and starts an HTTP server on a specified TCP port. You can then use any browser to connect to HAT and execute queries. The README in the download explains how to use HAT and describes each of the queries available. Following is an overview of the available queries. Section 2.1.2.2 provides further description on using HAT to identify memory leaks.
All Classes Query The default page is the “All Classes” query. It shows you all of classes present in the heap, excluding platform classes. This list is sorted by fully-qualified class name, and broken out by package. By clicking on the name of a class, you are taken to the Class query. At the bottom of the page is a link you can click to be taken to other queries. The second variant of this query includes the platform classes. Platform classes include classes whose fully-qualified names start with things like "java.", "sun.", "javax.swing.", or "char[". The list of prefixes is in a system resource file called resources/platform_names.txt. If you want to override this list, just replace it in the jar file, or arrange for your replacement to occur first on the classpath when HAT is invoked.
37
The Class Query The Class query shows you information about a class. This includes its superclass, any subclasses, instance data members, and static data members. From this page you can navigate to any of the classes that are referenced, or you can navigate to an Instances query.
The Object Query The Object query gives information about an object that was on the heap. From here, you can navigate to the class of the object and to the value of any object members of the object. You can also navigate to objects that refer to the current object. Perhaps the most valuable query is at the end: the Roots query ("Reference Chains from Rootset"). Note that the object query also gives you a stack backtrace of the point of allocation of the object.
The Instances Query The instances query shows you all instances of a given class. The "allInstances" variant includes instances of subclasses of the given class as well. From here, you can navigate back to the source class, or you can navigate to an Object query on one of the instances.
The Roots Query The roots query gives you reference chains from the rootset to a given object. It will give you one chain for each member of the rootset from which the given object is reachable. When calculating these chains, it does a depth-first search, so that it will provide reference chains of minimal length. There are two kinds of roots query: one that excludes weak references ("roots"), and one that includes them ("allRoots"). A weak reference object does not prevent its referent from being made finalizable, finalized, and then reclaimed. If an object is only referred to by a weak reference, it usually isn't considered to be retained, because the garbage collector can collect it as soon as it needs the space. This is probably the most valuable query in HAT, if you're debugging unintentional object retention. Once you find an object that is being retained, this query tells you why it is being retained.
The Reachable Objects Query This query, accessible from the Object query, shows the transitive closure of all objects reachable from a given object. This list is sorted in decreasing size, and alphabetically within each size. At the end, the total size of all of the reachable objects is given. This can be useful for determining the total runtime footprint of an object in memory, at least in systems with simple object topologies. This query is most valuable when used in conjunction with the -exclude command line option, described above. This is useful, for example, if the object being analyzed is an Observable. By default, all of its Observers would be reachable, which would count against the total size. -exclude allows you to exclude the data members java.util.Observable.obs and java.util.Observable.arr. 38
The Instance Counts for All Classes Query This query shows the count of instances for every class in the system, excluding platform classes. It is sorted in descending order, by instance count. A good way to spot a problem with unintentional object retention is to run a program for a long time with a variety of input, then request a heap dump. Looking at the instance counts for all classes, you may recognize a number of classes because there are more instances than you expect. Then, you can analyze them to determine why they're being retained (possibly using the roots query). There's also a variant of this that includes platform classes. See the notes under the All Classes query for notes about what is considered to be a platform class.
The All Roots Query This query shows all members of the rootset.
The New Instances Query The New Instances query is only available if you invoke the hat server with two heap dumps. It is like the Instances query, but it only shows new instances. An instance is considered new if it is in the second heap dump, and there is no object of the same type with the same ID in the baseline heap dump. An object's ID is a 32 or 64 bit integer3 that uniquely identifies the object, and it is assigned by the HPROF profile.
1.12 Java Heap Analysis Tool (jhat) The Java Heap Analysis Tool (jhat) provides the same functionality as HAT, but uses fewer resources. In addition, jhat offers several enhancements and improvements, including the following: •
jhat can parse incomplete and truncated heap dumps.
•
jhat can read heap dumps generated on 64-bit systems.
•
jhat supports the Object Query Language (OQL), with which you can write your own queries
on the heap dump. The jhat utility is delivered with Java SE 6 but can read and parse heap dumps created on Java SE 5.0 systems. If you have access to a machine with Java SE 6 installed, you can create a heap dump on the Java SE 5.0 system and transport it to the Java SE 6 system in order to parse and browse it with the jhat utility. For detailed information on jhat, see the Troubleshooting Guide for Java SE 6 with HotSpot VM: PDF: http://java.sun.com/javase/6/webnotes/trouble/TSG-VM/TSG-VM.pdf HTML: http://java.sun.com/javase/6/webnotes/trouble/TSG-VM/html/index.html
3 HAT 1.1 only supports 32-bit Object IDs. This is not an issue on 64-bit VMs because HPROF always generates a 32-bit Object ID.
39
1.13 Fatal Error Handling J2SE 5.0 has significantly enhanced fatal error reporting when compared to previous releases. When a fatal error occurs, an error log is created with information and state obtained at the time of the fatal error. In addition, a user-supplied script, or a set of commands, can be configured to execute when a fatal error occurs. This is specified using the -XX:OnError option.This section also describes the -XX:+ShowMessageBoxOnError option. This option is useful in cases where you want to attach a native debugger to the process when it crashes.
1.13.1 Fatal Error Log When a fatal error occurs an error log is created in the file hs_err_pid.log (where is the process id of the process). Where possible the file is created in the working directory of the process. In the event that the file cannot be created in the working directory (insufficient space, permission problem, or other issue) then the file is created in the temporary directory for the operating system. On Solaris and Linux the temporary directory is /tmp. On Windows the temporary directory is specified by the value of the TMP environment variable, or if that is not defined, the value of the TEMP environment variable. The error log contains a lot of information obtained at the time of the fatal error. Where possible it includes: • • • • • • • • •
the operating exception or signal that provoked the fatal error version and configuration information details on the thread that provoked the fatal error and its stack trace the list of running threads and their state summary information about the heap the list of native libraries loaded command line arguments environment variables details about the operating system and cpu
It is important to note that in some cases only a sub-set of this information is output to the error log. This can happen when a fatal error is of such severity that the error handler is unable to recover and report all details. The format of the fatal error log is detailed in section 2.2.1 (starting at page 79).
1.13.2 OnError Option When a fatal error occurs the HotSpot Virtual Machine can optionally execute a user-supplied script or command. The script or command is specified using the -XX:OnError: command line option, where is a single command, or a list of commands separated by a semi-colon. Within all occurrences of “%p” are replaced with the current process id (pid), and all occurrences of “%%” are replaced by a single “%”. Following are some examples to demonstrate how the option can be used. 40
On Solaris the pmap command displays information about the address space of a process. In this example, the pmap command is executed to display the address space of the process after a fatal error occurs: java -XX:OnError=”pmap %p” MyApplication
Here's an example showing how the fatal error report can be mailed to a support alias when a fatal error is encountered: java -XX:OnError=”cat hs_err_pid%p.log|mail
[email protected]” MyApplication
\
On Solaris the gcore command creates a core image of the specified process. The dbx command launches the debugger. In this example, the gcore command is executed to create the core image and the debugger is started to attach to the process: java -XX:OnError=”gcore %p;dbx - %p” MyApplication
Following is a Linux example which launches the gdb debugger when an unexpected error is encountered. Once launched, gdb will attach to the VM process : java -XX:OnError=”gdb - %p” MyApplication
On Windows the Dr. Watson debugger can be configured as the post-mortem debugger so that a crash dump is created when an unexpected error is encountered. See section 3.2.4 for other details. An alternative approach to obtain a crash dump on Windows it to use the -XX:OnError option to execute the userdump.exe utility4 : java -XX:OnError=”userdump.exe %p” MyApplication
The example assumes that userdump.exe is on the PATH.
1.13.3 ShowMessageBoxOnError Option In addition to the -XX:OnError option the HotSpot VM can also be provided with the option -XX :+ShowMessageBoxOnError. When this option is set and a fatal error is encountered, the HotSpot VM will output information about the fatal error and prompt the user as to whether the native debugger should be launched. In the case of Solaris and Linux, the output and prompt are sent to the application console (standard input and standard output). In the case of Windows, a Windows message box pops up. Here is an example from a fatal error encountered on a Linux system : 4 The userdump utility is part of the Microsoft OEM Support Tools package which can be downloaded from the Microsoft site. See section 3.2.4 for further details.
41
============================================================================== Unexpected Error -----------------------------------------------------------------------------SIGSEGV (0xb) at pc=0x2000000001164db1, pid=10791, tid=1026 Do you want to debug the problem? To debug, run 'gdb /proc/10791/exe 10791'; then switch to thread 1026 Enter 'yes' to launch gdb automatically (PATH must include gdb) Otherwise, press RETURN to abort... ==============================================================================
In this case a SIGSEGV has occurred and the user is prompted as to whether the gdb debugger should be launched to attach to the process. If the user enters “y” or “yes” then gdb will be launched (assuming it is on the PATH). On Solaris the message is similar to the above except that the user is promoted to start the Solaris dbx debugger. On Windows a message box is displayed. If the user presses the YES button then the VM will attempt to start the default debugger5. If Microsoft Visual Studio is installed then the default debugger is typically configured to be msdev.exe. In the above example note that the output includes the process id (10791 in this case) and also the thread id (1026 in this case). If the debugger is launched then one of the initial steps in the debugger may be to select the thread and obtain its stack trace. As the process is waiting for a response it is possible to use other tools to obtain a crash dump or query the state of the process. On Solaris, for example, a core dump can be obtained using the gcore utility. On Windows a Dr. Watson crash dump can be obtained using the userdump or windbg programs6. In windbg select the “Attach to a Process...” menu option. This displays the list of processes and prompts for the process id. The message box displayed by the HotSpot VM includes the process id. Once selected the “.dump /f”command can be used to force a crash dump. In the following example a crash dump is created in file crash.dump.
5 Configured by a registry setting – see section 3.2.4 for further details. 6 The windbg program is included in Microsoft's Debugging Tools for Windows.- see section 3.2.4 for further information on windbg and the link to the download location.
42
In general the -XX:+ShowMessageBoxOnError option is more useful in a development environment where debugger tools are available. The -XX:OnError option is more suitable for production environments where a fixed sequence of commands or scripts are executed when a fatal error is encountered.
43
1.14 dbx A debugger is often very useful when trying to diagnose an issue. The dbx debugger that ships with Sun Java Studio 9 can be used to debug java language code on Solaris in addition to native (C/C++) code. Following is a simple debug session to demonstrate how to start an application with dbx: $ dbx Test.class For information about new features see `help changes' To remove this message, put `dbxenv suppress_startup_message 7.1' in your .dbxrc Debug target is "Test.class" Will be debugging "Test" Reading detected a multithreaded program (dbx) stop in Test.main (2) java stop in Test.main(java.lang.String[]) (dbx) run stopped in Test.main at line 4 in file "Test.java" 4 System.out.println( “Hello” ); (dbx) dump java.lang.String[] args = {} (dbx) cont
Here is a second example, where dbx is attached to a process: $ export LD_LIBRARY_PATH=/SUNWspro/lib $ java -Xdebug -Xrundbx_agent Hello.class& [1]
1234
$ dbx – 1234
In this example is the location where dbx is installed. The process id (pid) is 1234. Here is another example where a jar file is provided to dbx. The jar file contains the Main-Class attribute in its manifest to specify the main class. $ dbx Foo.jar
In cases where the jar file doesn't contain a Main-Class attribute, you can tell dbx the class to exeucte in the jar file. In this example the class is Main. $ dbx Bar.jar!Main.class
Once running under dbx many of the traditional dbx commands perform the same operation that they do with native code. Examples of commands that are essentially the same are “cont”, “down”, “list”, “next”, and “step up”. Others, such as “print” and “step” have different syntax. 44
Two java specific commands that are important to note are jon and joff. They are used to switch between java and native modes. When debugging a Java application, dbx is in one of three modes, namely, Java mode, JNI mode, or native mode. When dbx is in Java mode or JNI mode, you can inspect the state of your Java application, including JNI code, and control execution of the code. When dbx is in native mode, you can inspect the state of your C or C++ JNI code. The current mode (java, jni, native) is stored in the environment variable jdbx_mode. In Java mode, you interact with dbx using Java syntax and dbx uses Java syntax to present information to you. This mode is used for debugging pure Java code, or the Java code in an application that is a mixture of Java code and C JNI code or C++ JNI code. In JNI mode, dbx commands use native syntax and affect native code, but the output of commands shows Java-related status as well as native status, so JNI mode is a "mixed" mode. This mode is used for debugging the native parts of an application that contain a mixture of Java code and C JNI code or C++ JNI code. In native mode, dbx commands affect only a native program, and all Java-related features are disabled. This mode is used for debugging non-Java related programs. As you execute your Java application, dbx switches automatically between Java mode and JNI mode as appropriate. For example, when it encounters a Java breakpoint, dbx switches into Java mode, and when you step from Java code into JNI code, it switches into JNI mode. The jon command is particularly useful if you interrupt the execution of an application (using Ctrl-C for example). When an application is interrupted dbx tries to set the mode automatically to Java/JNI mode by bringing the application to a safe state and suspending all threads. If dbx cannot suspend the application and switch to Java/JNI mode, dbx switches to native mode. You can then use the jon command to switch to Java mode in order to inspect the state of the program. Debugging a java application with dbx is fully described in chapter 17 of the “Debugging a Program with dbx” manual in the Sun Studio 9 product. This chapter can be found here: http://docs.sun.com/source/817-6692/Java_debug.html
45
1.15 Using jdb to Attach to a Core File or Hung Process The Java Debug Interface (JDI) is a high level Java API providing information useful for debuggers and similar systems needing access to the running state of a (usually remote) virtual machine. JDI is a component of the Java Platform Debugger Architecture (JPDA). In JDI a Connector is the means by which the debugger connects to the target virtual machine. The JDK has traditionally shipped with Connectors that launch and establish a debugging session with a target VM and also Connectors that are used for remote debugging (using TCP/IP or shared memory transports). JDK5.0 ships with three new Connectors on Solaris and Linux. These Connectors allow a Java Language debugger (such as the sample jdb command-line debugger) to attach to a crash dump or hung process. This can be useful when trying to diagnose what the application was doing at the time of the crash or hang. The three Connectors are: Connector
Description
SA Core Attaching Connector
This Connector can be used by a debugger to debug a core file.
SA PID Attaching Connector
This Connector can be used by a debugger to debug a process.
SA Debug Server Attaching Connector
This Connector can be used by a debugger to debug a process or core file on a machine other than the machine upon which the debugger is running.
Further details about JPDA can be found at: http://java.sun.com/j2se/1.5.0/docs/guide/jpda/index.html Further information about these Connectors can be found at: http://java.sun.com/j2se/1.5.0/docs/guide/jpda/conninv.html The following demonstrates usage of these Connectors with the jdb command-line debugger that ships with JDK5.0. Generally, these Connectors will be used with more capable and enterprise debuggers (such as as NetBeans IDE or commerical IDEs).
1.15.1 Attaching to a Process In this example we use the “SA PID Attaching Connector” to attach to a process. The target process is not started with any special options (-agentlib:jdwp option not required). When this Connector attaches to a process it does so in read-only mode; that is the debugger can examine threads and the running application but it cannot change anything. The command we use is as follows: jdb -connect sun.jvm.hotspot.jdi.SAPIDAttachingConnector:pid=20441
46
This command instructs jdb to use a Connector named sun.jvm.hotspot.jdi.SAPIDAttachingConnector. This is a Connector name rather than a class name. The Connector takes one argument called “pid” and its value is the process-id of the target process (20441 in this example). $ jdb -connect sun.jvm.hotspot.jdi.SAPIDAttachingConnector:pid=20441 Initializing jdb... > threads Group system: (java.lang.ref.Reference$ReferenceHandler)0x23 Reference Handler unknown (java.lang.ref.Finalizer$FinalizerThread)0x22
Finalizer unknown
(java.lang.Thread)0x21 Signal Dispatcher running (java.lang.Thread)0x24 main running [... more lines removed here to reduce output ...] Group main: (java.lang.Thread)0x1
TP-Monitor
unknown (com.ecyrd.jspwiki.PageManager$LockReaper)0x0 Thread-33 sleeping > thread 0x24 main[1] where [1] java.net.PlainSocketImpl.socketAccept (native method) [2] java.net.PlainSocketImpl.socketAccept (native method) [3] java.net.PlainSocketImpl.accept (PlainSocketImpl.java:384) [4] java.net.ServerSocket.implAccept (ServerSocket.java:450) [5] java.net.ServerSocket.accept (ServerSocket.java:421) [6] org.apache.catalina.core.StandardServer.await (StandardServer.java:552) [7] org.apache.catalina.startup.Catalina.await (Catalina.java:634) [8] org.apache.catalina.startup.Catalina.start (Catalina.java:596) [9] sun.reflect.NativeMethodAccessorImpl.invoke0 (native method) [10] sun.reflect.NativeMethodAccessorImpl.invoke (NativeMethodAccessorImpl.java:39) [11] sun.reflect.DelegatingMethodAccessorImpl.invoke (DelegatingMethodAccessorImpl.java:25) [12] java.lang.reflect.Method.invoke (Method.java:585) [13] org.apache.catalina.startup.Bootstrap.start (Bootstrap.java:295) [14] org.apache.catalina.startup.Bootstrap.main (Bootstrap.java:392) main[1] up 13 main[14] where [14] org.apache.catalina.startup.Bootstrap.main (Bootstrap.java:392)
47
main[14] locals Method arguments: args = instance of java.lang.String[1] (id=40) Local variables: command = "start"
In this example the threads command is used to get a list of all threads. Then a specific thread is selected with the thread 0x24 command, and the where command is used to get a thread dump. Next the up 13 command is used to move up 13 frames in the stack, and the where command is used again to get a thread dump. Finally the locals command is used to print the local variables for that stack frame. Note that you must compile the Java files with the -g option in order to use the locals command.
1.15.2 Attaching to a Core File The SA Core Attaching Connector is used to attach the debugger to a core file. The core file may have been created after a crash (see section 2.2), or obtained by using the gcore command on Solaris (or gdb's gcore command on Linux). As the core file is a snapshot of the process at the time the core file was created, the Connector attaches in read-only mode; that is the debugger can examine threads and the running application at the time of the crash. Following is an example of using this Connector: jdb -connect sun.jvm.hotspot.jdi.SACoreAttachingConnector:\ javaExecutable=$JAVA_HOME/bin/java,core=core.20441
This command instructs jdb to use a Connector named sun.jvm.hotspot.jdi.SACoreAttachingConnector. The Connector takes two arguments called javaExecutable and core. The javaExecutable argument indicates the name of the java binary. In this case the JAVA_HOME environment variable indicates the JDK home directory. The core argument is the core file name (the core from process with pid 20441 in this example). To debug a core file that has been transported from another machine requires that the OS versions and libraries match. Sometimes this can be difficult to organize. For those environments you can run a proxy server called the SA Debug Server. Then, on the machine where the debugger is installed, you can use the SA Debug Server Attaching Connector to connect to the debug server. To demonstrate this, assume that we have machine 1 and machine 2. A core file is available on machine 1 and the debugger is available on machine 2. On machine 1 we start the SA Debug Server: jsadebugd $JAVA_HOME/bin/java core.20441
jsadebugd takes two arguments here. The first is the name of the binary/executable. In most cases this is java but it may be another name (in the case of embedded VMs for example). The second argument is the name of the core file. In this example the core file was obtained for a process with pid 20441 48
using the gcore utility. On machine 2, we use the debugger to connect to the remote SA Debug Server using the SA Debug Server Attaching Connector. Following is an example command: jdb -connect sun.jvm.hotspot.jdi.SADebugServerAttachingConnector:\ debugServerName=machine1
This command instructs jdb to use a Connector named sun.jvm.hotspot.jdi.SADebugServerAttachingConnector. The Connector has a single argument debugServerName which is the hostname or IP address of the machine where the SA Debug Server is running. Note that the SA Debug Server can also be used to remotely debug a hung process. In that case it takes a single argument which is the process-id of the process. Also, if it is required to run multiple debug servers on the same machine then each one must be provided with a unique ID. When using the SA Debug Server Attaching Connector this ID is provided as an additional Connector argument. These details are described in the JPDA documentation.
49
1.16 Ctrl-Break Handler On Solaris or Linux the HotSpot VM will print a thread dump to the application's standard output if the Ctrl and \ keys are pressed. The thread dump consists of the thread stack for all Java threads in the VM. On Windows the equivalent key sequence is the Ctrl and Break keys. The thread dump doesn't terminate the application – it continues after the thread information is printed. On Solaris and Linux a thread dump is also printed if the J2SE process receives a QUIT signal. So kill -QUIT causes the process with id to print a thread dump to its standard output. In addition to the thread stacks, the ctrl-break handler also executes a deadlock detection algorithm. If any deadlocks are detected then it prints out additional information on each deadlocked thread. Following is an example thread dump: Full thread dump Java HotSpot(TM) Client VM (1.5.0-rc-b63 mixed mode):
"AWT-EventQueue-0" prio=10 tid=0x00262048 nid=0xe waiting for monitor entry [0xf0400000..0xf0401838] at java.awt.Container.removeNotify(Container.java:2503) - waiting to lock (a java.awt.Component$AWTTreeLock) at java.awt.Window$1DisposeAction.run(Window.java:604) at java.awt.Window.doDispose(Window.java:617) at java.awt.Dialog.doDispose(Dialog.java:625) at java.awt.Window.dispose(Window.java:574) at java.awt.Window.disposeImpl(Window.java:584) at java.awt.Window$1DisposeAction.run(Window.java:598) - locked (a java.util.Vector) at java.awt.Window.doDispose(Window.java:617) at java.awt.Window.dispose(Window.java:574) at javax.swing.SwingUtilities$SharedOwnerFrame.dispose(SwingUtilities.java:1743) at javax.swing.SwingUtilities$SharedOwnerFrame.windowClosed(SwingUtilities.java:172 2) at java.awt.Window.processWindowEvent(Window.java:1173) at javax.swing.JDialog.processWindowEvent(JDialog.java:407) at java.awt.Window.processEvent(Window.java:1128) at java.awt.Component.dispatchEventImpl(Component.java:3922) at java.awt.Container.dispatchEventImpl(Container.java:2009) at java.awt.Window.dispatchEventImpl(Window.java:1746) at java.awt.Component.dispatchEvent(Component.java:3770) at java.awt.EventQueue.dispatchEvent(EventQueue.java:463) at java.awt.EventDispatchThread.pumpOneEventForHierarchy(EventDispatchThread.java:2 14) at java.awt.EventDispatchThread.pumpEventsForHierarchy(EventDispatchThread.java:163 ) at java.awt.EventDispatchThread.pumpEvents(EventDispatchThread.java:157) at java.awt.EventDispatchThread.pumpEvents(EventDispatchThread.java:149) at java.awt.EventDispatchThread.run(EventDispatchThread.java:110) "AWT-Motif" daemon prio=10 tid=0x0023fc20 nid=0xd runnable [0xf0501000..0xf05016b8] at sun.awt.motif.MToolkit.run(Native Method) at java.lang.Thread.run(Thread.java:549)
50
"AWT-Shutdown" prio=10 tid=0x0023f840 nid=0xc in Object.wait() [0xf0601000..0xf0601738] at java.lang.Object.wait(Native Method) - waiting on (a java.lang.Object) at java.lang.Object.wait(Object.java:429) at sun.awt.AWTAutoShutdown.run(AWTAutoShutdown.java:259) - locked (a java.lang.Object) at java.lang.Thread.run(Thread.java:549) "Java2D Disposer" daemon prio=10 tid=0x002007d8 nid=0xb in Object.wait() [0xf0701000..0xf07019b8] at java.lang.Object.wait(Native Method) - waiting on (a java.lang.ref.ReferenceQueue$Lock) at java.lang.ref.ReferenceQueue.remove(ReferenceQueue.java:116) - locked (a java.lang.ref.ReferenceQueue$Lock) at java.lang.ref.ReferenceQueue.remove(ReferenceQueue.java:132) at sun.java2d.Disposer.run(Disposer.java:107) at java.lang.Thread.run(Thread.java:549) "Low Memory Detector" daemon prio=10 tid=0x0012bf28 nid=0x9 runnable [0x00000000..0x00000000] "CompilerThread0" daemon prio=10 tid=0x0012a5a8 nid=0x8 waiting on condition [0x00000000..0xfba800a0] "Signal Dispatcher" daemon prio=10 tid=0x00129818 nid=0x7 waiting on condition [0x00000000..0x00000000] "Finalizer" daemon prio=10 tid=0x000feea8 nid=0x6 in Object.wait() [0xfdd81000..0xfdd816b8] at java.lang.Object.wait(Native Method) - waiting on (a java.lang.ref.ReferenceQueue$Lock) at java.lang.ref.ReferenceQueue.remove(ReferenceQueue.java:116) - locked (a java.lang.ref.ReferenceQueue$Lock) at java.lang.ref.ReferenceQueue.remove(ReferenceQueue.java:132) at java.lang.ref.Finalizer$FinalizerThread.run(Finalizer.java:159) "Reference Handler" daemon prio=10 tid=0x000fdc80 nid=0x5 in Object.wait() [0xfde81000..0xfde81838] at java.lang.Object.wait(Native Method) - waiting on (a java.lang.ref.Reference$Lock) at java.lang.Object.wait(Object.java:429) at java.lang.ref.Reference$ReferenceHandler.run(Reference.java:118) - locked (a java.lang.ref.Reference$Lock) "main" prio=10 tid=0x0002daa8 nid=0x1 waiting for monitor entry [0xffbee000..0xffbeecd0] at java.awt.Window.getOwnedWindows(Window.java:844) - waiting to lock (a java.util.Vector) at javax.swing.SwingUtilities$SharedOwnerFrame.installListeners(SwingUtilities.java :1697) at javax.swing.SwingUtilities$SharedOwnerFrame.addNotify(SwingUtilities.java:1690) at java.awt.Dialog.addNotify(Dialog.java:370) - locked (a java.awt.Component$AWTTreeLock) at java.awt.Dialog.conditionalShow(Dialog.java:441) - locked (a java.awt.Component$AWTTreeLock)
51
at at at at
java.awt.Dialog.show(Dialog.java:499) java.awt.Component.show(Component.java:1287) java.awt.Component.setVisible(Component.java:1242) test01.main(test01.java:10)
"VM Thread" prio=10 tid=0x000fbd60 nid=0x4 runnable "VM Periodic Task Thread" prio=10 tid=0x0012cb68 nid=0xa waiting on condition
The output consists of the header and stack trace for each thread. Each thread is separated by an empty line. The Java threads (threads that are capable of executing Java Language code) are printed first, and these are followed by information on VM internal threads. For each Java thread there is a header line with information about the thread, and this is followed by the thread stack. The header line prints the thread name, indicates if the thread is a daemon thread, and also prints the java thread priority : "Java2D Disposer" daemon prio=10 tid=0x002007d8 nid=0xb in Object.wait() [0xf0701000..0xf07019b8] at java.lang.Object.wait(Native Method) - waiting on (a java.lang.ref.ReferenceQueue$Lock) at java.lang.ref.ReferenceQueue.remove(ReferenceQueue.java:116) - locked (a java.lang.ref.ReferenceQueue$Lock) at java.lang.ref.ReferenceQueue.remove(ReferenceQueue.java:132) at sun.java2d.Disposer.run(Disposer.java:107) at java.lang.Thread.run(Thread.java:549)
In the header the tid is the thread id that is the address of a thread structure in memory. The nid is the id of the native thread and this is followed by the thread state. The thread state indicates what the thread is doing at the time of the thread dump. Following are the possible states that can be printed : allocated initialized runnable waiting for monitor entry waiting on condition in Object.wait() sleeping After the thread is an address range – this is an estimate of the valid stack region for the thread.
1.16.1 Deadlock Detection After the thread dump, the deadlock results are printed (as follows for the above example): Found one Java-level deadlock: =============================
52
"AWT-EventQueue-0": waiting to lock monitor 0x000ffbf8 (object 0xf0c30560, a java.awt.Component$AWTTreeLock), which is held by "main" "main": waiting to lock monitor 0x000ffe38 (object 0xf0c41ec8, a java.util.Vector), which is held by "AWT-EventQueue-0" Java stack information for the threads listed above: =================================================== "AWT-EventQueue-0": at java.awt.Container.removeNotify(Container.java:2503) - waiting to lock (a java.awt.Component$AWTTreeLock) at java.awt.Window$1DisposeAction.run(Window.java:604) at java.awt.Window.doDispose(Window.java:617) at java.awt.Dialog.doDispose(Dialog.java:625) at java.awt.Window.dispose(Window.java:574) at java.awt.Window.disposeImpl(Window.java:584) at java.awt.Window$1DisposeAction.run(Window.java:598) - locked (a java.util.Vector) at java.awt.Window.doDispose(Window.java:617) at java.awt.Window.dispose(Window.java:574) at javax.swing.SwingUtilities$SharedOwnerFrame.dispose(SwingUtilities.java:1743) at javax.swing.SwingUtilities$SharedOwnerFrame.windowClosed(SwingUtilities.java:172 2) at java.awt.Window.processWindowEvent(Window.java:1173) at javax.swing.JDialog.processWindowEvent(JDialog.java:407) at java.awt.Window.processEvent(Window.java:1128) at java.awt.Component.dispatchEventImpl(Component.java:3922) at java.awt.Container.dispatchEventImpl(Container.java:2009) at java.awt.Window.dispatchEventImpl(Window.java:1746) at java.awt.Component.dispatchEvent(Component.java:3770) at java.awt.EventQueue.dispatchEvent(EventQueue.java:463) at java.awt.EventDispatchThread.pumpOneEventForHierarchy(EventDispatchThread.java:2 14) at java.awt.EventDispatchThread.pumpEventsForHierarchy(EventDispatchThread.java:163 ) at java.awt.EventDispatchThread.pumpEvents(EventDispatchThread.java:157) at java.awt.EventDispatchThread.pumpEvents(EventDispatchThread.java:149) at java.awt.EventDispatchThread.run(EventDispatchThread.java:110) "main": at java.awt.Window.getOwnedWindows(Window.java:844) - waiting to lock (a java.util.Vector) at javax.swing.SwingUtilities$SharedOwnerFrame.installListeners(SwingUtilities.java :1697) at javax.swing.SwingUtilities$SharedOwnerFrame.addNotify(SwingUtilities.java:1690) at java.awt.Dialog.addNotify(Dialog.java:370) - locked (a java.awt.Component$AWTTreeLock) at java.awt.Dialog.conditionalShow(Dialog.java:441) - locked (a java.awt.Component$AWTTreeLock) at java.awt.Dialog.show(Dialog.java:499) at java.awt.Component.show(Component.java:1287) at java.awt.Component.setVisible(Component.java:1242)
53
at test01.main(test01.java:10) Found 1 deadlock.
In the example we see that thread main is locking objects and , and is waiting to enter that is currently locked by thread AWT-EventQueue-0. But, thread AWT-EventQueue-0 is waiting to enter that is locked by main. This straight-forward and classic deadlock involves 2 threads. In other cases the deadlock will be more complex and involve additional threads.
54
1.17 Other Options and System Properties This section describes a variety of options and properties that may be useful in some troubleshooting situations.
1.17.1 -verbose:gc The -verbose:gc option enables logging of GC information. It can be combined with other HotSpot VM specific options such as -XX:+PrintGCDetails and -XX:+PrintGCTimeStamps to get further information about the GC. The information output includes the size of the generations before and after each GC, total size of the heap, the size of objects promoted, and the time taken. These options, together with detailed information about GC analysis and tuning, are described at the GC portal site: http://java.sun.com/developer/technicalArticles/Programming/GCPortal Note that the -verbose:gc option can be dynamically enabled at runtime using the management API or JVM TI (See section 1.19 for further information on these APIs). The jconsole monitoring and management tool can also enable (or disable) the option when attached to a management VM (jconsole is described in section 1.5).
1.17.2 -verbose:class The -verbose:class option enables logging of class loading and unloading.
1.17.3 -Xcheck:jni option The -Xcheck:jni option is useful when trying to diagnose problems with applications that use the Java Native Interface (JNI). Sometimes there can be bugs in the native code that cause the HotSpot VM to crash or behave incorrectly. To use the -Xcheck:jni option just add it to the command line when starting the application, for example: java -Xcheck:jni MyApplication When the -Xcheck:jni option is used it tells the VM to do additional validation on the arguments passed to JNI functions. It should be noted that the option is not guaranteed to find all invalid arguments or diagnose logic bugs in the application code, but it can help diagnose a large number of such problems. When an invalid argument is detected, the VM prints a message (to the application console/standard output), prints the stack trace of the offending thread, and aborts the VM. Following is an example where a NULL is incorrectly passed to a JNI function that does not allow NULL:
55
FATAL ERROR in native method: Null object passed to JNI at java.net.PlainSocketImpl.socketAccept(Native Method) at java.net.PlainSocketImpl.accept(PlainSocketImpl.java:343) - locked (a java.net.PlainSocketImpl) at java.net.ServerSocket.implAccept(ServerSocket.java:439) at java.net.ServerSocket.accept(ServerSocket.java:410) at org.apache.tomcat.service.PoolTcpEndpoint.acceptSocket(PoolTcpEndpoint.java:286) at org.apache.tomcat.service.TcpWorkerThread.runIt(PoolTcpEndpoint.java:402) at org.apache.tomcat.util.ThreadPool$ControlRunnable.run(ThreadPool.java:498) at java.lang.Thread.run(Thread.java:536)
Following is another exmaple of output that arises when something other than a jfieldID is provided to a JNI functions that expects a jfieldID: FATAL ERROR in native method: Instance field not found in JNI get/set field operations at java.net.PlainSocketImpl.socketBind(Native Method) at java.net.PlainSocketImpl.bind(PlainSocketImpl.java:359) - locked (a java.net.PlainSocketImpl) at java.net.ServerSocket.bind(ServerSocket.java:318) at java.net.ServerSocket.(ServerSocket.java:185) at jvm003a.(jvm003.java:190) at jvm003a.(jvm003.java:151) at jvm003.run(jvm003.java:51) at jvm003.main(jvm003.java:30)
Following are other examples of problems that -Xcheck:jni can help diagnose : 1. Cases where the JNI environment for the wrong thread is used. 2. Cases where an invalid JNI reference is used. 3. Cases when a reference to a non-array type is provided to a function that requires an array type. 4. Cases where a non-static field ID is provided to a function that expects a static field ID. 5. Cases where a JNI call is made with an exception pending. In general, all errors detected by -Xcheck:jni are fatal errors. That is, the error is printed and the VM is aborted when the error is detected. One exception to this is a non-fatal warning that is printed when a JNI call is made within a JNI critical region. When this arises the following warning is printed : Warning: Calling other JNI functions in the scope of Get/ReleasePrimitiveArrayCritical or Get/ReleaseStringCritical
56
A JNI critical region arises when native code uses the JNI GetPrimitiveArrayCritical or GetStringCritical functions to obtain a reference to an array or string in the Java heap. The reference is held until the native code calls the corresponding release function. In between the get and release is called a JNI critical section and during that time the HotSpot VM cannot bring the VM to a state that allows garbage collection to occur. The general recommendation is that other JNI functions should not be used when in a JNI critical section, and in particular any JNI function that blocks could potentially cause a deadlock. The warning printed by -Xcheck:jni is thus an indication of a potential issue; it does not always indicate an application bug.
1.17.4 -verbose:jni The -verbose:jni option enables logging of JNI. Specifically, when a JNI/native method is resolved the HotSpot VM prints a trace message to the application console (standard output). It also prints a trace message when a native method is registered using the JNI RegisterNative function. The -verbose:jni option may be useful when trying to diagnose issues with applications that use native libraries.
1.17.5 JAVA_TOOL_OPTIONS Environment Variable In many environments the command line to start the application is not readily accessible. This often arises with applications that use embedded VMs (meaning they use the JNI Invocation API to start the VM), or the startup is deeply nested in scripts. In these environments the JAVA_TOOL_OPTIONS environment variable may be useful to augment a command line. This environment variable is primarily intended to support the initialization of tools, specifically the launching of native or Java programming language agents using the -agentlib or -javaagent options. The environment variable is processed at the time of the JNI Invocation API create VM call; options processed by a launcher (such as VM selection options) will not be handled. When set, the JNI_CreateJavaVM function (in the JNI Invocation API) will prepend the value of the environment variable to the options supplied in its JavaVMInitArgs argument. In some cases this option is disabled for security reasons; for example, on Solaris the option is disabled when the effective user or group ID differs from the real ID. Here is an example where we set the environment variable so that the HPROF profiler is launched when the application is started: export JAVA_TOOL_OPTIONS=”-agentlib:hprof”
Although the option is intended to support the initialization of tools, it may be useful to augment the command line with other options for diagnostics purposes. For example, it may be a useful method to augment the command line with a -XX:OnError option when you want a script or command to be executed when a fatal error occurs. As the environment variable is examined at the time that JNI_CreateJavaVM is called it cannot be used to augment the command-line with options that would normally be handled by the launcher (vm selection using the -client or -server option for example). The JAVA_TOOL_OPTIONS environment variable is fully described in the JVM TI specification at: http://java.sun.com/j2se/1.5.0/docs/guide/jvmti/jvmti.html#tooloptions 57
1.17.6 java.security.debug System Property The java.security.debug system property controls whether the security checks in the JRE of the Java prints trace messages during execution. This option can be useful when trying to diagnose an issue involving a security manager when trying to explain why a SecurityException is thrown. The value of the property is one of the following: • • • •
access jar policy scl
— print all checkPermission results — print jar verification information — print policy information — print permissions SecureClassLoader assigns
With the access option the following sub-options can be used: • • •
stack — include stack trace domain — dumps all domains in context failure — before throwing exception, dump the stack and domain that didn't have permission
For example, to print all checkPermission results and trace all domains in context, set the property to “access,stack”. To trace access failures set the property to “access,failure”. Here's an example showing the output of a checkPermission failure: $ java -Djava.security.debug=”access,failure” Application access denied (java.net.SocketPermission server.foobar.com resolve ) java.lang.Exception: Stack trace at java.lang.Thread.dumpStack(Thread.java:1158) at java.security.AccessControlContext.checkPermission(AccessControlContext.java:253) at java.security.AccessController.checkPermission(AccessController.java:427) at java.lang.SecurityManager.checkPermission(SecurityManager.java:532) at java.lang.SecurityManager.checkConnect(SecurityManager.java:1031) at java.net.InetAddress.getAllByName0(InetAddress.java:1117) at java.net.InetAddress.getAllByName0(InetAddress.java:1098) at java.net.InetAddress.getAllByName(InetAddress.java:1061) at java.net.InetAddress.getByName(InetAddress.java:958) at java.net.InetSocketAddress.(InetSocketAddress.java:124) at java.net.Socket.(Socket.java:178) at Test.main(Test.java:7)
58
1.18 Operating System Tools This section lists a number of operating system tools that can be useful for troubleshooting or monitoring purposes. A brief description is provided for each tool. For further details, refer to the operating system documentation (or man pages in the case of Solaris and Linux).
1.18.1 Solaris Operating System Tool
Description
cputrack
Per-process monitor process, LWP behavior using CPU performance counters.
cpustat
Monitor system performance/behavior using CPU performance counters.
c++filt
Demangle C++ mangled symbol names.
dbx
Solaris source debugger Note: dbx can debug java code in addition to native code (see section 1.14).
dtrace
Solaris 10: Dynamic tracing of Kernel functions, system calls and user-land functions. Allows arbitrary, safe scripting to be executed at entry/exit and other probe points. Script is written in C-like but safe pointer semantics language called D.
libumem
User space slab allocator (Solaris 9 update 3 and Solaris 10). It can be used to find and fix memory management bugs (see section 2.1.3.2).
iostat
Report I/O statistics.
netstat
Display the contents of various network-related data structures.
mdb
Modular debugger for kernel and user apps and crash dumps
pfiles
Print information on process file descriptors. Solaris 10 version prints filename as well!
pldd
Print shared objects loaded by a process.
pmap
Print memory layout of a process or core file - heap, data, text sections. Solaris 10 version clearly identifies stack segments with [stack] along with the thread id.
prun
Set the process to running mode (reverse of pstop).
prstat
Report active process statistics.
psig
List the signal handlers of a process.
pstack
Print stack of threads of a given process or core file. Solaris 10 version can print Java method names for Java frames.
pstop
Stop the process (suspend).
ps
List all processes.
ptree
Print process tree starting at given pid.
sar
System activity reporter. 59
Tool
Description
truss
Trace entry/exit event for system calls, user-land functions, signals and optionally stop the process at one of these events. Print arguments as well.
vmstat
Report system virtual memory statistics.
gcore
Utility to force a core dump of a process. The process continues after the core dump is written.
1.18.2 Linux Tool ltrace
Description Library call tracer (equivalent to truss -u) Not all distributions have this by default. May have to download separately.
mtrace / muntrace
GNU malloc tracer.
proc tools such as pmap, pstack
Not all Solaris equivalent proc tools are available – only a subset. Also core file support is not as good as for Solaris; for example pstack does not work for core dumps.
strace
System call tracer (equivalent to truss -t).
top
Display most CPU intensive processes.
vmstat
Report information about processes, memory, paging, block IO, traps, and cpu activity.
gdb
GNU debugger.
1.18.3 Microsoft Windows
Tool
Description
windbg
Windows debugger which can be used to debug Windows applications or crash dumps. Included in Debugging Tools for Windows download available from the Microsoft web site (see section 3.2.4).
dumpchk
Command-line utility you can use to verify that a memory dump file has been created correctly Included in Debugging Tools for Windows download available from the Microsoft web site (see section 3.2.4).
userdump
User Mode Process Dump utility. Included in the OEM Support Tools download available from the Microsoft web site (see section 3.2.4).
1.18.4 Solaris 10 Operating System Tools The previous section listed a number of operating system tools that can be useful for troubleshooting 60
or monitoring purposes. Solaris 10 has an extensive range of diagnostics tools and features. A number of these tools are hightlighted here.
1.18.4.1 Improved pmap The Solaris pmap utility has been improved in Solaris 10 to print stack segments as [stack] unlike older Solaris releases. This helps us to locate stack easily. The follow shows some example output : 19846:/net/myserver/export1/user/j2sdk1.5.0/bin/java -Djava.endorsed.d 00010000 72K r-x-/export/disk09/jdk/1.5.0/rc/b63/binaries/solsparc/bin/java 00030000 16K rwx-/export/disk09/jdk/1.5.0/rc/b63/binaries/solsparc/bin/java 00034000 32544K rwx-[ heap ] D1378000 32K rwx-R [ stack tid=44 ] D1478000 32K rwx-R [ stack tid=43 ] D1578000 32K rwx-R [ stack tid=42 ] D1678000 32K rwx-R [ stack tid=41 ] D1778000 32K rwx-R [ stack tid=40 ] D1878000 32K rwx-R [ stack tid=39 ] D1974000 48K rwx-R [ stack tid=38 ] D1A78000 32K rwx-R [ stack tid=37 ] D1B78000 32K rwx-R [ stack tid=36 ] [.. more lines removed here to reduce output ..] FF370000 8K r-x-- /usr/lib/libsched.so.1 FF380000 8K r-x-- /platform/sun4u-us3/lib/libc_psr.so.1 FF390000 16K r-x-- /lib/libthread.so.1 FF3A4000 8K rwx-- /lib/libthread.so.1 FF3B0000 8K r-x-- /lib/libdl.so.1 FF3C0000 168K r-x-- /lib/ld.so.1 FF3F8000 8K rwx-- /lib/ld.so.1 FF3FA000 8K rwx-- /lib/ld.so.1 FFB80000 24K ----[ anon ] FFBF0000 64K rwx-[ stack ] total 167224K
1.18.4.2 Improved pstack On Solaris 10, the pstack command line tool prints mixed mode stack traces (Java and C/C++ frames) from a core file or a live process. The pre-Solaris 10 pstack utility does not support Java. It used to print hexadecimal addresses for both interpreted and (HotSpot) compiled Java methods. The new Solaris 10 pstack prints Java method names for interpreted, compiled and inlined Java methods.
1.18.4.3 dtrace The Solaris truss utility allows tracing of system calls, user mode functions, and signals. truss prints 61
the arguments of system calls and user functions. Solaris 10 includes dtrace which allows dynamic tracing of the operating system kernel and user level programs. dtrace allows scripting at system call entry/exit, user mode function entry/exit and many other probe points. The scripts executed at probe points are written in the D language (a C-like language with safe pointer semantics). You can get more details on dtrace at: http://www.sun.com/bigadmin/content/dtrace/ At probe points, you can print the stack trace current thread using the ustack built-in function. This function prints Java method names in addition to C/C++ native function names! The following is a simple D-script that prints a full stack trace whenever a thread calls the read system call. #!/usr/sbin/dtrace -s syscall::read:entry /pid == $1 && tid == 1/ { ustack(50, 0x2000); }
The above script stored in a file named read.d is run with the command: read.d If your java application generated a lot of I/O or had some unexpected latency, using dtrace and it's java-enabled ustack() action, you can track the problem down.
62
1.19 Developing Diagnostic Tools JDK 5.0 has extensive Application Programing Interfaces (APIs) which can be used to develop tools to observe, monitor, profile, debug, and diagnose issues in applications that are deployed on the Java Runtime Environment. The development of new tools is beyond the scope of this document. Instead we provide a brief overview of the programming interfaces available. Refer also to example and demonstration code that is included in the JDK download. java.lang.management The java.lang.management package provides the management interface for monitoring and management of the Java Virtual Machine, and the operating system. Specifically it covers interfaces for the following systems : •
class loading
•
compilation
•
garbage collection
•
memory manager
•
runtime
•
threads
The java.lang.management package is fully described in the API documentation found at: http://java.sun.com/j2se/1.5.0/docs/api/index.html JDK 5.0 includes example code that demonstrates the usage of the java.lang.management package. These examples can be found in the $JAVA_HOME/demo/management directory (where $JAVA_HOME is the directory where the JDK is installed). The examples include : •
MemoryMonitor - demonstrates the use of the java.lang.management API to observe the memory usage of all memory pools consumed by the application.
•
FullThreadDump - demonstrates the use of the java.lang.management API to print a full thread dump.
•
VerboseGC - demonstrates the use of the java.lang.management API to print the garbage collection statistics and memory usage of an application.
In addition to java.lang.management, the Sun implementation of 5.0 includes platform extensions in the com.sun.management package. The platform extensions include a management interface to obtain detailed statistics from garbage collectors which perform collections in cycles. It also includes a management interface to obtain additional memory statistics from the operating system. Details on the platform extensions can be found at: http://java.sun.com/j2se/1.5.0/docs/guide/management/extension/index.html
63
java.lang.instrument The java.lang.instument package provides services that allow Java programming language agents to instrument programs running on the JVM. Instrumentation is used by tools such as profilers, tools for tracing method calls, and many others. The package facilitates both load-time and dynamic instrumentation. It also includes methods to obtain information on the loaded classes and information about the amount of storage consumed by a given object. The java.lang.instrument package is fully described in the API documentation which can be found at: http://java.sun.com/j2se/1.5.0/docs/api/index.html java.lang.Thread The java.lang.Thread class has a static method called getAllStackTraces that returns a map of stack traces for all live threads. The Thread class also has a method called getState that returns the thread state; states are defined by the java.lang.Thread.State enumeration. These methods are noted here as they can be useful when adding diagnostics or monitoring capabilities to an application. They are fully described in the API documentation. Java Virtual Machine Tools Interface The Java Virtual Machine Tools Interface (JVM TI) is a native (C/C++) programming interface which can be used to develop a wide range of developing and monitoring tools. JVM TI provides an interface for the full breadth of tools that need access to VM state, including but not limited to: profiling, debugging, monitoring, thread analysis, and coverage analysis tools. The HPROF profiler, the Java Debug Wire Protocol (JDWP) agent, and the java.lang.instrument implementation are example agents that rely on JVM TI. The specification for JVM TI can be found at: http://java.sun.com/j2se/1.5.0/docs/guide/jvmti/jvmti.html JDK 5.0 includes example code that demonstrates the usage of JVM TI. These examples can be found in the $JAVA_HOME/demo/jvmti directory (where $JAVA_HOME is the directory where the JDK is installed). The examples include : •
mtrace - an agent library that tracks method call and return counts. It uses byte-code instrumentation to instrument all classes loaded into the virtual machine and prints out a sorted list of the frequently used methods.
•
heapTracker – an agent library that tracks object allocation. It uses byte-code instrumentation to instrument constructor methods.
•
heapViewer – an agent library that prints heap statistics when Ctrl-\ or Ctrl-Break is pressed. For each loaded class it prints an instance count of that class and the space used.
64
Java Platform Debugger Architecture The Java Platform Debugger Architecture (JPDA) is the architecture designed for use by debuggers and debugger-like tools. It consists of two programming interfaces and a wire protocol. JVM TI is the interface to the virtual machine (as described above); Java Debug Wire Protocol (JDWP) defines the format of information and requests transferred between the process being debugged and the debugger front end, which implements the Java Debug Interface (JDI). The Java Debug Interface defines information and requests at the user code level. It is a pure Java programming language interface for debugging Java programming language applications. In JPDA, the JDI is a remote view in the debugger process of a virtual machine in the debuggee process. It is implemented by the front-end (above) while a debugger-like application (IDE, debugger, tracer, monitoring tool, ...) is the client. A complete description (including specifications) for JPDA can be found at: http://java.sun.com/j2se/1.5.0/docs/guide/jpda/index.html jdb is the example command-line debugger included in JDK 5.0. jdb uses JDI to launch or connect to the target VM. The source code to jdb is included in the $JAVA_HOME/demo/jpda/examples.jar (where $JAVA_HOME is the directory where the JDK is installed). In addition to traditional debugger-type tools, JDI can also be used to develop tools that help in post mortem diagnostics and scenarios where the tool needs to attach to a process in a non-cooperative manner (a hung process for example). See section 1.15 for a description of the JDI Connectors which can be used to attach a JDI-based tool to a crash dump or hung process.
Java Virtual Machine Profiling Interface Older releases of J2SE shipped with an experimental profiler interface called the Java Virtual Machine Profiling Interface (JVMPI). JVMPI is a deprecated interface as of J2SE 5.0. Its use in the development of new tools is discouraged as the interface is VM invasive, non-scalable, and as a result will be removed in the next major release of J2SE after 5.0. The new JVM TI should be used in its place.
65
2 Troubleshooting Information This present document addresses possible problems between the application and the Java HotSpotTM virtual machine. For help in troubleshooting applications that use the Java SE desktop technologies (for example, AWT, Java 2D, Swing, and others), see the Troubleshooting Guide for Java SE 6 Desktop Technologies, which applies to both releases 5.0 and 6 of Java SE: PDF: http://java.sun.com/javase/6/webnotes/trouble/TSG-Desktop/TSG-Desktop.pdf HTML: http://java.sun.com/javase/6/webnotes/trouble/TSG-Desktop/html/toc.html This chapter provides information and guidance on how to approach the following important issues: •
Memory Leaks
•
Crashes
•
Hangs
•
Integrating Applications that Make Use of System Signals
66
2.1 Diagnosing Memory Leaks A common issue that many developers find themselves chasing is that of applications that terminate with java.lang.OutOfMemoryError. A related issue arises with applications that terminate because the virtual memory on the operating system is exhausted (or close to exhaustion). Here we provide more information about what OutOfMemoryError means and provide some suggestions on how the issue can be diagnosed.
2.1.1 What does OutOfMemoryError mean? The java.lang.OutOfMemoryError error is thrown when there is insufficient space to allocate an object in the java heap (or a particular area of the heap). That is, garbage collection cannot make any further space available to accommodate a new object and the heap cannot be expanded further. An OutOfMemoryError does not imply a memory leak – the issue can be as simple as a configuration issue where the specified heap size (or the default size if not specified) is insufficient for the application. A java.lang.OutOfMemoryError error can also be thrown by native library code when a native allocation cannot be satisfied. This is not intuitive, but when an OutOfMemoryError is thrown it is not always obvious (at least initially) if the issue is that the java heap is exhausted or there is native heap exhaustion (low swap space for example). An early step to diagnose an OutOfMemoryError is to determine what the error means. Does it mean that the java heap is full or does it mean that the native heap is full? Here we list some of the possible error messages and explain what they mean: Exception in thread “main” java.lang.OutOfMemoryError: Java heap space This indicates that an object could not be allocated in the java heap. The issue may be just a configuration issue; for example, the -mx option may have been used to specify a maximum heap size that is insufficient for the application. In other cases, and in particular for a long-lived application, it may be an indication that the application (or APIs used by that application) is un-intentionally holding references to objects which prevents them from being garbage collected. This is the Java Language equivalent of a memory leak. One other potential source of OutOfMemoryError arises with applications that make excessive use of finalizers. If a class has a finalize method then objects of that type do not have their space reclaimed at garbage collection time. Instead after garbage collection the objects are queued for finalization which occurs sometime later. In the Sun implementation finalizers are executed by a daemon thread that services the finalization queue. If the finalizer thread cannot keep up with the finalization queue then it is possible that the java heap will fill up and OutOfMemoryError will be thrown. One scenario that can induce this condition is when an application creates high priority threads that cause the finalization queue to increase at a rate that is faster than the rate that the finalizer thread is servicing that queue. Monitoring the number of objects for which finalization is pending is discussed in section 2.1.2.5. Exception in thread “main” java.lang.OutOfMemoryError: PermGen space 67
This indicates that the permanent generation is full. The permanent generation is the area of the heap where class and method objects are stored. If an application loads a very large number of classes then the permanent generation may need to be increased using the -XX:MaxPermSize option. The permanent generation is also used when java.lang.String objects are interned7. If an application interns a huge number of strings it may require the permanent generation be increased from its default setting. Exception in thread “main” java.lang.OutOfMemoryError: Requested array size exceeds VM limit This indicates that the application (or APIs used by that application) attempted to allocate an array that is larger than the heap size. For example if an application attempts to allocate an array of 512MB but the maximum heap size is 256MB then OutOfMemoryError will be thrown with this reason. In most cases this issue is likely to be a configuration issue (heap size too small), or a bug that results in an application attempting to create a huge array (the number of elements in the array have been computed using an algorithm that computes an incorrect size for example). Exception in thread “main” java.lang.OutOfMemoryError: request bytes for . Out of swap space? Although it appears that an OutOfMemoryError is thrown this apparent exception is reported by the HotSpot VM code when an allocation from the native heap failed and the native heap may be close to exhaustion. The message indicates the size (in bytes) of the request that failed and also indicates what the memory is required for. In some cases the reason will be shown but in most cases the reason will be the name of a source module reporting the allocation failure. If an OutOfMemoryError with this error is thrown it may require using utilities on the operating system to diagnose the issue further. Examples of issues that may not be related to the application are when the operating system is configured with insufficient swap space, or when there is another process on the system that is consuming all memory resources. If neither of these issues is the cause then it is possible that the application is failed due to native leak; for example, application or library code is continuously allocating memory but is not releasing it to the operating system. Exception in thread "main" java.lang.OutOfMemoryError: (Native method) If the OutOfMemoryError is thrown and a stack trace is printed and the top frame in the stack trace is a Native method, this is an indication that a native method has encountered an allocation failure. The difference between this and the previous message is that the allocation failure was detected in a JNI/native method rather than VM code. As with the previous message it requires using utilities on the operating system to further diagnose the issue. A crash instead of an OutOfMemoryError Sometimes an application may crash soon after an allocation from the native heap fails. This arises with native code that does not check for errors returned by memory allocation functions. The malloc 7 java.lang.String maintains a pool of strings. When the intern method is invoked, it checks the pool to see if an equal string is already in the pool. If there is then the intern method returns it, otherwise it adds the string to the pool. In more precise terms, the java.lang.String.intern method is used to obtain the canonical representation of the string; the result is a reference to the same class instance that would be returned if that string appeared as a literal.
68
system call (for example) returns NULL if there is no memory available. If the return from malloc is not checked then the application may crash when it attempts to access an invalid memory location. Depending on the circumstances, this type of issue can be difficult to locate. However in some cases the information from the fatal error log or the crash dump may be sufficient to diagnose this issue. (The fatal error log is covered in detail in section 2.2.1.) If a crash is diagnosed to be because an allocation failure is not checked then the reason for the allocation failure must be examined. As per any other native heap issue, it may be that the system is configured with insufficient swap space, another process on the system is consuming all memory resources, or there is a leak in the application (or the APIs that it uses) that causes the system to run out of memory.
2.1.2 Diagnosing Leaks in Java Language Code Diagnosing leaks in Java Language code can be a difficult task. In most cases it requires very detailed knowledge of the application. In addition the process is often iterative and lengthy. 2.1.2.1 The NetBeans Profiler The NetBeans Profiler (previously known as JFluid) is an excellent profiler that can locate memory leaks very quickly. With most commercial memory leak debugging tools it can often take a long time to locate a leak in a large application. The NetBeans Profiler, however, uses the pattern of allocations and reclamations (or lack thereof) that such objects typically demonstrate. The profiler can check where these objects were allocated, which in many cases is sufficient to identify the root cause of the leak. More details can be found at http://profiler.netbeans.org. At the time of this writing, the NetBeans Profiler relied on a special build of J2SE 1.4.2. However the profiler is in the process of being updated so that it will work with a future update release of J2SE 5.0. For this reason further discussion on the NetBeans Profiler is not included here. Readers should check the web site for updates on this issue. 2.1.2.2 Using HAT The Heap Analysis Tool (HAT) is described in section 1.11. HAT is useful when debugging unecessary object retention (or memory leaks). It provides a way to browse an object dump, view all reachable objects in the heap, and understand which references are keeping an object alive. Note: The Java Heap Analysis Tool (jhat) provides the same functionality as HAT, with several additional enhancements and improvements. See section 1.12. To use HAT (or jhat) it is necessary to obtain one or more binary format heap dumps of the running application. One way to obtain a heap dump is to run the application with the HPROF profiler agent. Following is an example command line: java -agentlib:hprof=file=dump.hprof,format=b
If the VM is embedded or is not started using a command line launcher that allows additional options 69
be provided then it may be possible to use the JAVA_TOOLS_OPTIONS environment variable so that the -agentlib option is automatically added to the command line. See section 1.17.5 for further information on this environment variable. Once the application is running with HPROF, a heap dump is created by pressing Ctrl-\ or Ctrl-Break (depending on the platform) on the application console/standard output. An alternative approach on Solaris and Linux is to send a QUIT signal via the kill -QUIT command. When the signal is received a heap dump is created; in this case the dump.hprof file is created. A dump file can contain multiple heap dumps. If Ctrl-\ or Ctrl-Break is pressed a number of times then the second, and subsequent, dumps are appended to the file. HAT uses the # syntax to distinguish the dump (where n is the dump number). Recent update releases have introduced two new ways to obtain a heap dump in binary format: •
As of Java SE release 5.0 update 7, the -XX:+HeapDumpOnOutOfMemoryError command-line option tells the HotSpot VM to generate a heap dump when an OutOfMemoryError occurs (see section 1.9).
•
As of Java SE release 5.0 update 14, the -XX:+HeapDumpOnCtrlBreak command-line option tells the HotSpot VM to generate a heap dump when a Ctrl-Break or SIGQUIT signal is received (see section 1.10).
Once a dump file is created it can be used as input to HAT. HAT processes the dump file and then starts a HTTP server on a specified port. Once started you can use any browser to connect to HAT and browse the heap. Here is an example where the input file is dump.hprof and HAT is started on TCP port 7000. It assumes that HAT_BIN is set to the HAT bin directory which contains hat.jar.
java -jar $HAT_BIN/hat.jar -port 7000 dump.hprof Started HTTP server on port 7000 Reading from dump.hprof... Dump file created Fri Sep 03 17:13:43 BST 2004 Snapshot read, resolving... Resolving 163131 objects... Chasing references, expect 326 dots............................................................................. ................................................................................. ................................................................................. ................................................................................. ...... Eliminating duplicate references....................................................................... ................................................................................. ................................................................................. ................................................................................. ............ Snapshot resolved. Server is ready.
Once the “Server is ready” message is printed you can use any browser to connect to HAT. In this example (TCP port 7000) the URL to input is: http://127.0.0.1:7000/
70
The initial page returned by HAT is the All Classes (excluding platform) query. This query returns a list of all classes in the heap dump excluding java.*, javax.*, and sun.* packages. At the end of the page there is a link to other queries : 1. 2. 3. 4.
All classes including platform Show all members of the rootset Show instance counts for all classes (including platform) Show instance counts for all classes (excluding platform)
To get useful information from HAT often requires that you have some knowledge of the application and in addition some knowledge about the libraries/APIs that it uses. However in general it can be used to answer two important questions: 1. What is keeping an object alive? When viewing an object instance you can check the objects listed in the section entitled “References to this object” to see which objects directly reference this object. More importantly you use a “roots query” to provide you with the reference chains from the root set to the given object. These references chains show a path from a root object to this object. With these chains you can quickly see how an object is reachable from the root set. As noted in section 1.11 there are two kinds of roots queries: One that excludes weak references (roots), and one that includes them (allRoots). A weak reference is a reference object that does not prevent its referent from being made finalizable, finalized, and then reclaimed. If an object is only referred to by a weak reference, it usually isn't considered to be retained, because the garbage collector can collect it as soon as it needs the space. HAT sorts the rootset reference chains by the type of the root, in this order: • •
• •
Static data members of Java classes. Java local variables. For these roots, the thread responsible for them is shown. Because a Thread is a Java object, this link is clickable. This allows you, for example, to easily navigate to the name of the thread. Native static values. Native local variables. Again, such roots are identified with their thread.
2. Where was this object allocated? When viewing an object instance the section entitled “Objects allocated from” shows the allocation site in the form of a stack trace so you can see where the object was created. If the leak cannot be identified using a single object dump then another approach is to collect a series of dumps and to focus on the objects created in the interval between each dump. HAT provides this capability using the -baseline option. Specifying a baseline The -baseline option8 allows two dumps obtained from the same VM instance to be compared. If the 8
There are two bugs in the version of HPROF that shipped with JDK5.0. As a result some records in the second and subsequent dump may be missing. The bugs tracking these issues are 5105917 and 5105918.
71
same object appears in both dumps it will be excluded from the list of new objects reported. This approach requires that one dump be specified as a baseline and the analysis can then focus on the objects that are created in the second dump since the baseline was obtained. Following is an example if how the baseline is specified : $ java -jar hat.jar -port 7000 -baseline hprof.dump#1 hprof.dump#2 Started HTTP server on port 7000 Reading from hprof.dump... Dump file created Mon Sep 06 10:34:44 BST 2004 Snapshot read, resolving... Resolving 57335 objects... Chasing references, expect 114 dots............................................................................. .................................... Eliminating duplicate references....................................................................... ........................................... Snapshot resolved. Reading baseline snapshot... Dump file created Mon Sep 06 10:34:44 BST 2004 Resolving 57335 objects... Discovering new objects... Server is ready.
In the prior example, the dump file is hprof.dump. The first dump (#1) was created by pressing Ctrl-\ or Ctrl-Break (depending on platform) at the application console/standard output. Thereafter, a second dump was written to the file (#2 refers to the second dump in the file). When HAT is started with two heap dumps the “Show instance counts for all classes” query includes an additional column that is the count of the number of new objects for that type. An instance is considered new if it is in the second heap dump, and there is no object of the same type with the same ID in the baseline. If you click on a new count then HAT lists the new objects of that type. Then for each instance you can view where it was allocated, which objects these new objects reference, and which other objects reference the new object. In general, the baseline option can be very useful if the objects that need to be identified are created in the interval between the successive dumps. 2.1.2.3 Obtaining an Object Histogram on Solaris or Linux On Solaris and Linux it may be possible to quickly narrow down a memory leak by examining a heap histogram. A heap histogram can be obtained from a running process using the jmap -histo command. The output shows the total size and instance count for each class type in the heap. If a sequence of histograms is obtained (every 2 minutes for example) then it may be possible to observe a trend that can lead to further analysis.
72
2.1.2.4 Obtaining an Object Histogram at VM Shutdown on Solaris On Solaris the truss utility can be used to stop the java process before it exits. Following is an example command: truss -f -t \!all -T _exit -s \!all java
In this case the “java ” command string is provided to truss. The -f option is specified to follow forked children; this is necessary because the java launcher somethings needs to setup the LD_LIBRARY_PATH environment variable and re-exec itself. An alternative form is to specify the process-id (pid) of the running process. When the OutOfMemoryError is thrown, and the process executes the _exit system call, then the process will stop. At this point you can get a core file using the gcore utility or you can use the jmap utility to obtain the histogram. Following is an example that gets the core file and use jmap on the core file to get the histogram: $ gcore 27421 gcore: core.27421 dumped $ jmap -histo \ /java/re/j2se/1.5/latest/binaries/solaris-sparc/bin/java core.27421 Attaching to core core.27421 from executable /java/re/j2se/1.5/latest/binaries/solaris-sparc/bin/java, please wait... Debugger attached successfully. Server compiler detected. JVM version is 1.5.0-rc-b63 Iterating over heap. This may take a while... Object Histogram: Size Count Class description ------------------------------------------------------86683872 3611828 java.lang.String 20979136 204 java.lang.Object[] 403728 4225 * ConstMethodKlass 306608 4225 * MethodKlass 220032 6094 * SymbolKlass 152960 294 * ConstantPoolKlass 108512 277 * ConstantPoolCacheKlass 104928 294 * InstanceKlassKlass 68024 362 byte[] 65600 559 char[] 31592 359 java.lang.Class 27176 462 java.lang.Object[] 25384 423 short[] 17192 307 int[] : :
The example show that the OutOfMemoryError is caused due to the number of java.lang.String objects (3611828 instances in the heap). Without further analysis it's not clear from this where the strings are allocated. However the information is still useful and the investigation can continue with 73
tools such as HPROF or HAT to find out where the strings are allocated, and what references are keeping them alive and preventing them from being garbage collected. 2.1.2.5 Monitoring the Number of Objects that are Pending Finalization The jconsole management tool (section 1.5) can be used to monitor the number of objects that are pending finalization. As noted in section 2.1.1, excessive use of finalizers can be the cause of OutOfMemoryError. In jconsole the pending finalization count is reported in the memory statistics on the “Summary” tab pane. The count is approximate but it can be used to characterize an application and understand if it relies a lot on finalization. In addition to using jconsole, an application can also report the approximate number of objects pending finalization using the getObjectPendingFinalizationCount method in the java.lang.management.MemoryMXBean class. Links to the API documentation and example code can be found in section 1.19. The example code can easily be extended to include the reporting of the pending finalization count.
2.1.2.6 Third Party Memory Debuggers In addition to the NetBeans Profiler and HAT there are a large number of third party memory debuggers available. JProbe from Quest Software, and OptimizeIt from Borland are two examples of commerical tools with memory debugging capability. There are many others and we do not provide any specific product recommentation here.
2.1.3 Diagnosing Leaks in Native Code There are several techniques used to find and isolate native code memory leaks. A very common practice is to track all allocation and free calls of the native allocations. This can be a fairly simple process or a very sophisticated one. Many products over the years have been built up around the tracking of native heap allocations and the use of that memory. Tools like Purify and Sun's dbx RTC (Run Time Checking) functionality can be used to find these leaks in normal native code situations and also find any access to native heap memory that represents assignments to uninitialized memory or accesses to freed memory. Not all these types of tools will work with Java applications that use native code, and usually these tools are very platform specific. Since the virtual machine dynamically creates code at runtime, these tools can become confused and fail to run at all, or give false information. Check with your tool vendor to make sure the version of the tool works with the version of the virtual machine you are using. Many simple and portable native memory leak detecting examples can be found at http://sourceforge.net/ . Most of these libraries and tools assume you can re-compile or edit the source of the application and place wrapper functions over the allocation functions. The more powerful of these allow you to run your application unchanged by interposing over these allocation functions dynamically. This is the case with the Solaris 10 library libumem.so (2.1.3.2). In general there is no single ideal solution for all platforms. Anyone writing a JNI library would probably be wise to create some kind of localized way to make sure your library doesn't leak memory using a simple wrapper approach. 74
An easy localized allocation tracking approach for a JNI library would be something like: #include #define malloc(n) debug_malloc(n, __FILE__, __LINE__) #define free(p) debug_free(p, __FILE__, __LINE__)
The above would need to be defined in all source files. And then you could use these functions to watch for leaks: /* Total bytes allocated */ static int total_allocated; /* Memory alignment is important */ typedef union { double d; struct {size_t n; char *file; int line;} s; } Site; void * debug_malloc(size_t n, char *file, int line) { char *rp; rp = (char*)malloc(sizeof(Site)+n); total_allocated += n; ((Site*)rp)->s.n = n; ((Site*)rp)->s.file = file; ((Site*)rp)->s.line = line; return (void*)(rp + sizeof(Site)); } void debug_free(void *p, char *file, int line) { char *rp; rp = ((char*)p) - sizeof(Site); total_allocated -= ((Site*)rp)->s.n; free(rp); }
The JNI library would then need to periodically (or at shutdown) check total_allocated to make sure it made sense. The above code could also be expanded to actually save in a linked list the allocations that remained and report where the leaked memory was allocated. This is a localized and portable way to track memory allocations in a single set of sources. You would need to make sure debug_free() was only called with a pointer that came from debug_malloc(), and you would also need to create similar functions for realloc(), calloc(), strdup(), etc. if they were used. A more global way to look for native heap memory leaks would involve interposition of the library calls for the entire process. Most systems include some form of global allocation tracking support. •
On Windows, go to http://msdn.microsoft.com/library/default.asp and search for debug support. The Microsoft C++ compiler has the /Md and /Mdd compiler options that will automatically include extra support for tracking memory allocations. 75
• •
Linux systems have things like mtrace and libnjamd to help in dealing with allocation tracking. Solaris systems have watchmalloc, and Solaris 10 and 9 update 3 started providing libumem (2.1.3.2).
2.1.3.1 Using dbx to find leaks The Sun debugger dbx (which is also available on Linux) has the Run Time Checking (RTC) functionality that will find leaks. As mentioned earlier, the Virtual Machine and the way the java executable starts up can be a problem for dbx, but here is a sample dbx session: $ dbx ${java_home}/bin/java Reading java Reading ld.so.1 Reading libthread.so.1 Reading libdl.so.1 Reading libc.so.1 (dbx) dbxenv rtc_inherit on (dbx) check -leaks leaks checking - ON (dbx) run HelloWorld Running: java HelloWorld (process id 15426) Reading rtcapihook.so Reading rtcaudit.so Reading libmapmalloc.so.1 Reading libgen.so.1 Reading libm.so.2 Reading rtcboot.so Reading librtc.so RTC: Enabling Error Checking... RTC: Running program... dbx: process 15426 about to exec("/net/bonsai.sfbay/export/home2/user/ws/j2se/build/solaris-i586/bin/java") dbx: program "/net/bonsai.sfbay/export/home2/user/ws/j2se/build/solaris-i586/bin/java" just exec'ed dbx: to go back to the original program use "debug $oprog" RTC: Enabling Error Checking... RTC: Running program... t@1 (l@1) stopped in main at 0x0805136d 0x0805136d: main : pushl %ebp (dbx) when dlopen libjvm { suppress all in libjvm.so; } (2) when dlopen libjvm { suppress all in libjvm.so; } (dbx) when dlopen libjava { suppress all in libjava.so; } (3) when dlopen libjava { suppress all in libjava.so; } (dbx) cont Reading libjvm.so Reading libsocket.so.1 Reading libsched.so.1 Reading libCrun.so.1 Reading libm.so.1 Reading libnsl.so.1 Reading libmd5.so.1 Reading libmp.so.2 Reading libhpi.so Reading libverify.so Reading libjava.so Reading libzip.so Reading en_US.ISO8859-1.so.3 hello world
76
hello world Checking for memory leaks... Actual leaks report Total Size
(actual leaks:
27
total size:
46851 bytes)
Num of Blocks
Leaked Allocation call stack Block Address ========== ====== =========== ======================================= 44376 4 calloc < zcalloc 1072 1 0x8151c70 _nss_XbyY_buf_alloc < get_pwbuf < _getpwuid < GetJavaProperties < Java_java_lang_System_initProperties < 0xa740a89a< 0xa7402a14< 0xa74001fc 814 1 0x8072518 MemAlloc < CreateExecutionEnvironment < main 280 10 operator new < Thread::Thread 102 1 0x8072498 _strdup < CreateExecutionEnvironment < main 56 1 0x81697f0 calloc < Java_java_util_zip_Inflater_init < 0xa740a89a< 0xa7402a6a< 0xa7402aeb< 0xa7402a14< 0xa7402a14< 0xa7402a14 41 1 0x8072bd8 main 30 1 0x8072c58 SetJavaCommandLineProp < main 16 1 0x806f180 _setlocale < GetJavaProperties < Java_java_lang_System_initProperties < 0xa740a89a< 0xa7402a14< 0xa74001fc< JavaCalls::call_helper < os::os_exception_wrapper 12 1 0x806f2e8 operator new < instanceKlass::add_dependent_nmethod < nmethod::new_nmethod < ciEnv::register_method < Compile::Compile #Nvariant 1 < C2Compiler::compile_method < CompileBroker::invoke_compiler_on_method < CompileBroker::compiler_thread_loop 12 1 0x806ee60 CheckJvmType < CreateExecutionEnvironment < main 12 1 0x806ede8 MemAlloc < CreateExecutionEnvironment < main 12 1 0x806edc0 main 8 1 0x8071cb8 _strdup < ReadKnownVMs < CreateExecutionEnvironment < main 8
1
0x8071cf8
_strdup < ReadKnownVMs < CreateExecutionEnvironment < main
As you can see, dbx appears to think there are memory leaks because any memory not freed at the time the process is about to exit is considered leaked. Memory allocated at initialization time and needed for the life of the process is often never freed in native code, so the assumption that all memory must be freed at process exit often isn't the case in reality. Note that we used two suppress commands to suppress the leaks reported in the Virtual Machine (libjvm.so) and the java support library (libjava.so).
2.1.3.2 Using libumem on Solaris 10 to Find Leaks On Solaris 10 the libumem.so library and the modular debugger (mdb) can be used to debug memory leaks. The libumem library is also available on Solaris 9 from update 3. To use libumem requires that you preload the libumem library and set an environment variable as follows: $ LD_PRELOAD=libumem.so $ export LD_PRELOAD $ UMEM_DEBUG=default $ export UMEM_DEBUG
Now, run the Java application but stop it before it exits. Following is an example using truss to stop 77
the process when it calls the _exit system call: truss -f -T _exit java MainClass
At this point you can attach mdb: mdb -p >::findleaks
The ::findleaks command is the mdb command to find memory leaks. If a leak is found, the findleaks command prints the address of the allocation call, buffer address and nearest symbol. It is also possible to get the stack trace for the allocation which resulted in the memory leak by dumping the bufctl structure. The address of this structure can be gathered from the ouput of the ::findleaks command. The commands to do this, and more information on using libumem to identify memory managements bugs can be found at: http://access1.sun.com/techarticles/libumem.html
78
2.2 Crashes A crash, or fatal error, causes a process to terminate. The possible reasons for a crash are varied. For example a crash can arise due to a bug in the HotSpot VM, in a system library, in a J2SE library/API , in application native code, or even a bug in the operating system. There can be external factors too. For example, a crash can arise due to resource exhaustion in the operating system. Crashes caused by bugs in the HotSpot VM or J2SE library code should be rare. In the event that you do encounter a crash then this chapter provides suggestions on how to examine the crash. In some cases it may be possible to workaround a crash until the cause of the bug is diagnosed and fixed. In general the first step with any crash it to locate the fatal error log. The fatal error log is a file named hs_err_pid.log (where is the process id of the process). Normally the file is created in the working directory of the process. However because of disk space, directory permissions, or other reasons, the file may instead be created in the temporary directory of the operating system. On Solaris and Linux the temporary directory is /tmp. On Windows the temporary directory is specified by the value of the TMP or TEMP environment variable. In this section we describe the format of the fatal error log, describe how the error log can be analyzed, and in a few cases provide suggestions on how the issue may be worked around.
2.2.1 Format of the Fatal Error Log Section 1.13.1 provided a high level list of the information that is written to the fatal error log. Here the error log is described in more detail. The error log is a text file consisting of a header that provides a brief description of the crash. This is followed by sections with thread, process, and system information. It should be noted that the format of the fatal error log described here is based on JDK5.0. In future releases the format may be different. If you develop scripts or tools that depend on the format then these scripts or tools may cease to work if the format is changed. 2.2.1.1 Header At the beginning of every HotSpot error log file is a brief description about the problem. It is also printed to standard output and may show up in the application's output log. Following is a sample header from a crash: # # # # # # # #
An unexpected error has been detected by HotSpot Virtual Machine: SIGSEGV (0xb) at pc=0x417789d7, pid=21139, tid=1024 Java VM: Java HotSpot(TM) Client VM (1.5.0-beta2-b37 mixed mode) Problematic frame: C [libNativeSEGV.so+0x9d7]
79
This example shows that the VM died on an unexpected signal. The second line describes the signal type, program counter (pc) that caused the signal, process ID and thread ID.
#
SIGSEGV (0xb) at pc=0x417789d7, pid=21139, tid=1024 | | | | +--- thread id | | | +------------- process id | | +--------------------------- instruction pointer | +--------------------------------------- signal number +---------------------------------------------- signal name
Next line is the VM version which indicates if the Client VM or Server VM is used, and it will also indicate if the application is run in mixed or interpreted mode, and it will indicate if class file sharing is enabled.
# Java VM: Java HotSpot(TM) Client VM (1.5.0-rc-b63 mixed mode, sharing)
The version information is followed by the function frame that caused the crash: # Problematic frame: # C [libNativeSEGV.so+0x9d7] | +-- Same as pc, but represented as library name and offset. | For position independent libraries (JVM and most shared | libraries), it's possible to inspect the instructions | that caused the crash without a debugger or core file. | Just use a disassembler to dump instructions near the | offset. +----------------- Frame type
In this example the “C” indicates a native C frame. The following table lists the possible frame types: Frame
Description
C
Native C frame
J
Other frame types including compiled Java frames
j
Interpreted Java frames
V
VM frames
v
VM generated stub frame
Internal errors (for example, guarantee() failure, assertion failure, ShouldNotReachHere()) will cause 80
the VM error handler to generate a similar error dump. However, the header format is different. Here is an example of how the header looks for an internal error : # # An unexpected error has been detected by HotSpot Virtual Machine: # # Internal Error (4F533F4C494E55583F491418160E43505000F5), pid=10226, tid=16384 # # Java VM: Java HotSpot(TM) Client VM (1.5.0-rc-b63 mixed mode)
There is no signal name or signal number. Instead the second line now contains "Internal Error" and a long hexadecimal string. This hexadecimal string encodes the source module and line number where the error was detected. In general this “error string” is only useful to engineers working on the HotSpot Virtual Machine but the following should be noted: •
The error string encodes a line number and therefore it changes with each code change and release. A crash with a given error string in 1.5.0 may not correspond to the same crash in 1.5.0_01 even if the strings match.
•
Errors with the same root cause may have a different error string.
•
Errors with the same error string may have completely different root causes.
•
The error string should not be used as the sole criteria when duplicating bugs.
2.2.1.2 Thread This section contains information about the thread that just crashed. If multiple threads crash at the same time, only one thread is printed. The first part of the thread section shows the thread that provoked the fatal error.
Current thread (0x0805ac88): JavaThread "main" [_thread_in_native, id=21139] | | | | +-- id | | | +------------- state | | +-------------------------- name | +------------------------------------ type +-------------------------------------------------- pointer
The following should be noted : •
The thread pointer is the pointer to the JVM internal Thread structure. It is generally of no interest unless you are debugging a live JVM or core file.
•
Possible thread types: JavaThread, VMThread, CompilerThread, JVMPIDaemonthread, GCTaskThread, WatcherThread, ConcurrentMarkSweepThread. Note the list may change as the VM evolves.
•
The important thread states include:
81
_thread_uninitialized
Thread is not created. This should never happen unless there's memory corruption
_thread_new
Thread has been created but it has not yet started.
_thread_in_native
Thread is running native code. Probably a bug in native code.
_thread_in_vm
Thread is running VM code.
_thread_in_Java
Thread is running (either interpreted or compiled) Java code.
_thread_blocked
Thread is blocked.
..._trans
If you see any of the above states but followed by "_trans", it means the thread is changing to a different state.
The thread id in the output is the native thread identifier. Finally, if a java thread is a daemon thread then “daemon” will be printed before the thread state. After the thread information is the signal information (the unexpected signal that caused the VM to terminate). On Windows the output appears as follows :
siginfo: ExceptionCode=0xc0000005, reading address 0xd8ffecf1
This indicates that the exception code is 0xc0000005 (ACCESS_VIOLATION), and it occurred when the thread attempted to read address 0xd8ffecf1. On Solaris and Linux the signal number (si_signo) and signal code (si_code) are used to identify the exception:
siginfo:si_signo=11, si_errno=0, si_code=1, si_addr=0x00004321
After the signal information the error log shows the register context at the time of the fatal error. The exact format of this output is architecture/processor dependent. Following is example output for the Intel (IA32) processor: Registers: EAX=0x00004321, EBX=0x41779dc0, ECX=0x080b8d28, EDX=0x00000000 ESP=0xbfffc1e0, EBP=0xbfffc1f8, ESI=0x4a6b9278, EDI=0x0805ac88 EIP=0x417789d7, CR2=0x00004321, EFLAGS=0x00010216
The register values may be useful when combined with instructions (see below). 82
After the register values, you will see the top of stack and the instructions/opcodes near the crashing pc. The error log prints 32 bytes which can be decoded using a disassembler to see the instructions around the location of the crash. Note that IA32 and AMD64 instructions are variable length so it's not always possible to reliably decode instructions before the crash pc. Top of Stack: 0xbfffc1e0: 0xbfffc1f0: 0xbfffc200: 0xbfffc210: 0xbfffc220: 0xbfffc230: 0xbfffc240: 0xbfffc250:
(sp=0xbfffc1e0) 00000000 00000000 00000044 4a6b9278 00004321 00000000 00000000 00000000 00000000 4000c78c 00000000 00000000 42010322 417786ec 4177864c 40045250
0818d068 bfffd208 00000cd8 00000004 00000004 00180003 00000000 400131e8
00000000 41778a10 0818d328 00000003 00000000 00000000 00000000 00000000
Instructions: (pc=0x417789d7) 0x417789c7: ec 14 e8 72 ff ff ff 81 c3 f2 13 00 00 8b 45 08 0x417789d7: 0f b6 00 88 45 fb 8d 83 6f ee ff ff 89 04 24 e8
Where possible, the next output in the error log is the thread stack. This includes the addresses of the base and the top of the stack, the current stack pointer, and the amount of unused stack available to the thread. This is followed, where possible, by the stack frames and up to 100 frames are printed. For C/C++ frames the library name may also be printed. It's important to note that in some fatal error conditions the stack may be corrupt so this detail may not be available. Stack: [0x00040000,0x00080000), sp=0x0007f9f8, free space=254k Native frames: (J=compiled Java code, j=interpreted, Vv=VM code, C=native code) V [jvm.dll+0x83d77] C [App.dll+0x1047] j Test.foo()V+0 j Test.main([Ljava/lang/String;)V+0 v ~StubRoutines::call_stub V [jvm.dll+0x80f13] V [jvm.dll+0xd3842] V [jvm.dll+0x80de4] C [java.exe+0x14c0] C [java.exe+0x64cd] C [kernel32.dll+0x214c7]
Java frames: (J=compiled Java code, j=interpreted, Vv=VM code) j Test.foo()V+0 j Test.main([Ljava/lang/String;)V+0 v ~StubRoutines::call_stub
Note that there are two thread stacks printed. The first is Native frames which prints the native thread showing all function calls. However this thread stack doesn't take into account the java methods that are inlined by the runtime compiler; if methods are inlined they appear to be part of the parent's stack frame. The second stack is Java frames which prints the java frames including the inlined methods. It skips the native frames. Depending on the crash it will sometimes not be possible to print the native thread stack but it may be possible to print the java frames.
83
In the event that the error occurred in the VM Thread, or a Compiler Thread then further details may be printed – for example, in the case of the VM Thread the VM operation is printed if the VM Thread is executing a VM operation at the time of the fatal error. Following is an example of output when the Compiler Thread provokes the fatal error; in this case the task is a compiler task and the HotSpot Client VM is compiling method “hs101t004Thread.ackermann”: Current CompileTask: HotSpot Client Compiler:754 b nsk.jvmti.scenarios.hotswap.HS101.hs101t004Thread.ackermann(IJ)J (42 bytes)
For the HotSpot Server VM the output for the compiler task is slightly different but will also include the full class name and method. 2.2.1.3 Process The process section is printed after the thread section. It contains information about the whole process, including thread list and memory usage of the process. The thread list includes the threads that the VM is aware of. This includes all Java threads and some VM internal threads, but does not include any native threads created by the user application that have not attached to the VM. Here's the output format: =>0x0805ac88 JavaThread "main" [_thread_in_native, id=21139] | | | | | +----| | | | +------------------| | | | | | | +--------------------------------| | +-----------------------------------------| +---------------------------------------------------+------------------------------------------------------- "=>"
id state (JavaThread only) name type pointer current thread
and here is example output : Java Threads: ( => current thread ) 0x080c8da0 JavaThread "Low Memory Detector" daemon [_thread_blocked, id=21147] 0x080c7988 JavaThread "CompilerThread0" daemon [_thread_blocked, id=21146] 0x080c6a48 JavaThread "Signal Dispatcher" daemon [_thread_blocked, id=21145] 0x080bb5f8 JavaThread "Finalizer" daemon [_thread_blocked, id=21144] 0x080ba940 JavaThread "Reference Handler" daemon [_thread_blocked, id=21143] =>0x0805ac88 JavaThread "main" [_thread_in_native, id=21139] Other Threads: 0x080b6070 VMThread [id=21142] 0x080ca088 WatcherThread [id=21148]
The thread type and state are described in the threads section. After the thread list is the VM state. This indicates the overall state of the virtual machine. The general states are : 84
• • •
not at a safepoint – normal execution at safepoint – indicates that all threads are blocked in the VM waiting for a special vm operation to complete synchronizing – indicates that a special vm operation is required and the VM is waiting for all threads in the vm to block.
The output is a single line in the error log:
VM state:not at safepoint (normal execution)
Following this is the list of mutexes/monitors that are currently owned by a thread. These mutexes are VM internal locks rather than monitors associated with java objects. Here is an example to show how the output might look when a crash happens when VM locks are held. For each lock it prints the name of the lock, its owner, and the addresses of a VM internal mutex structure and its OS lock. In general this information is usually only useful to those intimately familiar with the HotSpot VM. The owner thread can be cross referenced to the thread list. VM Mutex/Monitor currently owned by a thread: ([mutex/lock_event])[0x007357b0/0x0000031c] Threads_lock - owner thread: 0x00996318 [0x00735978/0x000002e0] Heap_lock - owner thread: 0x00736218
After the list of mutexes is a summary of the heap . The output depends on the GC configuration. In this example the serial collector is used, class data shared is disabled, and the tenured generation is empty (probably indicating the fatal error occurred early or during start-up and a GC has not yet promoted any objects into the tenured generation). Heap def new generation total 576K, used 161K [0x46570000, 0x46610000, 0x46a50000) eden space 512K, 31% used [0x46570000, 0x46598768, 0x465f0000) from space 64K, 0% used [0x465f0000, 0x465f0000, 0x46600000) to space 64K, 0% used [0x46600000, 0x46600000, 0x46610000) tenured generation total 1408K, used 0K [0x46a50000, 0x46bb0000, 0x4a570000) the space 1408K, 0% used [0x46a50000, 0x46a50000, 0x46a50200, 0x46bb0000) compacting perm gen total 8192K, used 1319K [0x4a570000, 0x4ad70000, 0x4e570000) the space 8192K, 16% used [0x4a570000, 0x4a6b9d48, 0x4a6b9e00, 0x4ad70000) No shared spaces configured.
After the heap summary is the list of virtual memory regions at the time of the crash. The list can be long with large applications. The memory map can be very useful when debugging some crashes, as it can tell you what libraries are actually being used, their location in memory, as well as the location of heap, stack and guard pages.
85
The format of the memory map is operating system specific. On Solaris, the base address and library name are printed. On Linux the process memory map (/proc//maps) is printed. On Windows, the base and end addresses of each library are printed. The following example output was generated on Linux/x86 :
Dynamic libraries: 08048000-08056000 r-xp 00000000 03:05 259171 08056000-08058000 rw-p 0000d000 03:05 259171 08058000-0818e000 rwxp 00000000 00:00 0 40000000-40013000 r-xp 00000000 03:0a 400046 40013000-40014000 rw-p 00013000 03:0a 400046 40014000-40015000 r--p 00000000 00:00 0 40015000-4001c000 r-xp 00000000 03:05 727476 /h/jdk1.5/jre/lib/i386/native_threads/libhpi.so 4001c000-4001d000 rw-p 00006000 03:05 727476 /h/jdk1.5/jre/lib/i386/native_threads/libhpi.so 4001d000-40026000 r-xp 00000000 03:0a 400092 40026000-40027000 rw-p 00009000 03:0a 400092 40027000-4002b000 rw-s 00000000 03:0a 244990 4002b000-40031000 r--s 00000000 03:0a 624243 40031000-4003e000 r-xp 00000000 03:0a 144065 4003e000-40045000 rw-p 0000d000 03:0a 144065 40045000-40046000 rw-p 00000000 00:00 0 40046000-40048000 r-xp 00000000 03:0a 400072 40048000-40049000 rw-p 00001000 03:0a 400072 40049000-4035c000 r-xp 00000000 03:05 824473 4035c000-40379000 rw-p 00312000 03:05 824473 40379000-40789000 rw-p 00000000 00:00 0 40789000-4078a000 rwxp 00410000 00:00 0 4078a000-4078e000 rw-p 00411000 00:00 0 4078e000-407af000 r-xp 00000000 03:0a 144063 407af000-407b0000 rw-p 00020000 03:0a 144063 407b0000-407bb000 r-xp 00000000 03:05 727487 407bb000-407bc000 rw-p 0000b000 03:05 727487 407bc000-407bd000 ---p 00000000 00:00 0 407bd000-407c9000 rwxp 00001000 00:00 0 407c9000-407cc000 r--s 00000000 03:05 759533 407cd000-407df000 r-xp 00000000 03:0a 400076 407df000-407e0000 rw-p 00012000 03:0a 400076 407e0000-407e2000 rw-p 00000000 00:00 0 407e2000-40802000 r-xp 00000000 03:05 727488 40802000-40804000 rw-p 0001f000 03:05 727488 40804000-40817000 r-xp 00000000 03:05 727490 40817000-40819000 rw-p 00012000 03:05 727490 40819000-408af000 rw-p 00000000 00:00 0 408af000-4092e000 r--s 00000000 03:05 727556 4092e000-40942000 r--s 00000000 03:05 727555 40942000-4117b000 r--s 00000000 03:05 727669 4117b000-4117e000 rwxp 00000000 00:00 0 4117e000-411fb000 rwxp 00003000 00:00 0 411fb000-411fc000 rwxp 00000000 00:00 0 411fc000-411fd000 rwxp 00081000 00:00 0 411fd000-411ff000 rwxp 00000000 00:00 0 411ff000-4121b000 rwxp 00084000 00:00 0 4121b000-4121f000 rwxp 00000000 00:00 0 4121f000-4123b000 rwxp 000a4000 00:00 0 4123b000-4123d000 rwxp 00000000 00:00 0 4123d000-4125a000 rwxp 00001000 00:00 0 4125a000-4125f000 rwxp 00000000 00:00 0 4125f000-4127b000 rwxp 00023000 00:00 0
86
/h/jdk1.5/bin/java /h/jdk1.5/bin/java /lib/ld-2.2.5.so /lib/ld-2.2.5.so
/lib/libnss_files-2.2.5.so /lib/libnss_files-2.2.5.so /tmp/hsperfdata_user/21139 /usr/lib/gconv/gconv-modules.cache /lib/i686/libpthread-0.9.so /lib/i686/libpthread-0.9.so /lib/libdl-2.2.5.so /lib/libdl-2.2.5.so /h/jdk1.5/jre/lib/i386/client/libjvm.so /h/jdk1.5/jre/lib/i386/client/libjvm.so
/lib/i686/libm-2.2.5.so /lib/i686/libm-2.2.5.so /h/jdk1.5/jre/lib/i386/libverify.so /h/jdk1.5/jre/lib/i386/libverify.so /h/jdk1.5/jre/lib/ext/dnsns.jar /lib/libnsl-2.2.5.so /lib/libnsl-2.2.5.so /h/jdk1.5/jre/lib/i386/libjava.so /h/jdk1.5/jre/lib/i386/libjava.so /h/jdk1.5/jre/lib/i386/libzip.so /h/jdk1.5/jre/lib/i386/libzip.so /h/jdk1.5/jre/lib/jsse.jar /h/jdk1.5/jre/lib/jce.jar /h/jdk1.5/jre/lib/charsets.jar
4127b000-4127e000 4127e000-412fb000 412fb000-412fe000 412fe000-4137b000 4137b000-413a6000 413a6000-413a9000 413a9000-41426000 41426000-4142a000 4142a000-41627000 41627000-4162a000 4162a000-416a7000 416a7000-416a8000 416a8000-41728000 41728000-4174d000 4174d000-41778000 41778000-41779000 41779000-4177a000 41800000-41808000 41808000-41900000 41900000-419bf000 42000000-4212c000 4212c000-42131000 42131000-42135000 42135000-44570000 44570000-44600000 44600000-46570000 46570000-46610000 46610000-46a50000 46a50000-46bb0000 46bb0000-4a570000 4a570000-4ad70000 4ad70000-4e570000 bfe00000-bfe03000 bfe03000-c0000000
---p rwxp ---p rwxp r--p ---p rwxp ---p rwxp ---p rwxp ---p rwxp r--s r--s r-xp rw-p rw-p ---p r--s r-xp rw-p rw-p r--s rwxp rwxp rwxp rwxp rwxp rwxp rwxp rwxp ---p rwxp
00003000 00006000 00083000 00086000 00000000 00003000 00006000 00080000 00084000 00281000 00284000 00301000 00302000 00000000 00000000 00000000 00000000 00000000 000e0000 00000000 00000000 0012c000 00000000 00000000 00000000 00090000 00000000 020a0000 00000000 02640000 00000000 06800000 00000000 ffe04000
00:00 00:00 00:00 00:00 03:0a 00:00 00:00 00:00 00:00 00:00 00:00 00:00 00:00 03:05 03:05 03:05 03:05 00:00 00:00 03:05 03:0a 03:0a 00:00 03:05 00:00 00:00 00:00 00:00 00:00 00:00 00:00 00:00 00:00 00:00
0 0 0 0 466918 0 0 0 0 0 0 0 0 759528 759529 1018095 1018095 0 0 759541 146747 146747 0 727670 0 0 0 0 0 0 0 0 0 0
/usr/lib/locale/en_US.iso885915/LC_CTYPE
/h/jdk1.5/jre/lib/ext/sunjce_provider.jar /h/jdk1.5/jre/lib/ext/sunpkcs11.jar /h/bugs/NativeSEGV/libNativeSEGV.so /h/bugs/NativeSEGV/libNativeSEGV.so /h/jdk1.5/jre/lib/ext/localedata.jar /lib/i686/libc-2.2.5.so /lib/i686/libc-2.2.5.so /h/jdk1.5/jre/lib/rt.jar
The memory map is read as follows : 40049000-4035c000 r-xp 00000000 03:05 824473 /jdk1.5/jre/lib/i386/client/libjvm.so || ^ ^ ^ ^ | | Memory region | | | | | | | | | | Permission --- + | | | | r: read | | | | w: write | | | | x: execute | | | | p: private | | | | s: share | | | | | | | | File offset ----------+ | | | | | | Major ID and minor ID of -------+ | | the device where the file | | is located (i.e. /dev/hda5) | | | | inode number ------------------------+ | | File name ----------------------------------------------------------+
87
Notes: •
Library names and their locations are pretty straightforward
•
Every library has two virtual memory regions. One for code and one for data. The code segment is marked with r-xp (readable, executable, private); data segment is rw-p (readable, writable, private).
•
The java heap is already included in the "Heap usage" output, but it doesn't hurt to check out the actual memory regions reserved for heap (they should match the value in "Heap usage") and the attributes (should be rwxp).
•
Thread stacks usually show up in the memory map as two back-to-back regions, one with attribute ---p (guard page) and one with rwxp (actual stack space). Of course, knowing the guard page size or stack size would make the job a bit easier. For example, in this memory map, 4127b000-412fb000 is stack.
On Windows here is an example of the memory map: Dynamic libraries: 0x00400000 - 0x0040c000 0x77f50000 - 0x77ff7000 0x77e60000 - 0x77f46000 0x77dd0000 - 0x77e5d000 0x78000000 - 0x78087000 0x77c10000 - 0x77c63000 0x08000000 - 0x08183000 0x77d40000 - 0x77dcc000 0x7e090000 - 0x7e0d1000 0x76b40000 - 0x76b6c000 0x6d2f0000 - 0x6d2f8000 0x76bf0000 - 0x76bfb000 0x6d680000 - 0x6d68c000 0x6d370000 - 0x6d38d000 0x6d6a0000 - 0x6d6af000 0x10000000 - 0x10032000
c:\jdk1.5\bin\java.exe C:\WINDOWS\System32\ntdll.dll C:\WINDOWS\system32\kernel32.dll C:\WINDOWS\system32\ADVAPI32.dll C:\WINDOWS\system32\RPCRT4.dll C:\WINDOWS\system32\MSVCRT.dll c:\jdk1.5\jre\bin\client\jvm.dll C:\WINDOWS\system32\USER32.dll C:\WINDOWS\system32\GDI32.dll C:\WINDOWS\System32\WINMM.dll c:\jdk1.5\jre\bin\hpi.dll C:\WINDOWS\System32\PSAPI.DLL c:\jdk1.5\jre\bin\verify.dll c:\jdk1.5\jre\bin\java.dll c:\jdk1.5\jre\bin\zip.dll C:\bugs\crash2\App.dll
Note that the format is different from the Linux example. On Windows the output is the load and end address of each loaded module. After the list of libraries are the VM arguments (in this case the arguments were “NativeSEGV 2”) and the environment variables. VM Arguments: java_command: NativeSEGV 2 Environment Variables: JAVA_HOME=/h/jdk PATH=/h/jdk/bin:.:/h/bin:/usr/bin:/usr/X11R6/bin:/usr/local/bin:/usr/dist/local/e xe:/usr/dist/exe:/bin:/usr/sbin:/usr/ccs/bin:/usr/ucb:/usr/bsd:/usr/etc:/etc:/usr /dt/bin:/usr/openwin/bin:/usr/sbin:/sbin:/h:/net/prt-web/prt/bin USERNAME=user LD_LIBRARY_PATH=/h/jdk1.5/jre/lib/i386/client:/h/jdk1.5/jre/lib/i386:/h/jdk1.5/jr e/../lib/i386:/h/bugs/NativeSEGV
88
SHELL=/bin/tcsh DISPLAY=:0.0 HOSTTYPE=i386-linux OSTYPE=linux ARCH=Linux MACHTYPE=i386
Note that the environment list is not the full list of environment variables but rather the sub-set of the environment variables that are applicable to the JVM.
2.2.1.4 System The final section in the error log is the system information. The output is operating system specific but in general includes the operating system version, CPU information, and summary information about the memory configuration. Here is an example from a Windows XP system : ---------------
S Y S T E M
---------------
OS: Windows XP Build 2600 Service Pack 1 CPU:total 1 family 6, cmov, cx8, fxsr, mmx, sse, sse2 Memory: 4k page, physical 1047024k(564864k free), swap 2520436k(2038092k free) vm_info: Java HotSpot(TM) Client VM (1.5.0-beta3-b61) for windows-x86, built on Aug 2 2004 02:43:02 by "java_re" with MS VC++ 6.0
Here is an example from a Solaris 9 system : --------------OS:
S Y S T E M
---------------
Solaris 9 12/03 s9s_u5wos_08b SPARC Copyright 2003 Sun Microsystems, Inc. All Rights Reserved. Use is subject to license terms. Assembled 21 November 2003
uname:SunOS 5.9 Generic_112233-10 sun4u (T2 libthread) rlimit: STACK 8192k, CORE infinity, NOFILE 65536, AS infinity load average:0.41 0.14 0.09 CPU:total 2 has_v8, has_v9, has_vis1, has_vis2, is_ultra3 Memory: 8k page, physical 2097152k(1394472k free) vm_info: Java HotSpot(TM) Client VM (1.5-internal) for solaris-sparc, built on Aug 12 2004 10:22:32 by unknown with unknown Workshop:0x550
89
On Solaris and Linux the operating system information obtained by reading /etc/*release. In general it tells you the kind of system the application is running on, and in some cases the information string may include patch level. Some system upgrades are not reflected in the /etc/*release file. This is especially true on Linux where the user can rebuild any part of the system. On Solaris the uname system call is used to get the name for the kernel, and the thread library (T1 or T2 – see section 2.3.3) is also printed. On Linux the uname system call is also used to get the kernel name, and is printed along with the libc version and the thread library type.
uname:Linux 2.4.18-3smp #1 SMP Thu Apr 18 07:27:31 EDT 2002 i686 libc:glibc 2.2.5 stable linuxthreads (floating stack) |||
On Linux there are three possible thread types, namely linuxthreads (fixed stack), linuxthreads (floating stack) and NPTL. They are normally installed in /lib, /lib/i686 and/or /lib/tls. The following should be noted : •
Knowing the thread type is useful – for example if the crash appears to be related to pthread, then you may be able to workaround an issue by selecting a different pthread library. A different pthread library (and libc) can be selected by setting LD_LIBRARY_PATH or LD_ASSUME_KERNEL.
•
glibc version usually does not include the patch level. "rpm -q glibc" may give more detailed version information.
On Solaris and Linux this is followed by rlimit information. Note that the default stack size of the VM is usually smaller than the system limit.
rlimit: STACK 8192k, CORE 0k, NPROC 4092, NOFILE 1024, AS infinity | | | | + virtual memory (-v) | | | +--- max open files (ulimit -n) | | +----------- max user processes (ulimit -u) | +------------------------- core dump size (ulimit -c) +---------------------------------------- stack size (ulimit -s) load average:0.04 0.05 0.02
The CPU information details the CPU architecture and capabilities identified by the VM at start-up. CPU:total 2 family 6, cmov, cx8, fxsr, mmx, sse | | || | |
90
| +--- processor family (IA32 only): | 3 - i386 | 4 - i486 | 5 - Pentium | 6 - PentiumPro, PII, PIII | 15 - Pentium 4 +------------ Total number of CPUs
On SPARC the possible CPU features are : has_v8 has_v9 has_vis1 has_vis2 is_ultra3 no-muldiv no-fsmuld
supports v8 instructions supports v9 instructions supports visualization instructions supports visualization instructions UltraSparc III No hardware integer multiply and divide No multiply-add and multiply-subtract instructions
On Intel/IA32 the possible CPU features are : cmov cx8 fxsr mmx sse sse2 ht
supports supports supports supports supports supports supports
cmov instruction cmpxchg8b instruction fxsave/fxrstor MMX SSE extensions SSE2 extensions Hyper-Threading Technology
On AMD64/EM64T the possible CPU features are : amd64 em64t 3dnow ht
AMD Opteron, Athlon64, .. Intel EM64T processor Support 3DNow extension Support Hyper-Threading Technology
After the CPU information is the memory information : unused swap space total amount of swap space | unused physical memory | | total amount of physical memory | | | page size | | | | v v v v v Memory: 4k page, physical 513604k(11228k free), swap 530104k(497504k free)
Notes: •
Some systems require swap space to be at lease twice the size of real physical memory, others don't care. But in general if both physical memory and swap space are almost full, there's good reason to suspect the crash was due to running out of memory.
•
On Linux systems the kernel may convert most of unused physical memory to file cache. When there is a need for more memory, the Linux kernel will give the cache memory back to 91
the application. This is handled transparently by the kernel, but it does mean the amount of unused physical memory reported by fatal error handler could be close 0 when there is still plenty of physical memory available. The final item in the SYSTEM section is “vm_info”. This is a version string embedded in libjvm.so/jvm.dll. Every JVM has its own unique vm_info string. When you are in doubt about whether the hs_err*.log was generated by a particular JVM, check the version string.
92
2.2.2 Sample Crashes This section presents a number of examples which demonstrate how the error log can be used to suggest the cause of a crash. 2.2.2.1 Crash in Native Code If the fatal error log indicates the crash was in a native library there may be a bug in native/JNI library code. The crash could of course be caused by something else but analysis of the library and any core file/crash dump is a good starting place. For example, consider the following extract from the header of a fatal error log : # # # # # # # #
An unexpected error has been detected by HotSpot Virtual Machine: SIGSEGV (0xb) at pc=0x417789d7, pid=21139, tid=1024 Java VM: Java HotSpot(TM) Server VM (1.5.0-beta2-b63 mixed mode) Problematic frame: C [libApplication.so+0x9d7]
# In this case a SIGSEGV arose with a thread executing in the library libApplication.so. In some cases a bug in a native library manifests itself as a crash in VM code. Consider the following crash where a JavaThread crashes while in the “_thread_in_vm” state (meaning that it is executing in VM code) : # # # # # # # # #
An unexpected error has been detected by HotSpot Virtual Machine: EXCEPTION_ACCESS_VIOLATION (0xc0000005) at pc=0x08083d77, pid=3700, tid=2896 Java VM: Java HotSpot(TM) Client VM (1.5-internal mixed mode) Problematic frame: V [jvm.dll+0x83d77]
---------------
T H R E A D
---------------
Current thread (0x00036960): JavaThread "main" [_thread_in_vm, id=2896] : Stack: [0x00040000,0x00080000), sp=0x0007f9f8, free space=254k Native frames: (J=compiled Java code, j=interpreted, Vv=VM code, C=native code) V [jvm.dll+0x83d77] C [App.dll+0x1047] current thread ) 0x00229930 JavaThread "Low Memory Detector" daemon [_thread_blocked, id=21] =>0x001e9350 JavaThread "CompilerThread1" daemon [_thread_in_vm, id=20] :
In this case there are two potential workarounds : 1. The brute force approach: change the configuration so that the application is run with the -client option to specify the HotSpot Client VM. 2. Assume that the bug only arises when compiling the setPriority method and exclude this method from compilation. The first approach (to use the -client option) may be trivial to configure in some envrionments. In others, it may be more complex because the configuration may be complex or the command line to configure the VM may not be readily accessible. In general, switching from the HotSpot Server VM to the HotSpot Client VM will also reduce the peak performance of an application. Depending on the environment, this may be acceptable until the actual issue is diagnosed and fixed. The second approach (exclude the method from compilation) requires creating the file “.hotspot_compiler” in the working directory of the application. Following is an example file: exclude
java/lang/Thread
setPriority
In general the format of this file is “exclude CLASS METHOD” where “CLASS” is the class (fully qualified with the package name) and “METHOD” is the name of the method. Constructor methods are specified as “” and static initializers are specified as “”. 97
Note: The .hotspot_compiler file is an unsupported interface. It is documented here soley for the purposes of troubleshooting and finding a temporary workaround. Once the application is restarted the compiler will not attempt to compile any of the methods listed as excluded in the .hotspot_compiler file. In some cases this will provide temporary relief until the root cause of the crash is diagnosed and the bug fixed.
2.2.3.2 Crash during Garbage Collection If a crash arises during garbage collection then it will normally be reported in the fatal error log that a VM_Operation is in progress9. The VM_Operation is shown in the THREAD section of the log and will indicate one of the following : • • • • •
generation collection for allocation full generation collection parallel gc failed allocation parallel gc failed permanent allocation parallel gc system gc
Most likely the current thread reported in the log is the VMThread – this is the special thread used to execute special tasks in the HotSpot VM. The following fragment shows an example of how a crash in the serial garbage collector might look :
---------------
T H R E A D
Current thread (0x002cb720):
--------------VMThread [id=3252]
siginfo: ExceptionCode=0xc0000005, reading address 0x00000000 Registers: EAX=0x0000000a, EBX=0x00000001, ECX=0x00289530, EDX=0x00000000 ESP=0x02aefc2c, EBP=0x02aefc44, ESI=0x00289530, EDI=0x00289530 EIP=0x0806d17a, EFLAGS=0x00010246 Top of Stack: 0x02aefc2c: 0x02aefc3c: 0x02aefc4c: 0x02aefc5c: 0x02aefc6c: 0x02aefc7c: 0x02aefc8c: 0x02aefc9c:
(sp=0x02aefc2c) 00289530 081641e8 00000001 00000000 081641e8 081641c8 00000000 00000000 00000000 00000000 00000000 00000000 00035378 00280d88 02aefce8 0806e0f5
00000001 02aefc9c 00000001 00000001 00000000 00000000 00280d88 00000001
0806e4b8 0806e4c5 00289530 00000001 08072a9e 00035378 147fee00 00289530
Instructions: (pc=0x0806d17a) 0x0806d16a: 15 08 83 3d c0 be 15 08 05 53 56 57 8b f1 75 0f 0x0806d17a: 0f be 05 00 00 00 00 83 c0 05 a3 c0 be 15 08 8b
9 For the purposes of this discussion we assume the mostly concurrent GC (-XX:+UseConcMarkSweep) is not in use.
98
Stack: [0x02ab0000,0x02af0000), sp=0x02aefc2c, free space=255k Native frames: (J=compiled Java code, j=interpreted, Vv=VM code, C=native code) V [jvm.dll+0x6d17a] V [jvm.dll+0x6e4c5] V [jvm.dll+0x6e0f5] V [jvm.dll+0x71771] V [jvm.dll+0xfd1d3] V [jvm.dll+0x6cd99] V [jvm.dll+0x504bf] V [jvm.dll+0x6cf4b] V [jvm.dll+0x1175d5] V [jvm.dll+0x1170a0] V [jvm.dll+0x11728f] V [jvm.dll+0x116fd5] C [MSVCRT.dll+0x27fb8] C [kernel32.dll+0x1d33b] VM_Operation (0x0373f71c): generation collection for allocation, mode: safepoint, requested by thread 0x02db7108
It is important to stress that a crash during garbage collection does not imply a bug in the garbage collection implementation. It is equally possible that the issue is in another area (such as a compiler or runtime bug). There are several things to try if you get a repeated crash during garbage collection : 1. Switch GC configuration: For example if you are using the the serial collector then try the throughput collector (or visa versa). 2. If you are using the HotSpot Server VM, try the HotSpot Client VM. If you are not sure which garbage collector is in use then you can use the jmap utility on Solaris and Linux to obtain the heap information from the core file (assuming that the core file is available). In general if the GC configuration is not specified on the command line then the serial collector will be used on Windows. On Solaris and Linux it depends on the machine configuration. If the machine has >= 2GB of memory and has >= 2 processors then the through-put collector (Parallel GC) will be used. For smaller machines the serial collector is the default. The option to select the serial collector is -XX :+UseSerialGC and the option to select the through-put collector is -XX:+UseParallelGC. If, as a workaround, you switch from the through-put collector to the serial collector then you may experience some performance degradation on multi-processor systems. This may be acceptable until the root issue is diagnosed and resolved. 2.2.3.3 Class Data Sharing Class data sharing is a new feature in J2SE 5.0. When the JRE is installed on 32-bit platforms using the Sun provided installer, the installer loads a set of classes from the system jar file into a private internal representation and dumps that representation to a file called a shared archive. When the VM is started the shared archive is memory-mapped in. This saves on class loading and allows much of the metadata associated with the classes to be shared across multiple VM instances. In J2SE 5.0, class 99
data sharing is only enabled when the HotSpot Client VM is used. In addition sharing is only supported with the serial garbage collector. The fatal error log will print the version string in the header of the log. If sharing is enabled it should be obvious as shown in the following example : # # # # # # # # #
An unexpected error has been detected by HotSpot Virtual Machine: EXCEPTION_ACCESS_VIOLATION (0xc0000005) at pc=0x08083d77, pid=3572, tid=784 Java VM: Java HotSpot(TM) Client VM (1.5-internal mixed mode, sharing) Problematic frame: V [jvm.dll+0x83d77]
Although the sharing feature was thoroughly tested for 5.0 it may be possible that a crash stems from this new feature. Sharing can be disabled by providing the -Xshare:off option on the command line. If the crash cannot be duplicated with sharing disabled but can be duplicated with sharing enabled then it is possible that you have encountered a bug. In that case gather as much information as possible and submit a bug.
2.2.4 Visual C++ Version JDK5.0 is compiled on Windows using Microsoft Visual C++ 6.0 Service Pack 3. This is an old but stable release of the compiler. If you experience a crash with a J2SE-based application and if you have native/JNI libraries that are compiled with a newer release of the compiler (VC.++ NET 2002 or VC++ .NET 2003 for example) then you need to be aware of compatibility issues between the 6.0 and newer runtimes. Specifically, you only have a supported environment if you follow the Microsoft guidelines when dealing with multiple runtimes. For example, if you allocate memory using one runtime then you must release it using the same runtime. Unpredictable behavior or crashes can arise if you release a resource using a different library than the one that allocated it.
100
2.3 Hangs and Looping Processes Issues may arise involving hangs or looping processes. A hang can arise for many reasons but often stems from a deadlock in application code, API/library code, or even a bug in the HotSpot Virtual Machine. Sometimes an apparent hang turns out not to be a hang but rather that the VM process is consuming all available CPU cycles – most likely caused by a bug that causes one or more threads to go into an infinite loop. An initial step when diagnosing a hang is to find out if the VM process is idle or consuming all available CPU cycles. To do this requires using an operating system utility. If the process appears to be busy and is consuming all available CPU cycles then it is likely that the issue is a looping thread rather than a deadlock. On Solaris, for example, prstat -L -p can be used to report the statistics for all LWPs in the target process and thus will identify the thread(s) that are consuming a lot of CPU cycles.
2.3.1 Diagnosing a Looping Process If a VM process appears to be looping then the first step is to try and get a thread dump. If a thread dump can be obtained it will often be clear which thread is looping. If the looping thread can be identified then the trace stack in the thread dump should provide direction on where (and maybe why) the thread is looping. If the application console (standard input/output) is available then pressing the Ctrl-\ or Ctrl-Break keys (depending on platform) will result in the HotSpot VM printing a thread dump. On Solaris and Linux the thread dump can also be obtained by sending a SIGQUIT to the process (kill -QUIT ). In this case the thread dump will be printed to the standard output of the target process (which may be directed to a file depending on how it was started). If a thread dump can be obtained then a good place to start is the thread stacks of the threads that are in the runnable state. Section 1.16 provides information on the format of the thread dump and includes a table of the possible thread states in the thread dump. In some cases it may be necessary to get a sequence of thread dumps in order to determine which threads appear to be continuously busy. If the application console is not available (process is running as a background process, or the VM output is directed to an unknown location) then the jstack utility on Solaris or Linux can be used to obtain the stack thread. Section 1.4 provides information on the output of the jstack utility. The jstack utility should also be used if the thread dump does not provide any evidence that a java thread is looping. When reviewing the output of jstack utility it is best to initially focus on the threads that are in the IN_JAVA, IN_NATIVE or IN_VM states. These are the most likely states for threads that are busy and likely to be looping. It may be necessary to execute jstack a number of times to get a more complete picture of which threads are looping. If a thread appears to be always in the IN_VM state then the -m option can be used to print the native frames and may provide a further hint on what the thread is doing. If a thread appears to be looping continuously while in the IN_VM state this may indicate a potential HotSpot VM bug that needs further investigation. If the VM does not respond to a Ctrl-\ this may suggest a possible VM bug rather than an issue with 101
application or library code. In this case use jstack with the -m option to get a thread stack for all threads. The output will include the thread stacks for VM internal threads. In this stack trace the focus should be to identify threads that do not appear to be waiting (for example on Solaris you would identify the threads that are not in functions such as __lwp_cond_wait, __lwp_park, ___pollsys, or other blocking functions). If it appears that the looping is caused by a VM bug then it is important to collect as much data as possible and submit a bug. See chapter 3, page 112 for more details on data collection.
2.3.2 Diagnosing a Hung Process If the application appears to be hung and the process appears to be idle then the first step is to try to obtain a thread dump. If the application console is available then pressing the Ctrl-\ or Ctrl-Break keys (depending on platform) will result in the HotSpot VM printing a thread dump. On Solaris and Linux the thread dump can also be obtained by sending a SIGQUIT to the process (kill -QUIT ). Deadlock Found If the hung process is capable of generating a thread dump then the output will be printed to standard output of the target process. After printing the thread dump the HotSpot VM also executes a deadlock detection algorithm. If a deadlock is detected it will be printed along with the stack trace of the threads involved in the deadlock. Here is a sample deadlock to demonstrate how the output will appear : Found one Java-level deadlock: ============================= "AWT-EventQueue-0": waiting to lock monitor 0x000ffbf8 (object 0xf0c30560, a java.awt.Component$AWTTreeLock), which is held by "main" "main": waiting to lock monitor 0x000ffe38 (object 0xf0c41ec8, a java.util.Vector), which is held by "AWT-EventQueue-0" Java stack information for the threads listed above: =================================================== "AWT-EventQueue-0": at java.awt.Container.removeNotify(Container.java:2503) - waiting to lock (a java.awt.Component$AWTTreeLock) at java.awt.Window$1DisposeAction.run(Window.java:604) at java.awt.Window.doDispose(Window.java:617) at java.awt.Dialog.doDispose(Dialog.java:625) at java.awt.Window.dispose(Window.java:574) at java.awt.Window.disposeImpl(Window.java:584) at java.awt.Window$1DisposeAction.run(Window.java:598) - locked (a java.util.Vector) at java.awt.Window.doDispose(Window.java:617) at java.awt.Window.dispose(Window.java:574) at javax.swing.SwingUtilities$SharedOwnerFrame.dispose(SwingUtilities.java:1743) at javax.swing.SwingUtilities$SharedOwnerFrame.windowClosed(SwingUtilities.java:172 2) at java.awt.Window.processWindowEvent(Window.java:1173) at javax.swing.JDialog.processWindowEvent(JDialog.java:407) at java.awt.Window.processEvent(Window.java:1128)
102
at java.awt.Component.dispatchEventImpl(Component.java:3922) at java.awt.Container.dispatchEventImpl(Container.java:2009) at java.awt.Window.dispatchEventImpl(Window.java:1746) at java.awt.Component.dispatchEvent(Component.java:3770) at java.awt.EventQueue.dispatchEvent(EventQueue.java:463) at java.awt.EventDispatchThread.pumpOneEventForHierarchy(EventDispatchThread.java:2 14) at java.awt.EventDispatchThread.pumpEventsForHierarchy(EventDispatchThread.java:163 ) at java.awt.EventDispatchThread.pumpEvents(EventDispatchThread.java:157) at java.awt.EventDispatchThread.pumpEvents(EventDispatchThread.java:149) at java.awt.EventDispatchThread.run(EventDispatchThread.java:110) "main": at java.awt.Window.getOwnedWindows(Window.java:844) - waiting to lock (a java.util.Vector) at javax.swing.SwingUtilities$SharedOwnerFrame.installListeners(SwingUtilities.java :1697) at javax.swing.SwingUtilities$SharedOwnerFrame.addNotify(SwingUtilities.java:1690) at java.awt.Dialog.addNotify(Dialog.java:370) - locked (a java.awt.Component$AWTTreeLock) at java.awt.Dialog.conditionalShow(Dialog.java:441) - locked (a java.awt.Component$AWTTreeLock) at java.awt.Dialog.show(Dialog.java:499) at java.awt.Component.show(Component.java:1287) at java.awt.Component.setVisible(Component.java:1242) at test01.main(test01.java:10) Found 1 deadlock.
In J2SE 5.0 deadlock detection works only with locks that are obtained using the synchronized keyword. This means that deadlocks that arise through the use of the java.util.concurrency package are not detected. If the deadlock detection algorithm detects a deadlock then it is necessary to examine the output in more detail so that the deadlock can be understood. In the above example we see that thread “main” is locking object and is waiting to enter which is locked by thread “AWT-EventQueue-0”. But, thread “AWT-EventQueue-0” is waiting to enter that is locked by “main”. The detail in the stack traces should provide information to suggest where the deadlock is. No Deadlock Found If the thread dump is printed and no deadlocks are found (and you know that the application or its libraries do not use the concurrency package) then the issue may be a bug whereby a thread waiting on a monitor is never notified. This could be a timing issue or a general logic bug. To find out more about the issue, you need to examine each of the threads in the thread dump and examine each thread that is blocked in Object.wait(). The caller frame in the stack trace should indicate the class and method that is invoking the wait() method. If the code was compiled with line number information (the default) then this provides direction as to the code to examine. In most cases 103
some knowledge of the application logic or library is required to diagnose this issue further. In general you will need to understand how the synchronization works in the application and in particular the details and conditions for when and where monitors are notified. No Thread Dump If the VM does not respond to a Ctrl-\ or Ctrl-Break then it is possible that the VM may be deadlocked or hung for some other reason. In that case use the jstack utility to obtain a thread dump. This also applies in the case where the application is not accessible or the output is directed to an unknown location. With the jstack output examine each of the threads in the BLOCKED state. The top frame can sometimes indicate why the thread is blocked (Object.wait, or Thread.sleep for example), and the rest of the stack should give an indication as to what the thread is doing. This is particularly true when the source has been compiled with line number information (the default) and you can cross reference the source code. If a thread is BLOCKED and the reason is not clear then use the -m option to get a mixed stack. With the mixed stack output, it should be possible to identify why the thread is blocked. If a thread is blocked trying to enter a synchronized method or block then you will see frames like ObjectMonitor::enter near the top of the stack. Following is an example : ----------------- t@13 ----------------0xff31e8b8 ___lwp_cond_wait + 0x4 0xfea8c810 void ObjectMonitor::EnterI(Thread*) + 0x2b8 0xfeac86b8 void ObjectMonitor::enter2(Thread*) + 0x250 : :
Threads in the IN_NATIVE state may also be blocked. The top most frames in the mixed stack should indicate what the thread is doing. The other thread states that jstack can report are the IN_JAVA or IN_VM states. Threads in the IN_JAVA state are executing java code. Threads the IN_VM state are executing in the VM code – the mixed stack option should help indicate what the thread is doing. One specific thread to check is VMThread. This is the special thread used to execute operations like garbage collection. It can be identified as the thread that is executing VMThread::run() in its initial frames. On Solaris it is typically “t@4”. On Linux it should be identifiable using the C++ mangled name “_ZN8VMThread4loopEv”. In general the VM thread is in one of 3 states: waiting to execute a VM operation, synchronizing all threads in preparation for a VM operation, or executing a VM operation. If you suspect that a hang is a HotSpot VM bug rather than an application or class library deadlock then pay special attention to the VM thread. If the VM thread appears to be stuck in SafepointSynchronize::begin then this could indicate an issue bringing the VM to a safepoint10. If the thread appears to to be stuck in where ends in “doit” then this could also indicate a VM problem. In general, if you can execute the application from the command line, and you get to a state where the 10 A safepoint indicates that all threads executing in the VM are blocked and waiting for a special operation, such as garbage collection, to complete.
104
VM does not respond to a Ctrl-\ or Ctrl-Break it is more likely that you have uncovered a VM bug, a thread library issue, or a bug in another library. If this arises it is best to obtain a crash dump (see section 3.2 for instructions on how to do this), gather as much information as possible, and submit a bug or support call. One other tool to mention in the context of hung processes is the pstack utility on Solaris. On Solaris 8 and 9 it prints the thread stacks for LWPs in the target process. On Solaris 10 and JDK5.0 the output of pstack is similar (though not identical) to the output from jstack -m. As with jstack, the Solaris 10 implementation of pstack prints the fully qualified class name, method name, and bci. It will also print line numbers for the cases where the source was compiled with line number information (the default). This is useful for developers and administrators who are used to pstack and the other proc utilities on Solaris. The equivalent tool of pstack on Linux is lsstack (included in some distributions; otherwise obtained from the sourceforge.net web site). At the time of this writing, lsstack reported native frames only.
2.3.3 Solaris 8 Thread Library The default thread library on Solaris 8 is often referred to as the T1 library. This thread library implemented the m:n threading model where m user threads are mapped to n kernel-level threads (LWPs). Solaris 8 also shipped with an alternative and newer thread library in /usr/lib/lwp. The alternative thread library is often referred to as the T2 library and it became the default thread library in Solaris 9 and 10. In older releases of J2SE (pre-1.4.0 in particular) there were a number of issues with the default thread library. In some cases the issues were bugs in the thread library, in other cases the issues related to LWP synchronization or LWP starvation (a scenario that arises when there are user threads in the runnable state but there aren't any kernel level threads available). Although the issues cited are historical, it should be noted that when JDK5.0 is deployed on Solaris 8 it still uses the T1 library by default. LWP starvation type issues do not arise because JDK5.0 uses “bound threads” so that each user thread is bound to a kernel thread. However in the event that you encounter an issue, such as a hang, which you believe is a thread library issue then you can instruct the HotSpot VM to use the T2 library by adding /usr/lib/lwp to the LD_LIBRARY_PATH. To check if the T2 library is in use then the “pldd ” command can be used to list the libraries loaded by the specified process.
105
2.4 Signal Handling Sometimes developers have to integrate J2SE applications with code that uses signal or exception handlers. This section provides information on how signals are handled in the HotSpot Virtual Machine. It also describes the signal chaining facility that facilitates applications that need to install their own signal handlers. This facility is available on Solaris and Linux.
2.4.1 Signal Handling on Solaris and Linux The HotSpot Virtual Machine installs signal handlers to implement various features and to handle fatal error conditions. For example, an optimization to avoid explicit null checks in cases where java.lang.NullPointerException will be thrown rarely, is implemented using the SIGSEGV signal. In this case, the SIGSEGV signal is caught, handled, and the NullPointerException is thrown. In general there are two categories of situations where signal/traps arise: 1. Situations where signals are expected and handled – Examples include the implict null handling cited above. Another example is the safepoint polling mechanism which protects a page in memory when a safepoint is required. Any thread that accesses that page causes a SIGSEGV which results in the execution of a stub that brings the thread to a safepoint. 2. Unexpected signals – This includes a SIGSEGV when executing in VM or JNI/native code. In these cases the signal is unexpected, so fatal error handling is invoked to create the error log and terminate the process. The following table lists the signals currently used on Solaris and Linux : Signal
Usage
SIGSEGV, SIGBUS, SIGFPE, SIGPIPE, SIGILL
Used in the implementation for things like implicit null check, and others.
SIGQUIT
Thread dump support: To dump Java stack traces at the standard error stream. (optional)
SIGTERM, SIGINT, SIGHUP
Used to support the shutdown hook mechanism (java.lang.Runtime.addShutdownHook) when the VM is terminated abnormally. (optional)
SIGUSR1
Used in the implementation of the java.lang.Thread.interrupt method. (configurable). Not used on Solaris 10 or greater. Reserved on Linux.
SIGUSR2
Used internally. (configurable). Not used on Solaris 10 or greater.
106
Signal SIGABRT
Usage The HotSpot VM doees not handle this signal. Instead it calls the abort function after fatal error handling. If an application uses this signal then it should terminate the process to preserve the expected semantics.
2.4.1.1 Reducing Signal Usage The -Xrs option instructs the HotSpot VM to reduce its signal usage. The option results in fewer signals being used although the VM still installs its own signal handler for essential signals such as SIGSEGV. In the previous table the signals tagged as optional are not used when the -Xrs option is specified. Note that the option means that the shutdown hook mechanism will not execute if the process receives a SIGTERM, SIGINT, or SIGHUP. Shutdown hooks will execute, as expected, if the VM terminates normally (last non-daemon thread complets or the System.exit method is used).
2.4.1.2 Alternative Signals On Solaris 8 and 9 the -XX:+UseAltSigs option can be used to instruct the HotSpot VM to use alternative signals to SIGUSR1 and SIGUSR2. On Solaris 10 or greater this option is ignored, as the operating system reserves two additional signals (called SIGJVM1 and SIGJVM2). On Linux the handler for SIGUSR1 cannot be overridden. SIGUSR2 is used to implement suspend and resume. However it is possible to specify an alternative signal to be used instead of SIGUSR2. This is done by specifying the _JAVA_SR_SIGNUM environment variable. If this environment variable is set, it must be set to a value larger than the maximum of SIGSEGV and SIGBUS.
2.4.1.3 Signal Chaining If an application with native code requires it own signal handlers then it may need to be used with the signal chaining facility. The signal chaining facility offers : 1. Support for pre-installed signal handlers when the HotSpot VM is created. 2. Support for signal handler installation after the HotSpot VM is created, inside JNI code or from another native thread. Pre-installed signal handlers (1.) are supported by means of saving existing signal handlers, for signals that are used by the VM, when the VM is first created. Later, when any of these signals are raised and found not to be targeted at the Java HotSpot VM, the pre-installed handlers are invoked. In other words, pre-installed handlers are "chained" behind the VM handlers for these signals. The signal-chaining facility also allows an application to link and load the libjsig.so shared 107
library before libc/libthread/libpthread. This library ensures that calls such as signal(), sigset(), and sigaction() are intercepted so that they do not actually replace the Java HotSpot VM's signal handlers if the handlers conflict with those already installed by the Java HotSpot VM (2.). Instead, these calls save the new signal handlers, or "chain" them behind the VMinstalled handlers. Later, when any of these signals are raised and found not to be targeted at the Java HotSpot VM, the pre-installed handlers are invoked. libjsig.so is not needed if (2.) is not required. To use libjsig.so, either link it with the application that creates/embeds a HotSpot VM, for example: cc -L -ljsig -ljvm java_application.c
or use the LD_PRELOAD environment variable, for example: export LD_PRELOAD=/libjsig.so; java_application(ksh) setenv LD_PRELOAD /libjsig.so; java_application(csh)
The interposed signal()/sigset()/sigaction() return the saved signal handlers, not the signal handlers installed by the Java HotSpot VM and which are seen by the OS. Note that the SIGUSR1 signal cannot be chained. If an application attempts to chain this signal on Solaris then the HotSpot VM will terminate with the fatal error: “Signal chaining detected for VM interrupt signal, try -XX:+UseAltSigs”. In addition the SIGQUIT, SIGTERM, SIGINT and SIGHUP signals cannot be chained. If the application needs to handle these signals then the -Xrs option should be considered. On Solaris, the SIGUSR2 signal can be chained but only for non-Java and non-VM threads; that is, it can only be used for native threads created by the application that do not attach to the virtual machine.
2.4.2 Exception Handling on Windows On Windows, an exception is an event that occurs during the execution of a program. There are two kinds of exceptions: hardware exceptions and software exceptions. Hardware exceptions are comparable to signals such as SIGSEGV and SIGILL on Solaris and Linux. Software exceptions are initiated explicitly by applications or the operating system using the RaiseException() API. On Windows, the mechanism for handling both hardware and software execptions is called Structured Exception Handling (SEH). This is stack frame-based exception handling similar to the C++, Java exception handling mechanism. In C++ the __try and __except keywords are used to guard a section of code that may result in an exception : __try { // guarded body of code } __except (filter-expression) { // exception-handler block } 108
The __except block is filtered by a filter expression that uses exception code (integer code returned by GetExceptionCode() API) and/or exception information (GetExceptionInformation() API). The filter expression should evaluate to one of the following values: 1. EXCEPTION_CONTINUE_EXECUTION = -1 The filter expression has repaired the situation and execution continues where the exception occurred. Unlike some exception schemes, SEH supports the resumption model as well. This is much like Unix signal handling in the sense that after the signal handler finishes, the execution continues where the program was interrupted. The difference is that the handler in this case is just the filter expression itself and not the __except block. But, the filter expression may involve a function call as well. 2. EXCEPTION_CONTINUE_SEARCH = 0 The current handler can't handle this exception. Continue the handler search for a next handler. This is similar to the catch block not matching an exception type in C++, Java. 3. EXCEPTION_EXECUTE_HANDLER = 1 The current handler matches and can handle the exception. The __except block is executed. The __try and __finally keywords are used to construct a termination handler as shown below. __try { // guarded body of code } __finally { // __finally block } When control leaves the __try block (after exception or without exception), the __finally block is executed. Inside the __finally block, the AbnormalTermination() API may be called to test whether control continued after the exception or not. Windows programs may also install a top level unhandled exception filter function to catch exceptions that are not handled in a __try/__except on a process-wide basis using the SetUnhandledExceptionFilter() API. If there is no handler for an exception, then UnhandledExceptionFilter() is called and this will call the top level unhandled exception filter function, if any, to catch that exception. This function also shows a message box to notify the user about the unhandled exception. Windows exceptions are comparable to Unix synchronous signals that are attributable to the current execution stream. In Windows, asynchronous events such as console events (such as the user pressing Ctrl-C at the console) are handled by the console control handler registered using the SetConsoleCtlHandler() API. If an application uses the signal() API on Windows, then the C runtime library (CRT) maps both 109
Windows exceptions and console events to appropriate signals or C runtime errors. For example, CRT maps Ctrl-C to SIGINT and all other console events to SIGBREAK. Similarly, if you register the SIGSEGV handler, the C runtime library translates the corresponding exception to a signal. CRT library startup code implements a __try/__except block around the main() function. CRT's exception filter function (named _XcptFilter) maps the Win32 exceptions to signals and dispatches signals to their appropriate handlers. If a signal's handler is set to SIG_DFL (default handling), _XcptFilter calls the UnhandledExceptionFilter. With Windows XP or Windows 2003, the new vectored exception handling mechanism may also be used. Vectored handlers are not frame-based handlers. A program may register zero or more vectored exception handlers using AddVectoredExceptionHandler API. Vectored handlers are invoked before invoking structured exception handlers, if any, regardless of where the exception actually occurred. Vectored exception handler may return: 1. EXCEPTION_CONTINUE_EXECUTION to skip next vectored and SEH handlers or 2. EXCEPTION_CONTINUE_SEARCH to continue next vectored or SEH handler. Refer to the Microsoft web site (http://www.microsoft.com) for further information on Windows exception handling. 2.4.2.1 Signal Handling in the HotSpot Virtual Machine The HotSpot Virtual Machine installs a top level exception handler using the SetUnhandledExceptionFilter (or the AddVectoredExceptionHandler API for 64-bit) API during VM initialization. It also installs win32 SEH using a __try / __except around the thread (internal) start function call for each thread created. And, finally it installs an exception handler around JNI functions. If an application wishes to handle structured exceptions in JNI code, it can use __try / __except statements. But, if it must use the vectored exception handler in JNI code then the handler must return EXCEPTION_CONTINUE_SEARCH to continue to the VMs exception handler. In general, there are two categories of situations in which exceptions arise : 1. Situations where signals are expected and handled – Examples include the implict null handling cited above where accessing a null casues an EXCEPTION_ACCESS_VIOLATION that is handled. 2. Unexpected exceptions – An example is EXCEPTION_ACCESS_VIOLATION when executing in VM or JNI/native code. In these cases the signal is unexpected, and fatal error handling is invoked to create the error log and terminate the process. 2.4.2.2 Console Handlers The HotSpot Virtual Machine registers console events as shown in the following table:
110
Console event
Signal
Usage
CTRL_C_EVENT
SIGINT
Terminate process.(optional)
CTRL_CLOSE_EVENT
SIGTERM
Used by the shutdown hook mechansim when the VM is terminated abnormally.(optional)
SIGBREAK
Thread dump support: To dump Java stack traces at the standard error stream. (optional)
CTRL_LOGOFF_EVENT CTRL_SHUTDOWN_EVENT CTRL_BREAK_EVENT
If an application must register its own console handler then the -Xrs option can be used. With this option, shutdown hools are not run on SIGTERM (with above mapping of events) and thread dump support is not available on SIGBREAK (with above mapping Ctrl-Break event).
111
3 Submitting Bug Reports This chapter provides guidance on how to submit a bug report. It includes suggestions about what to try before submitting a report and what data to collect for the report. J2SE 5.0 was released in September 2004. Updates to J2SE 5.0 are scheduled for release every 3 months thereafter. These releases are called update releases and fix a set of critical bugs identified since the initial release of 5.0. When a 5.0 update release becomes available, it becomes the default 5.0 download at the following location: http://java.sun.com/j2se/1.5.0/download.jsp The download site includes release notes that list the bug fixes in the release. Each bug in the list is linked to the bug description in the bug database. The list of fixes in previous 5.0 update releases is also included in the release notes. If you encounter an issue, or suspect a bug, then you should, as an early step in the diagnosis, check the list of fixes that are available in the most recent update release. Sometimes it is not obvious if an issue is a duplicate of a bug that is already fixed, so where possible, you should test with the latest update release to see if the problem persists. In addition to testing with the latest 5.0 update release, the following provides some very general guidelines on steps to follow before submitting a bug report : 1. Collect as much relevant data as possible. For example, generate a thread-dump in the case of a deadlock, or locate the core file (where applicable) and hs_err file in the case of a crash. In all cases it is important to document the environment and the actions performed just before the problem is encountered. 2. Where applicable, try to restore the original state and reproduce the problem using the documented steps. This helps to determine if the problem is reproducible or an intermittent issue. 3. If the issue is reproducible then try to narrow down the problem. In some cases, a bug can be demonstrated with a small standalone test case. Bugs demonstrated by small test cases will typically be easy to diagnose when compared to test cases that consists of a large complex application. 4. Search the bug database to see if the bug, or similar bugs, have been reported. If the bug has already been reported, the bug report may have further information. For example, if the bug has already been fixed it will indicate the release that the bug was fixed in. The bug may also contain information such as a workaround or include comments in the evaluation that explain, in further detail, the circumstances that cause the bug to arise. The bug database is at: •
http://developer.java.sun.com/developer/bugParade/index.jshtml
5. If you conclude that the bug has not already been reported, then it is important to submit a new bug.
112
Before submitting a bug it is important to verify that the environment where the problem arises is a supported configuration. The set of supported systems configurations can be found here : http://java.sun.com/j2se/1.5.0/system-configurations.html In addition to the system configurations the list of supported locales should also be checked. The page with the list of supported locales is linked from the configuration page. In the case of the Solaris Operating System you should check the recommended patch cluster for the operating system release to ensure the recommended patches are installed. The recommended patch list can be obtained at this site : http://sunsolve.sun.com/pub-cgi/show.pl?target=patches/J2SE
3.1 Collecting Data for a Bug Report In general it is recommended to collect as much relevant data as possible when creating a bug report or submitting a support call. This section suggests the data to collect and, where applicable, it provides guidance as to the commands or general procedure required to obtain the data. The data that should be collected prior to submitting a bug report includes : •
Hardware details
•
Operating system details
•
J2SE version information
•
Command line options
•
Environment variables
•
Fatal error log (in the case of a crash)
•
Core/crash dump (in the case of a crash, and possibly a hang).
•
Detailed description of the problem including test case (where possible)
•
Logs or trace information (where applicable)
•
Results from troubleshooting steps to date
Hardware Sometimes a bug only arises, or can only be reproduced, on certain hardware configurations. If a fatal error occurs then the error log may contain the hardware details. If an error log is not available then it is important to document, in the bug report, the number and the type of processors in the machine, the clock speed, and where applicable some details on the features of that processor (if known). For example, it may be relevant that hyper-threading is available (in the case of Intel processors). 113
Operating System On Solaris, the showrev -a command prints the operating system version and patch information. On Linux, it is important to know which distribution and version is used. Sometimes the /etc/*release file indicates the release information, but as components and packages can be upgraded independently, it is not always a reliable indication of the configuration. So, in addition to the information from the *release file the following should be collected : •
The kernel version – This can be obtained using the uname -a command
•
The glibc version – The rpm -q glibc command should indicate the patch level of glibc.
•
The thread library – Linux has three possible thread types, namely linuxthreads (fixed stack), linuxthreads (floating stack) and NPTL. They are normally installed in /lib, /lib/i686 and/or /lib/tls.
On Windows, the Control Panel the General tab on the System applet indicates the operating system and service pack installed. J2SE Version The J2SE version string can be obtained using the java -version command. Following is sample output of this command: java version "1.5.0-rc" Java(TM) 2 Runtime Environment, Standard Edition (build 1.5.0-rc-b63) Java HotSpot(TM) Server VM (build 1.5.0-rc-b63, mixed mode
As multiple versions of J2SE may be installed on the same machine, it's important to ensure that the appropriate version of the java command is used. To do this, make sure that the installation bin directory appears in your PATH before other installations. Command Line Options If the bug report does not include a fatal error log then it is important to document the full command line and options. This includes any options that specify heap settings (-mx option for example), or any -XX options to specify HotSpot specific options. One of the features in J2SE 5.0 is garbage collector ergonomics. On server-class machines the java command launchs the HotSpot Server VM and parallel garbage collector. A machine is considered to be be a server machine if it has two processors and 2GB or more of memory. To be sure of the command line options, the -XX:+PrintCommandLineFlags option may be useful. If this option is provided on the command line then it will print out all command line flags to the VM. The command line options can also be obtained for a running VM or core file using the jmap utility (see section 1.3). 114
Environment Variables Sometimes problems arise due to environment variable settings. When creating the bug report you should indicate the values of the following java environment variables (if set) : JAVA_HOME, JRE_HOME, JAVA_TOOL_OPTIONS, _JAVA_OPTIONS, CLASSPATH, JAVA_COMPILER, PATH, USERNAME In addition to this list, there are operating system specific environment variables that should be collected. On Solaris and Linux the values of the following environment variables should be collected : LD_LIBRARY_PATH, LD_PRELOAD, SHELL, DISPLAY, HOSTTYPE, OSTYPE, ARCH, MACHTYPE On Linux, the values of the LD_ASSUME_KERNEL and _JAVA_SR_SIGNUM environment variables should be examined. On Windows, the values of the following environment variables should be collected : OS, PROCESSOR_IDENTIFIER, _ALT_JAVA_HOME_DIR
Fatal Error Log When a fatal error occurs an error log is created in the file hs_err_pid.log (where is the process id). The format of the error log is described in section 2.2.1. Where possible the file is created in the working directory of the process. In the event that the file cannot be created in the working directory (insufficient space, permission problem, or other issue) then the file is created in the temporary directory for the operating system. On Solaris and Linux the temporary directory is /tmp. On Windows, the temporary directory is specified by the value of the TMP environment variable, or if that is not defined, the value of the TEMP environment variable. The error log contains a lot of information obtained at the time of the fatal error. Where possible it includes version and environment information, details on the threads that provoked the crash, etc. If the fatal error log is generated then it should be included in the bug report or support call. Core/Crash Dump Core dumps can be very useful when trying to diagnose a crash or hung process. The procedure for generating a core/crash dump is described later in this chapter.
115
Description When creating a problem description the general rule is to include as much relevant information as possible. Describe the application, the environment, and most importantly the events leading up to when the problem was encountered. In addition: 1. If the problem is reproducible then list the steps required to demonstrate the problem. 2. If the problem can be demonstrated with a small test case then include the test case and the commands to compile and execute the test case. 3. If the test case or problem requires third-party code (for example a commercial or open source library or package) then provide details on where/how to obtain the library. If the problem can only be reproduced in a complex application environment then the description, coupled with logs, core file, and other relevant information may be the sole means to diagnose the issue. In these situations the description should indicate if the submitter is willing to run further diagnosis or run test binaries on the system where the issue arises. Logs/Traces Sometimes a problem can be determined quickly using log or trace output. For example in the case of a performance issue it may be possible to diagnose the problem based on the output of the -verbose:gc option (the option to enable output from the garbage collector). In other cases the output from the jstat command (section 1.7) could be used to capture statistical information over the time period leading up to the problem. In the case of a deadlock or hung VM then the thread stacks (obtained using Ctrl-\ on Solaris and Linux, or Ctrl-Break on Windows) may be used to diagnose the deadlock (or loop). In general, all relevant logs, traces and other output should be included in the bug report or support call. Results from Troubleshooting Steps It is often very useful to document any troubleshooting steps performed before submitting the bug report. For example, if the problem is a crash and the application has native libraries then you may have already run the application with -Xcheck:jni to reduce the likelihood that the bug is in the native code. Another case might be of a crash that occurs with the HotSpot Server VM (-server option). If you have also tested with the HotSpot Client VM (-client option) and the problem does not occur then this gives an indication that the bug may be specific to the HotSpot Server VM. In general the bug report should include all steps and results to date – this type of information can often reduce the time it takes to diagnose an issue.
116
3.2 Collecting Core Dumps This section explains how to generate and collect core dumps (also known as crash dumps). A core dump or a crash dump is a memory snapshot of a running process. A core dump may be automatically created by the operating system when a fatal or unhandled error occurs (an unhandled signal or system exception for example). Alternatively, a core dump may also be forced by means of system provided command line utilities. Sometimes, a core dump is useful when diagnosing a process that appears to be hung; the core dump may reveal information as to what is causing the hang. When collecting a core dump it is important to gather other information about the environment so that the core file can be analyzed (for example OS version, patch information, and the fatal error log). Core dumps do not usually contain all the memory pages of the crashed or hung process. With each of the operating systems discussed here, the text (or code) pages of the process are not included in core dumps. But to be useful, a core dump should consist of pages of heap and stack at the least. Collecting non-truncated good core dump files is essential for postmortem analysis of the crash.
3.2.1 Collecting Core Dumps on Solaris With the Solaris Operating System, unhandled signals such as a segmentation violation, illegal instruction, etc. result in a core dump. By default, the core dump is created in the current working directory of the process and the name of the core dump file is “core”. The user can configure the location and name of the core dump using the core file administration utility, coreadm. This is fully described in the man page for the coreadm utility. To configure core dump creation you need to check the code file size limit using ulimit -c. ulimit is the utility to set or get limitations on the system resources available to the current shell and its descendants. Make sure that the limit is set to unlimited, otherwise the core file may be truncated. The gcore utility can be used to get a core image of running processes. This utility accepts a process id (pid) of the process to which we want to force core dump. To get the list of Java processes running on the machine, we can use any of the following commands: 1. ps -ef | grep java 2. pgrep java 3. jps is a new command line utility in J2SE 5.0. jps does not work by name matching (looking for “java” in the process command name) and so it can list JVM embedding processes as well. See section 1.6.
ShowMessageBoxOnError A Java process may also be started with the -XX:+ShowMessageBoxOnError command line option. When a fatal error is encountered, the process prints a message to standard error and waits for a yes/no response from standard input. Here is the example output for when an unexpected signal occurs : 117
Unexpected Error SIGSEGV (0xb) at pc=0xfe610218, pid=13429, tid=1 Do you want to debug the problem? To debug, run 'dbx - 13429'; then switch to thread 1 Enter 'yes' to launch dbx automatically (PATH must include dbx) Otherwise, press RETURN to abort...
Before answering yes or pressing RETURN, one can use above mentioned gcore utility to force a core dump.
3.2.1.1 Suspending a Process using truss In some situations it may not be possible to specify the -XX:+ShowMessageBoxOnError option. In such situations it may be possible to use the truss utility to suspend the process when it reaches a specifiic function or system call. truss is the Solaris utility to trace system calls and signals. Following is an example of using truss to suspend a process when the exit system call is executed (in other words, the process is about to exit). truss -t \!all -s \!all -T exit -p
When the process calls exit it will be suspended. At this point, the debugger can be attached to the process or gcore to force a core dump.
3.2.2 Collecting Core Dumps on Linux On Linux, unhandled signals such as segmentation violation, illegal instruction, etc. result in a core dump. By default, the core dump is created in the current working directory of the process and the name of the core dump file is core. where pid is the process id of the crashed Java process. On Linux, use the ulimit -c command to set the core file size limit. Make sure that it's set to unlimited. Note that this is a Bash shell built-in command. On C shell, you must use the limit command. The gdb gcore command can be used to get a core image of a running process. This utility accepts the pid of the process for which you want to force the core dump.
118
The list of java processes can be obtained using any of the following commands: 1) ps -ef | grep java 2) pgrep java 3) jps is a new command line utility in J2SE 5.0. jps does not work by name matching (looking for “java” in the process command name) and so it can list JVM embedding processes as well. ShowMessageBoxOnError A java process may also be started with the -XX:+ShowMessageBoxOnError command line option. When a fatal error is encountered, the process prints a message to standard error and waits for a yes/no response from standard input. Here is the example output for when an unexpected signal occurs :
Unexpected Error --------------------------------------------------------------------------SIGSEGV (0xb) at pc=0x40029604, pid=22099, tid=1024 Do you want to debug the problem? To debug, run 'gdb /proc/22099/exe 22099'; then switch to thread 1024 Enter 'yes' to launch gdb automatically (PATH must include gdb) Otherwise, press RETURN to abort...
Type “yes” to launch gdb as suggested by the error report shown above. In the gdb prompt, you can give the gcore command. This command creates a core dump of the debugged process with the name core. where pid is the process id of the crashed process. Note that the gdb gcore command is supported only in the latest versions of gdb. Look for “help gcore” in the gdb command prompt.
3.2.3 Reasons for Not Getting a Core File Following is a list of the top 10 reasons why a core file may not be generated: 1. The current user does not have permission to write in the current working directory of the process. 2. The current user has write permission on the current working directory, but there is already a file named “core” that has read-only permission. 3. The current directory does not have enough space or there's no space left! 4. The current directory has a subdirectory named “core”. 5. The current working directory is remote. It may be NFS (Network File System) mapped, and NFS 119
failed just at the time the core dump was about to be created – Murphy's law! 6. Solaris only: The coreadm tool has been used to configure the directory and name of the core file, but any of the above reasons apply for the configured directory or filename. 7. The core file size limit has been set to zero using the limit tool. Check your core file limit using the ulimit -c command. This should print “unlimited”. The core dump file size has to be large enough. Otherwise, you will get truncated core dumps or no core dump if the core file limit is zero. 8. The process is running a setuid program and therefore the OS will not dump core unless configured explicitly. 9. Java specific: The process received SIGSEGV or SIGILL but no core dump! May be the process handled it! For example, HotSpot VM uses the SIGSEGV signal for legitimate purposes such as throwing NullPointerException, deoptimization etc. Not all SIGSEGVs are bad! Only if the current instruction (PC) falls outside JVM generated code, the signal is unhandled by the JVM. Only in such cases, HotSpot dumps core. 10.Java specific: The JNI Invocation API was used to create the VM. The standard Java launcher was not used. The custom Java launcher program handled the signal by just consuming it and produced the log entry silently. This has been seen with certain AppServers, WebServers. These JVM embedding programs transparently attempt to re-start (fail over) the system after abnormal termination. Not producing core is a feature and not a bug.
120
3.2.4 Collecting Crash Dumps on Windows On Windows there are three types of crash dumps: 1. Dr Watson logfile – This is a text error log file that includes faulting stack trace and a few other details. 2. User minidump – This is a sort of “partial” coredump. It is not a complete core dump as it does not contain all the useful memory pages of the process. 3. Dr Watson full-dump – This is equivalent to Unix core dump. This contains most memory pages of the process (except for code pages). When an unexpected exception occurs on Windows the action taken depends on two values in the following registry key : \\HKEY_LOCAL_MACHINE\Software\Microsoft\Windows NT\CurrentVersion\AeDebug
The two values are named Debugger and Auto. The Auto value indicates if the debugger specified in the value of the Debugger entry starts automatically when an application error occurs :
Value Meaning 0 The system displays a message box notifying the user when an application error occurs. 1 The debugger starts automatically. The Debugger value is the deubgger command to use to debug program errors. When a program error occurs, Windows examines the Auto value and if the value is 0 it executes the command in the Debugger value. If the value for the Debugger is a valid command, a message box is created with two buttons: OK and Cancel. If the user clicks OK, then the program is terminated. If the user clicks Cancel, the specified debugger is started. If the value for the Auto entry is set to one and the value for the Debugger entry specifies the command for a valid debugger, the system automatically starts the debugger and does not generate a message box.
3.2.4.1 Configuring Dr Watson The Dr Watson debugger is used to create crash dump files. By default, Dr Watson debugger (drwtsn32.exe) is installed into the Windows system folder (%SystemRoot%\System32). To install Dr Watson as the postmortem debugger, run the following command: drwtsn32 -i 121
To configure name and location of crash dump files, run drwtsn32 without any options. drwtsn32 In the Dr Watson GUI Window, you need to make sure that the “Create Crash Dump File” checkbox is set . Also the crash dump file path and log file path are configured in their respective text fields. See the following sample screen-shot:
Dr Watson may be configured to create a full dump using the registry. The registry key is: System Key: [HKEY_LOCAL_MACHINE\SOFTWARE\Microsoft\DrWatson] Entry Name: CreateCrashDump Value: (0 = disabled, 1 = enabled) Note that if the application handles the exception, then the registry configured debugger is not invoked. In that case it may be appropriate to use the -XX:+ShowMessageBoxOnError command-line option to force process to wait for user intervention on fatal error conditions. 122
3.2.4.2 Forcing a Crash Dump On Windows, the userdump command-line utility can be used to force Dr Watson dump of a running process. The userdump utility does not ship with Windows but instead is released as a component of the OEM Support Tools package. The documentation for userdump and the link to the download location can be found at: http://support.microsoft.com/default.aspx?kbid=241215 An alternative way to force a crash dump is to use the windbg debugger. The main advantage of using windbg is that it can attach to process in a non-invasive manner (ie: read-only). Normally Windows terminates a process after a crash dump is obtained but with the non-invasive attach it is possible to obtain a crash dump and let the process continue. To attach non-invasively requires selecting the “Attach to Process” option and clicking the “Noninvasive” checkbox as shown in the following screen-shot:
Once attached, a crash dump can be obtained using the following command : .dump /f crash.dmp
123
windbg is included in the “Debugging Tools for Windows” download which can be found at: http://www.microsoft.com/whdc/ddk/debugging One additional utility in this download worth noting is the dumpchk.exe utility. It can verify that a memory dump file has been created correctly. Both userdump.exe and windbg require that you know the process id (pid) of the process. userdump -p lists the process and program for all processes. This is useful if you know that the application is started with the java.exe launcher. However if a custom launcher is used (embedded VM) then it may not be easy to recognize the process. In that case you can uee the the jps command line utility (see section 1.6) as it lists the pids of the java processes only. As with Solaris and Linux, you can also use the -XX:+ShowMessageBoxOnError command line option on Windows. When a fatal error is encountered, the the process shows a message box and waits for a yes or no response from the user:
Before clicking on Yes or No, you can use userdump.exe utility to generate the Dr Watson dump for the Java process. The utility can also be used for the case where the process appears to be hung.
124