UAB COMMUTER SURVEY
FINAL REPORT Virginia P. Sisiopiku, PhD Associate Professor of Transportation Engineering Department of Civil, Construction, and Environmental Engineering Rachael C. Thompson Undergraduate Student in Civil Engineering Department of Civil, Construction, and Environmental Engineering Ossama E. Ramadan, PhD Research Trainee Department of Civil, Construction, and Environmental Engineering
May 2016
TABLE OF CONTENTS INTRODUCTION ..................................................................................................................... 1 LITERATURE REVIEW.............................................................................................................. 2 METHODOLOGY .................................................................................................................... 3 RESULTS AND DISCUSSION .................................................................................................... 5 Sample Description ................................................................................................................... 5 Survey Response Analyses: Student and Employee ................................................................. 6 Student-Specific Survey Responses ........................................................................................ 21 Employee-Specific Survey Responses ..................................................................................... 23 Select Cross Tabulations ......................................................................................................... 25 OPEN-ENDED RESPONSE SUMMARY .................................................................................... 29 SUMMARY CONCLUSIONS AND RECOMMENDATIONS ......................................................... 30 REFERENCES ........................................................................................................................ 32 APPENDIX............................................................................................................................ 33
ii
LIST OF TABLES Table
Page
1
Highest values for reasoning of non-alternative mode choice per given mode .............. 18
3
Student classification compared to typical number of daytime commutes per week .... 26
5
Student gender compared to mode choice (%) ................................................................ 27
7
Employee mode choice by average annual income ......................................................... 28
2
Student classification compared to mode choice............................................................. 25
4
Student classification compared to typical number evening commutes per week ......... 26
6
Employee gender compared to mode choice (%) ............................................................ 27
8
Employee commute distances compared with those interested in switching to alternative modes if given special incentives ................................................................... 28
9
Employee type and willingness to switch mode given specific incentives cross comparison ....................................................................................................................... 29
iii
LIST OF FIGURES Figure
Page
1
UAB Commuter Survey Cover ............................................................................................. 3
3
Employee age bracket data ................................................................................................ 5
5
Employee Trip Origins ......................................................................................................... 7
7
Student UAB commute route ............................................................................................. 8
9
Student commute distances to UAB ................................................................................... 9
11
Student commute time to UAB......................................................................................... 10
13
Student automotive quantities ......................................................................................... 11
15
Student mode choice ........................................................................................................ 12
17
Student number of commutes per week.......................................................................... 13
19
Student mode preference ................................................................................................. 15
21
Student mode choice contributing factor (average rating per factor) ............................. 16
2
Student age bracket data .................................................................................................... 5
4
Student Trip Origins ............................................................................................................ 6
6
Total (Employee + Student) Trip Origins............................................................................. 7
8
Employee UAB commute route .......................................................................................... 8
10
Employee commute distance to UAB ................................................................................. 9
12
Employee commute time to UAB ..................................................................................... 10
14
Employee automobile and household quantities............................................................. 11
16
Employee mode choice ..................................................................................................... 13
18
Employee number of commutes per week ...................................................................... 14
20
Employee alternative mode preference ........................................................................... 15
22
Employee mode choice contributing factor (average rating per factor).......................... 16 iv
23
Student non-alternative mode choice reasoning ............................................................. 17
25
Student driving and parking data ..................................................................................... 18
27
Student ideas for improvements on campus ................................................................... 20
29
Student status classification ............................................................................................. 21
31
Student type percentile .................................................................................................... 22
33
UAB employee type .......................................................................................................... 23
35
Employee incentive for mode switching .......................................................................... 25
24
Employee non-alternative mode choice reasoning .......................................................... 17
26
Employee driving and parking data .................................................................................. 19
28
Employee ideas for improvements on campus ................................................................ 20
30
Student living situation ..................................................................................................... 22
32
Student employment status ............................................................................................. 23
34
Employee income bracket ................................................................................................ 24
v
UAB COMMUTER SURVEY INTRODUCTION The University of Alabama at Birmingham (UAB) has grown substantially over the past ten years, both in land use and economic impact. In 2010, an economic study conducted by Tripp Umbach Associates (2010) reported that the UAB supports over 61,000 local jobs. The same report also projected that UAB will create an additional 10,000 jobs by 2020. According to the UAB 2014-2015 Facts and Figures report, UAB currently hosts more than 18,600 students, and that number is expected to grow to 25,000 by 2020. The existing six residence halls house approximately 2,880 students and a resident assistant staff of approximately 90 with a studenthousing occupancy of 100% percent. The UAB workforce for 2014-15 was 20,202 with 11,448 employees on the University side and 8,754 on the Hospital side, making it the single largest employer in the state of Alabama. The continuing growth of the University and projected increase in employee and student populations in the future is expected to lead to an increasing demand for transportation services in and around the UAB campus. Thus it becomes important ensure that necessary actions are taken to avoid increase in congestion around the university’s campus and downtown Birmingham and ensure that commuting needs to/from UAB are met. By understanding employee and student commuting patterns and user preferences, UAB administrators can make well-informed decisions regarding land use, transportation system improvements, and promotion of alternative transportation options in order to provide a balance between supply and demand and serve accessibility and mobility needs of the UAB community. To date, however, there is no data regarding the existing conditions of commuting patterns specific to UAB’s campus. While the Regional Planning Commission of Greater Birmingham (RPCGB) has aggregate data on city traffic information, UAB’s distinct commuting population and land use requires more specifically tailored research on this issue. There is also no known data available regarding student and employee travel preferences or opinions on nonmotorized and alternative mode choices. There is, therefore, a need to gather and analyze data that characterize commuting patterns around UAB’s campus and to gather knowledge about commuter opinions on travel. This study serves to fulfill that need; through the method of anonymous questionnaire surveys, both UAB students and employees reported information on their daily travelling habits as they relate to travel modes they use to commute to campus, origins and destinations, and travel preferences. This information serves as a baseline of data for analysis and study, upon which future studies can be conducted. The data gathered can be used to benchmark current practices and preferences and help RPCGB and UAB to better plan for transportation needs of the UAB community in the future.
1
LITERATURE REVIEW University students and those who commute to work at universities often have travel patterns that are distinct from other members of a city’s population, potentially due to densified living situations (Wang, Khattak, & Son, 2012). In literature, a university has been considered a special trip generator and, thus, the standard four-step method of determining trip generation may not deliver accurate results, as it does not take into account individual travel behavior, but rather assumes uniform travel behavior among the same analysis zone. In a university setting, where there are many subpopulations, travel behavior cannot truly be considered uniform. The university students in particular are more active than the normal population and are statistically more likely to choose an alternative mode of transportation, such as walking or biking (Ma, 2015). Because of discrete differences in commuting choices, it is important to represent this subpopulation in the surrounding city’s transportation models. However, this type of model is not well studied or well documented in peer-reviewed literature. Few studies, even within the National Household Travel Survey (NHTS), have documented student travel behavior explicitly, and their travel is not very well understood (Wang et al., 2012). Even though NHTS methods for conducting travel demand analysis are widely replicated, they are not specifically catered to a university setting, and thus there is a need to alter some of the commonly used methods to fit the specific demographics and setting of the university. While some studies have compared students who are university employees with other employee age groups (VHB, P.C. & UNC Chapel Hill, 2013), no published studies explicitly comparing university employee travel patterns with student patters has been found, which indicates an exigency for study. Several examples of studies done to better understand university students’ travel involve travel diaries (Eom, Stone, & Ghosh, 2009) and student surveys (Ma, 2015). A study at Old Dominion University in Virginia used an adjusted conventional trip diary, found that proximity of residence to campus strongly affected travel mode choice (Wang et al., 2012). Uniquely, the study also found that there was no strong correlation data between income and travel behavior, which is unlike the typical travel demand model. However, most campus studies are individualized for specific schools, and therefore serve as reference upon which other schools can develop similar surveys that are tailored to a university’s unique geographic location and population. Thus, there is a need to develop transportation demand models for UAB specifically in order to better understand the university’s transportation needs, as well as to contribute to the greater knowledge of transportation networks around campuses. The cities surrounding urban campuses are heavily influenced by the commuting patterns of the university’s students, and vice versa. For example, nearly all urban campuses in the United States are severely affected by automobile traffic and parking shortages (Wang et al., 2012). As such, it is expected that UAB, an urban campus located in downtown Birmingham, also affects transportation systems in the city. Because of this, both the RPCGB and UAB decision-makers could benefit from understanding travel patterns specific to UAB’s nearly 100-block campus.
2
METHODOLOGY UAB is a far-reaching campus, covering over 100 city blocks. The campus is between two major interstates, I-65 and I 20-59, seen in One approach commonly used to gain an understanding of transportation users’ choices and behaviors is administration of questionnaire surveys. After consideration of best practices, it was decided that the best way to collect data to represent all employee types and students would be through a voluntary questionnaire survey. Not only does a survey provide respondents with the opportunity to answer specific questions regarding their commutes, but it also provides a platform to gather student and employee opinions in a free-form manner. First, approval of the Institutional Review Board (IRB) for Human Use from the University of Alabama at Birmingham was obtained. As part of the effort, two draft survey instruments were developed using the SurveyMonkey online hosting platform (one for employees and one for students). As both populations are to be considered in the study, and both populations are expected to have distinct travel patterns, breaking the survey into separate components was determined to be the best practice. A cover page preceded the survey providing information on the purpose of the survey, participation requirements, and participants’ rights (Figure 1).
Figure 1: UAB Commuter Survey Cover
3
The UAB Commuter questionnaires were designed based on practices recommended by the Manual of Transportation Studies. Questions were then adapted to better fit the populations of interest and to be more relevant to UAB’s urban campus setting. The questionnaires asked participants both qualitative and quantitative questions focused on a. demographic characteristics (age, gender, employment type, vehicle ownership, income, etc.); b. commuting characteristics (trip origin, home-to-work distance, commuting travel time, commute time of the day, etc.); and c. commuting mode preferences (drive alone, ride share, bicycle, etc.). Openended questions were also included in some questions, allowing students and employees to respond freely to certain questions. More specifically, the employee survey consisted of 21 total questions. Singular response multiple-choice questions characterizing the travel patterns of employees, such as income, employment type, and trip quantity were included. The opportunity to provide multiple responses to a single question was an option on certain questions that asked the participants questions about their opinions or preferences. Some questions were open-ended, allowing the participant to enter person-specific data, such as his/her nearest intersection and zip code, or to provide the participants with the opportunity to freely insert their opinions on how to improve transportation at UAB. The student survey was very similar to the employee survey, consisting of 22 total questions. Students were not asked about income, but were asked about year classification and employment status in order to tailor more specifically to the student demographic. Students were also asked questions regarding trip frequency and preferences. The draft surveys were shared with RPCGB and UAB personnel for review and feedback. Pilot testing of the questionnaire surveys was performed and final adjustments to the survey tools took place. The final instruments used for the UAB Commuter survey of students and employees are available in the Appendix. To ensure that the UAB community was informed about the purpose of the survey and encouraged to participate, the survey was advertised through multiple forms of UAB media. Announcements were placed on the UAB’s weekly Green Mail newsletter, UAB’s e-Reporter (Nov. 3, 2015 and Nov. 13, 2015), and on the front door of BlazerNET. As an incentive, those who participated were given the option to enter the drawing for one of twenty $50 VISA gift cards. Both the employee and student UAB Commuter Surveys were launched on November 3, 2015 with a mass-email sent to every employee and student in the UAB BlazerNET system database. The bulk of the responses were obtained within the two weeks following the launch. Paper copies were also available for those who did not want or were unable to complete the form online and student volunteers assisted in entering the paper survey responses into to database in December 2015 and January 2016. Sampling from a large, unbiased pool of participants created a more accurate representation of travel patterns.
4
RESULTS AND DISCUSSION Sample Description During the posting time 10,113 total responses were recorded. This shows that approximately one in every 4 survey recipients responded to the survey. From the data collected, 68% of the student respondents were female, and 32% were male. In the employee survey, 71% of respondents were female, and 29% were male. Over 60% of student respondents are in the age bracket of 18 to 24, as shown in Figure 2, while the employee survey reported a wider variety of ages, the majority of which were between 25 and 54, as shown in Figure 3. 70.0%
64.9%
60.0% 50.0% 40.0% 30.0%
25.3%
20.0% 10.0%
0.0%
0.1%
17 or less
5.7% 18 to 24
25 to 34
35 to 44
2.9%
45 to 54
Figure 2: Student age bracket data
30.0%
0.9%
55 to 64
0.1%
65 or more
27.3%
25.0%
22.1%
24.0%
20.0%
18.0%
15.0% 10.0% 5.2%
5.0% 0.0%
3.4%
0.0% 17 or less
18 to 24
25 to 34
35 to 44
45 to 54
Figure 3: Employee age bracket data
5
55 to 64
65 or more
Survey Response Analyses: Student and Employee For consistency purposes, the student and employee surveys contained many of the same questions. This section of the report contains responses form the survey questions present in both the student and employee surveys for comparison between the two populations. To identify commuters’ trip origins, question 11 of the student survey and question 12 of the employee survey asked respondents where they live. Each respondent had the option to fill in his or her street address and ZIP code or to skip this question. Analysis of survey responses shows that 3,682 student respondents (89% of total student respondents) who do not live on campus provided their trip origin ZIP Code, of which 3,617 had valid responses (87% of total student responses). Figure 4 illustrates the students’ trips origins distribution which indicates that most students commutes from the cities of Hoover and Vestavia Hills.
Figure 4: Student Trip Origins Similarly, 5,717 employee respondents (96% of total employee respondents) who commute to UAB campus provided their trip origin ZIP Code, of which 5,675 had valid responses (95% of total employee respondents). Figure 5 illustrates the employees’ trips origins distribution which also aligns with the same commute pattern of students. Additionally, Figure 6 confirms the aggregate trip origin distribution for all who commute to UAB campus.
6
Figure 5: Employee Trip Origins
Figure 6: Total (Employee + Student) Trip Origins
7
To gain a better understanding of the routes commuters commonly use to come to UAB, students and employees were asked which of the major routes they use on a daily basis. To account for students who live on campus and do not use any major route for travel on campus, both surveys included the option “I live on Campus,” as can be seen in Figure 7 and Figure 8. It is also important to note that the figures representing this data do not include participants who selected “other” as their method for entering campus. It is observed that the distribution of route choices among students and employees is similar, with the notable difference of more students reported living on campus than employees (8% of students versus 1% of employees).
8%
From I-65 Northbound (traveling from the south)
28%
From I-65 Southbound (traveling from the north) From US 280
31%
From an arterial street
20%
I live on campus
13%
Figure 7: Student UAB commute route
1% From I-65 Northbound (traveling from the south)
28%
31%
From I-65 Southbound (traveling from the north) From US 280
18%
From an arterial street I live on campus
22%
Figure 8: Employee UAB commute route
8
Students and employees were also asked about their average daily commute distance (oneway) to campus. Results from these questions are reported in Figure 9 and Figure 10.
21 miles or One mile or less 15% more 20%
16-20 miles 11%
11-15 miles 14%
1-5 miles 22%
6-10 miles 18%
Figure 9: Student commute distances to UAB One mile or less 3% 1-3 miles 10% 21 miles or more 26%
4-10 miles 27%
16-20 miles 13% 11-15 miles 21%
Figure 10: Employee commute distance to UAB The results indicate that students, in general, live closer to UAB campus. As shown in Figure 9, 15% of students reported only commuting 1 mile or less and 22% reported to travel 1-5 miles to get to the UAB campus. In the employee survey responses, the largest number of employees (27%) reported their daily commute distances to be 4-10 miles, followed by 26% commutes that report traveling over 21 miles one way.
9
It is understood that mode choice is significantly affected by commute distance. If targeted for mode switching, then, it could be assumed that these populations may be influenced differently by factors that lead to mode choice. Similarly, both surveys’ participants were asked to report their average commute time (oneway) to campus, the results of which are shown in Figure 11 and Figure 12 for students and employees respectively. 3% 2% 4% 6%
10 minutes or less
24%
11-20 minutes 21-30 minutes
11%
31-40 minutes 40-50 minutes
21%
50-60 minutes
61-75 minutes
29%
over 75 minutes
Figure 11: Student commute time to UAB 2% 6%
4%
9%
10 minutes or less 11-20 minutes
11% 26%
21-30 minutes
31-40 minutes 40-50 minutes
17%
50-60 minutes
61-75 minutes
over 75 minutes
25%
Figure 12: Employee commute time to UAB The largest percentile of employee respondents reported that they commuted for 11-20 minutes one way at 26%, as did the largest percentile of students at 29%. More students
10
reported traveling for shorter times than employees; only 9% of employees reported traveling 10 minutes or less compared to 24% of student respondents. In general more students have shorted commute times to UAB, with 74% of all student respondents traveling 30 minutes or less, compared to employees with 60% traveling 30 minutes or less. Survey participants were also asked details about their vehicle ownership, and their responses are shown in Figure 13 and Figure 14. A notable difference between the surveys’ questions is that employees were asked to report quantities of cars/vans, bicycles, motorcycles, adults in their households, and children in their household, while students were only asked to report quantities of cars, bicycles, and motorcycles. 2.4% 4.1%
Bicycles Motorcycles
25.4%
0.1% 0.2% 2.9%
4.0%
Cars/vans 0.0%
68.0% 96.8%
12.5%
5.9%
20.0%
40.0%
more than 2
60.0% 2
77.5%
80.0%
1
0
100.0%
120.0%
Figure 13: Student automotive quantities
Bicycles Motorcycles Cars/vans Children Adults (including yourself)
0%
10%
20%
more than 6
30%
6
5
40% 4
3
50% 2
60% 1
0
70%
80%
Figure 14: Employee automobile and household quantities
11
90% 100%
From the student survey responses it can be seen that 77% of participants own one car/van. Response data shows that students have significantly low ownership of both motorcycles and bicycles; 96% of participants do not own motorcycles, and 68% do not own a bicycle. Employees similarly reported low ownership of both motorcycles and bicycles, with 93% and 50% of participants, respectively, reporting no ownership. Nearly half (48%) of the employees surveyed own two cars or vans. Interestingly, 53% of the employees surveyed have no children, even though the age brackets reported in Figure 3 were approximately normally distributed. Approximately 61% have two adults including themselves living in their household. Student and employee daily mode choices are summarized in Figure 15 and Figure 16. Students were given the following options: Drive alone, Dropped off by a relative/friend, Organized carpool/vanpool, Transit, Motorcycle, Bicycle, Walk, and Other. Employees were given the same choices with the exception of having the choice to “Telecommute/Other” instead of “Other.” It can be seen that approximately 88.4% of UAB employees and 82.5% of students drive alone to campus. Another 7% of employees reported being “dropped off by a relative/friend”, while 14% of students typically “walk” to school. According to the survey results, organized vanpool/carpool is the typical commute mode for approximately 4.4% for employees and 5.9% for students. The responses show that the overwhelming majority of UAB commuters drive alone to school/work and confirms the UAB commuters still embrace the automobiledependent commuting culture.
1.0%
3.4%
Figure 15: Student mode choice
12
14.2%
0.8%
Other
1.3%
Walk
5.0%
Bicycle
0.0%
5.5%
Motorcycle
20.0%
Drive alone
40.0%
Transit
60.0%
82.5%
Organized carpool/vanpool
80.0%
Dropped off by relative/friend
100.0%
1.2%
0.6%
1.6%
3.2%
0.7%
Telecommute/Other
4.4%
Walk
6.7%
Bicycle
0.0%
Motorcycle
20.0%
Drive alone
40.0%
Transit
60.0%
Organized carpool/vanpool
80.0%
88.4%
Dropped off by relative/friend
100.0%
Figure 16: Employee mode choice In addition to mode choice, survey participants were asked to report how often they commute to UAB per week. For both the students and employee surveys, the majority of respondents commute 5 days per week. Fewer students commute 5 times per week than employees (see Figure 17 and Figure 18). This is to be expected, as some full time students may not have classes 5 days per week, whereas many UAB employees could work a regular 5-day work schedule. 90.0%
80.0% 70.0% 60.0% 50.0% 40.0% 30.0% 20.0% 10.0%
0.0%
52.3%
15.8%
12.7%
13.6%
3.3%
1.2%
3.0%
12.6%
5 days per 4 days per 3 days per 1 to 2 days 5 nights 4 nights 3 nights 1 to 2 week week week per week per week per week per week nights per week
Figure 17: Student number of commutes per week
13
90.0% 80.0%
70.0%
78.4%
60.0% 50.0% 40.0% 30.0% 20.0% 10.0%
0.0%
7.1%
8.6%
3.0%
1.3%
0.9%
2.0%
2.1%
5 days per 4 days per 3 days per 1 to 2 days 5 nights 4 nights 3 nights 1 to 2 week week week per week per week per week per week nights per week
Figure 18: Employee number of commutes per week
It can be further seen from Figure 17 and Figure 18 that only approximately 20% of all students and 6% of all employee responses reported any nighttime commuting. This may indicate that further surveying may be required to appropriately represent this subpopulation. Part of the purpose of the UAB Commuter surveys was to understand UAB employee and student opinions on alternative modes of transportation. In both surveys, students and employees were asked to identify the types of transportation they would choose if that option was easily available to them. More than one choice was allowed for this question and respondents were given the same options they were given on the previous question regarding their mode choice. The responses from this question were summarized in Figure 19 and Figure 20. It can be seen that the majority of respondents would still prefer to drive alone if other mode choices were available (51% of employees and 53% of students). However, the number of participants who selected alternative modes of transportation increased. For employee responses, only 1.2% of employees currently commute by transit, but 24% would prefer to commute by transit if it was a realistic option. Similarly, almost 20% of employee respondents would prefer to use an organized carpool or vanpool, while only 4% of employees currently use this mode. There was also a significant increase in the number of employees would prefer to telecommute but do not currently (from less than 1% currently to 14%). Students, too, showed an interest in using alternative modes. Twenty-one percent would prefer to take organized carpools/vanpools or transit, while less than 5% currently use either option. More students would also prefer to bicycle for their commute than currently do (from 3.4% who currently use this mode to almost 14%).
14
4.6%
13.8%
12.8%
2.6%
Other
21.8%
Walk
0.0%
Drive alone
10.0%
21.8%
13.1%
Bicycle
20.0%
Motorcycle
30.0%
Transit
40.0%
53.0%
Organized carpool/vanpool
50.0%
Dropped off by relative/friend
60.0%
Figure 19: Student mode preference
51.5% 14.1% Telecommute/Oth er
4.7%
Walk
7.2%
Bicycle
2.3%
Motorcycle
Transit
24.0%
Organized carpool/vanpool
19.8%
Dropped off by relative/friend
15.5% Drive alone
60.0% 50.0% 40.0% 30.0% 20.0% 10.0% 0.0%
Figure 20: Employee alternative mode preference To continue to assess student and employee opinions on mode choice, survey participants were asked further questions to clarify what factors influence their mode choices. Both students and employees were also asked how specific factors influence their selection of regular commute modes. Both students and employees were asked to rate a specific factor out of 5, with 5 being most important and 1 being least important. The given options were as follows: Environmental impacts, Safety, Reliability, Convenience, Rime, and Cost (in dollars). Responses from this question by students and employees were summarized in Figure 21 and Figure 22, respectively.
15
Environmental impacts
3.32
Safety
4.42
Reliability
4.58
Convenience
4.49
Time
Cost (in dollars)
0.00
1.00
2.00 3.00 Average Rating
3.98
4.00
4.58 5.00
Figure 21: Student mode choice contributing factor (average rating per factor) Environmental impacts
3.56
Safety
Reliability
4.76
Convenience
4.64
Time
Cost (in dollars)
0.00
4.62
1.00
2.00 3.00 Average Rating
3.82
4.00
4.66 5.00
Figure 22: Employee mode choice contributing factor (average rating per factor) As shown in Figures 21 and 22, both students and employees had similar responses. Travel reliability, time, convenience, and safety were nearly equally important to both study groups. Interestingly, the cost and environmental impacts rated as factors of the lowest importance for mode choice selections in both the student and the employee survey responses. Participants who rarely use carpool or other alternative transportation modes (specifically carpool, transit, biking, and walking) were asked why they do not. Respondents were allowed to make multiple selections out of the following options: "Travel time is too long,” “This is not an available option for my travel,” “This is not a convenient option for my travel,” “This is not a safe option to travel,” “I am not aware of available resources,” and “Other.” Results are
16
summarized in Figure 23 and Figure 24 and Table 1.
1443 1360
1719
1426
1224
1054 648
512 147
I do not carpool because
Travel time is too long
212
816
173
I do not use transit because
This is not a convenient option for my travel
750
502
374
266
40
956
34
323
288
I do not bike to campus because
554
14
200
I do not walk to campus because
This is not an available option for my travel This is not a safe option to travel
I am not aware of available services
Other
Figure 23: Student non-alternative mode choice reasoning
2365
2096
1455
280
2994
36
885 696
I do not carpool because
864
Travel time is too long
2004
1237
1451
965 708
607 326 195
26
I do not use transit because
414
1032
578607
14
279
I do not bike to campus I do not walk to campus because because
This is not a convenient option for my travel I am not aware of available services
This is not an available option for my travel This is not a safe option to travel Other
Figure 24: Employee non-alternative mode choice reasoning 17
Table 1: Highest values for reasoning of non-alternative mode choice per given mode Mode Carpool Transit Bike Walk
Student: Reason, Largest Quantity This is not an available option (1443) This is not an available option (1426) Travel time is too long (1224) Travel time is too long (1719)
Employee: Reason, Largest Quantity This is not a convenient option (2096) This is not an available option (2365) Travel time is too long (2004) Travel time is too long (2994)
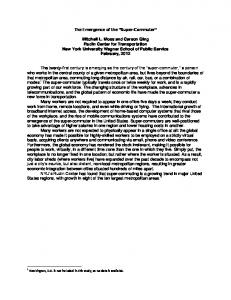
Employees and students reported that they choose not to bike and walk because travel time is too long. Figure 9 and Figure 10 show that many students and employees live further than five miles, so it is expected that many are not able to walk or bike because they, indeed, live outside the limits of comfortable biking or walking. Most students and employees reported that the reason they do not commute using transit is because it is not an available option. Many students and employees may live in areas that are not served by UAB or Birmingham transit. As far as carpool is concerned, employees reported that they do not use carpool mostly because they do not feel that it is a convenient option for travel, whereas students mostly felt that it is not an available option for travel. Figure 25 and Figure 26 summarize results from the question “If you drive to UAB, do you typically…” and were prompted to choose “Yes” or “No” in response to the following criteria: “Drive Alone,” “Park in a parking lot, deck, or metered parking,” “Park on the street for free,” “Move your car during the workday,” and “Use Blazer Express to move around campus.”
92%
90%
8%
11%
Drive alone
23%
22%
77%
79%
Park in a parking Park on the street lot, deck, or for free metered parking space No
Yes
Move your car during the day
Figure 25: Student driving and parking data
18
6%
94%
Use Blazer Express to move around campus
92%
88%
8%
12%
Drive alone
17%
13%
19%
84%
88%
81%
Move your car during the workday
Use Blazer Express to move around campus
Park in a parking Park on the street lot, deck, or for free metered parking space No
Yes
Figure 26: Employee driving and parking data As previously see from Figure 15 and Figure 16, the large majority of students and employees drive alone. Most students (79%) and employees (88%) do not move their cars during the day, and most students (94%) and employees (81%) do not utilize the Blazer Express. As far as parking is concerned, 88% report that they typically parking in parking lots, decks, or metered parking spaces whereas 17% report parking on the street for free. To get feedback from students and employees about possible improvements related to automobile transportation and non-alternative modes of transportation on campus, employees and students were asked to select from given options what they like to see more on UAB’s campus. Participants were allowed to select as many choices as applied. Percentile results are summarized in Figure 27 and Figure 28. The majority of the student respondents (91.5%) stated that there should be more parking spaces on campus; while 29.7% of the respondents revealed their desire of construction of pedestrians and green spaces. 20.4% of the respondents believed that there should be bus service for users. Also, an overwhelming 83.5% of the employee survey respondents suggested that there must be more parking places whereas 33.8% of the said that, there must be green spaces and amenities for pedestrians and 25.8% recommended expansion of bus service. Slightly more employees stated interest in ride sharing options than students (21% vs. 15%).
19
100.0% 90.0%
80.0%
91.5%
70.0% 60.0% 50.0% 40.0%
29.7%
30.0% 20.0% 10.0%
20.4% 17.7%
0.0%
11.2%
17.9% 15.4%
7.4%
20.7%
9.0%
Figure 27: Student ideas for improvements on campus
83.5%
21.8% 9.4%
Figure 28: Employee ideas for improvements on campus
20
16.8%
More information on BJCTA and Blazer Express…
13.2%
BJCTA bus stops
Bicycle lockers
8.2%
Bicycle racks
Blazer Express bus service
Green spaces; pedestrian facilities
14.7%
Ride-sharing options
25.8%
Bike share stations
33.8%
Parking places
100.0% 90.0% 80.0% 70.0% 60.0% 50.0% 40.0% 30.0% 20.0% 10.0% 0.0%
Student-Specific Survey Responses As the student participants may consider different factors that affect mode choice than employees, the student survey contained certain questions that the employee survey did not. Students were asked to define their status as freshman, sophomores, juniors, seniors, graduate students, or professional students. These results are shown in Figure 29. Professional student, 9.5%
Freshman, 9.4%
Sophomore, 13.6%
Graduate student, 27.4%
Junior, 18.4%
Senior, 21.8%
Figure 29: Student status classification The results shown above are the survey sample is well distributed and, thus, representative of the student population. Slightly fewer freshmen and professional students are represented in the survey, which could skew the results somewhat, as their travel modes and opinions are underrepresented in the survey. Students were asked to describe their living situations, given the choice of one of the following: “Alone,” “With roommate,” “With spouse,” and “With parents.” Results are shown in Figure 30. The largest percentile of students responding to the commuter survey (35%) lives with a roommate, and followed by nearly 26% that live with parents. At it can be observed, the sample of students has significant representations from each group.
21
With parents, 25.9%
Alone, 17.0% With roommate, 35.8%
With spouse, 21.4%
Figure 30: Student living situation Students were also asked to report their student type—full-time student, part-time student, or a student that is not currently enrolled. Results are shown in Figure 31. Most students (83%) are full-time students. Only 1% of respondents reported that they were not currently enrolled at UAB. Not currently enrolled 1%
Part time student 16% Full time student 83%
Figure 31: Student type percentile As employment status may affect student mode choice and trip counts, students were asked to describe their employment status. Students could choose “On Campus” employment and “Off campus” employment, and select the type of job form the following options: “Full Time Job,” “Part Time Job,” and “No Job.” Results are shown in Figure 32.
22
Full Time
9%
Part Time Job
19%
36%
19%
45%
No Job 0%
10%
20%
30%
Off Campus Off Campus
40%
50%
60%
On Campus On Campus
70%
73%
80%
Figure 32: Student employment status
Employee-Specific Survey Responses In the same way that the student survey’s contained student-specific questions that may affect mode choice, the employee survey also asked respondents specific questions. Employees were asked to report their employee type—Hospital Employee, full or part time, or University Employee, full or part time. Results from this question are shown in Figure 33.
4%
5% 43%
48%
UAB Hospital Employee - Full time
UAB Hospital Employee - Part time
University Employee - Full time
University Employee - Part time
Figure 33: UAB employee type
Nearly half of the employees were either university full time employees or UAB hospital employees, with only 4% and 5% of respondents being part time hospital employees and part time university employees, respectively. Part time employees may be under-represented in this study, and may need to be targeted for specific study in future surveys.
23
Employees were also asked to choose an income bracket that best described their average income per year. Results are shown in Figure 34. More that $250,000/year
4.6%
$200,001 to $250,000/year
4.1%
$160,001 to $200,000/year
5.5%
$130,001 to $160,000/year
$100,001 to 130,000/year $80,001 to $100,000/year
7.6%
$60,001 to $80,000/year
13.8%
13.9%
14.7%
$40,001 to $60,000/year $20,001 to $40,000/year
$12,000 to $20,000/year
13.1%
3.1%
Less than $12,000/year 1.2% 0.0%
5.0%
10.0%
Figure 34: Employee income bracket
18.4%
15.0%
20.0%
Responses from the employee income question were somewhat normally distributed between $12,000 per year and more than $250,000, but the results are slightly skewed towards the lower incomes. This indicates that the sample of respondents is representative of employees’ income types. The largest percentile of employees reported making between $40,000 and $60,000 per year, and the smallest percentile of employees reported that they earn less than $12,000 per year. In order to understand what might incentivize employees to switch to alternative modes of transportation, employees were asked the following question: “If you currently drive alone, would you consider switching to carpooling or transit use if…?” Respondents picked their answer from the following options: “Gas price hits $4/gallon,” “Special incentives were available (monetary benefits, etc.),” “I wouldn’t consider switching my travel mode,” and “I already use alternative travel modes.” Respondents were allowed to pick more than one option. Responses from this question are shown in Figure 35. It can be seen that, while 34% of employees would not consider switching their modes, a significant percentage reported that, under certain circumstances, they would consider switching. Over 50% of respondents indicated that they would consider switching modes if offered some sort of incentive.
24
60.0%
51.5%
50.0% 40.0% 30.0%
39.4% 28.7%
20.0%
6.7%
10.0%
0.0%
Gas price hits $4/gallon
Special incentives I wouldn't consider I already use were available switching my travel alternative (monetary, benefits, mode transportation modes etc.)
Figure 35: Employee incentive for mode switching
Select Cross Tabulations In response to the results from both sets of surveys, certain responses were targeted for further study. Cross tabulations between various responses have been used to better understand how these factors affect one another. These tables are shown in Tables 2-8.
Class
Dropped Off By Relative or Friend
Drive Alone
Organized Carpool/ Vanpool
Transit
Motor-cycle
Bi-cycle
Walk
Other
Grand Total
Table 2: Student classification compared to mode choice
Freshman Sophomore Junior Senior Graduate Professional
5% 5% 4% 5% 5% 5%
65% 68% 77% 77% 71% 72%
3% 4% 4% 4% 5% 6%
1% 1% 1% 1% 1% 0%
0% 1% 1% 1% 1% 2%
1% 2% 3% 2% 4% 5%
23% 18% 10% 9% 12% 10%
0% 1% 1% 1% 1% 0%
100% 100% 100% 100% 100% 100%
Table 2 specifically targets student survey responses for further study. The table indicates that freshmen are more likely to walk than other university classifications. The percentages of students who reported that they drive alone are similar across all university classifications, as are the other alternative modes of transportation. Out of all classifications, more professional students reported using organized carpool/vanpool for commuting.
25
Similarly, student classification was also compared against the number of commute times to UAB per week for both day commutes and night commutes. The findings are shown in Table 3 and Table 4. Table 3: Student classification compared to typical number of daytime commutes per week Class Freshman Sophomore Junior Senior Graduate Professional Grand Total
5 Days per Week 11% 14% 16% 17% 28% 15% 100%
4 Days per Week 7% 12% 25% 26% 25% 4% 100%
3 Days per Week 7% 15% 22% 31% 22% 3% 100%
1 or 2 Days per Week 8% 14% 21% 29% 26% 3% 100%
Table 4: Student classification compared to typical number evening commutes per week Class Freshman Sophomore Junior Senior Graduate Professional Grand Total
5 Nights per Week 15% 16% 19% 21% 20% 8% 100%
4 Nights per Week 2% 17% 21% 28% 26% 6% 100%
3 Nights per Week 6% 17% 14% 35% 23% 5% 100%
1 to 2 Nights per Week 6% 11% 19% 22% 35% 7% 100%
Table 3 shows that more graduate students commute 5 days per week than other age groups and more seniors commute 3 days per week and 1 or 2 days per week than other age groups. Table 4 shows that more seniors commute in the evening than any other classification for any amount of night trips per week, with the exception of graduate students commuting 1 to 2 nights per week. Table 5 compares mode choice by gender. With the exception of the mode choices “Motorcycle” and “Bicycle,” females reported higher percentages in all mode choices. This could be because more significantly more females participated in the survey than males, potentially skewing the results. Table 6, similar to the previous table, compares employee mode by gender. The results were similar to Table 6 in that they are likely skewed by higher percentages of female respondents.
26
Organized Carpool/ Vanpool
Transit
Motorcycle
Bicycle
Walk
Other
Female Male Total
Dropped Off by Relative/ Friend
Gender
Drive Alone
Table 5: Student gender compared to mode choice (%)
68.90 31.10 100.00
77.78 22.22 100.00
74.15 25.85 100.00
63.46 36.54 100.00
27.50 72.50 100.00
44.93 55.07 100.00
64.62 35.38 100.00
66.67 33.33 100.00
Table 6: Employee gender compared to mode choice (%) Dropped Off by Relative/ Friend
Organized Carpool/ Vanpool
Transit
Motorcycle
Bicycle
Walk
Tele-commute/ Other
Female Male Total
Drive Alone
Gender
72.51 27.49 100.00
79.84 20.16 100.00
65.88 34.12 100.00
73.24 26.76 100.00
23.68 76.32 100.00
38.95 61.05 100.00
53.44 46.56 100.00
66.67 33.33 100.00
As income may also affect mode choice, employee income was compared to mode choice in Table 7. Results from Table 7 indicate that generally, employees who have higher incomes are more likely to drive alone to work, with those in the highest income bracket (more than $250,000) having the highest reported values for driving alone. Similarly, employees with lower incomes are more likely to walk than those with larger salaries, with the 20% of employees in the lowest income bracket (less than $12,000 per year) walking to work. In order to potentially target employees that might be willing to mode switch in the future, cross tabulations with specific mode switching data from Figure 35 is compared with other variables. Table 8 shows a cross comparison between employee commute distance and employee willingness to consider alternative modes if offered some sort of incentive. Table 9 contains data regarding employee type compared with two different criteria: those who would switch modes if offered some sort of incentive, and those who would telecommute if given that option was available. This data targets specific employees who might be willing to switch modes given proper incentives.
27
Table 7: Employee mode choice by average annual income
Drive Alone
Dropped Off by Relative/ Friend
Carpool/ Vanpool
Transit
Motor-cycle
Bi-cycle
Walk
Tele-commute/ Other
Grand Total
Annual Income
> $250,000
90%
2%
3%
0%
0%
2%
2%
0%
100%
$200,001 - $250,000
87%
3%
2%
0%
1%
2%
3%
2%
100%
$160,001 - $200,000
88%
5%
3%
0%
1%
1%
1%
0%
100%
$130,001 - $160,000
86%
5%
6%
0%
0%
1%
2%
0%
100%
$100,001 - 130,000
83%
6%
5%
1%
1%
2%
2%
1%
100%
$80,001 - $100,000
86%
6%
3%
0%
1%
1%
2%
1%
100%
$60,001 - $80,000
82%
6%
5%
1%
1%
2%
2%
1%
100%
$40,001 - $60,000
82%
6%
4%
2%
0%
1%
4%
0%
100%
$20,001 - $40,000
78%
7%
3%
2%
1%
2%
6%
0%
100%
$12,000 - $20,000
74%
8%
5%
4%
0%
4%
6%
0%
100%
< $12,000
61%
6%
5%
5%
0%
5%
20%
0%
100%
Table 8: Employee commute distances compared with those interested in switching to alternative modes if given special incentives One Way Commute One mile or less 1-3 miles 4-10 miles 11-15 miles 16-20 miles 21 miles or more Grand Total
Mode Switching with Incentives 1.5% 8.5% 25.8% 21.2% 13.9% 29.1% 100.0%
28
Table 9: Employee type and willingness to switch mode given specific incentives cross comparison Employment Type UAB Hospital Employee - Full time UAB Hospital Employee - Part time University Employee - Full time University Employee - Part time
Criteria Willing to Telecommute Willing to switch modes Total Willing to Telecommute Willing to switch modes Total Willing to Telecommute Willing to switch modes Total Willing to Telecommute Willing to switch modes Total
Total 248 1,236 2,459 14 140 248 512 1,216 2,734 32 135 299
Percent 10.1% 50.3% 5.6% 56.5% 18.7% 44.5% 10.7% 45.2%
The largest percentile of employees who would consider switching modes if given incentives (29.25%) travels 21 miles or more for their commute. From Table 9, over 50% UAB hospital employees—both full and part time—reported that they would be willing to switch to alternative modes, whereas about 45% of both full and part time university employees reported the same. Over 18% of university full time employees would be willing to switch to telecommuting instead of their normal mode. OPEN-ENDED RESPONSE SUMMARY Questions 20 from the employee survey and 21 from the student survey asked respondents to provide comments or ideas for improving transportation to and from UAB as well as on campus. For the employee survey, 2,791 (47%) respondents provided comments. Parking issues were the pivot topic for most responses totaling 1,122 comments representing nearly 40% of the total comments provided. The most raised issues about parking were cost, availability, and inconvenience or safety of remote parking. Many of the employees responding to the survey requested more parking spaces be provided on campus to satiate the shortage. Many respondents asked for parking decks located closer to the hospitals and for improved shuttle service from remote parking locations. Comments about public transit came second with 609 (22%) suggestions about the need for more, safe, and flexible transit options. Suggestions included introducing a light rail system and sheltered bus stops with accessible sidewalks and bike share facilities. Additional 206 (7%) comments were received regarding UAB Blazer Express. Respondents suggested route optimization and increased frequency for buses, especially near the medical area. Respondents also suggested realigning as many as Blazer Express stops with the public transit stops. Furthermore, 94 (3%) comments received about more sponsorship and promotion of rideshare options. Finally, 55 (2%) respondents suggested that UAB should promote telecommuting (work from home) especially for desk jobs that do not need continuous or frequent presence at UAB. 29
Respondents also suggested that employees should be encouraged to telecommute and even be off offered incentives, as they will not be utilizing UAB resources as much by working remotely. For the student survey, 2,095 (51%) respondents provided comments and/or suggestions. Again parking issues dominated students’ comments with 1,369 (65%) comments focusing on parking and related issues. The most repeated comments were about parking availability for commuter students, and the need for relocating and optimizing parking lots/decks for classes’ proximity, as most students cannot find parking near those buildings where they have their classes at. Blazer Express also received attention from students with 143 (7%) comments. Most comments suggested increasing routes, route optimization, more frequent schedules, and weekend service. Additionally, 131 (6%) comments were received about bike facilities. Students suggested installing dedicated bike lanes across campus, and more secure (theft-proof) bike corrals. Also, students suggested optimizing the locations of bike corrals and bike-share facilities with respect to educational buildings and bus stops. Furthermore, 75 (4%) comments were received regarding transit options and making off-campus areas more accessible to students living on campus. Finally, 48 (2%) student respondents offered comments related to pedestrian facilities. Comments suggested the realignment of crosswalks and reprogramming traffic signals to allow dedicated pedestrian phases with adequate walk time. SUMMARY CONCLUSIONS AND RECOMMENDATIONS Analysis of over 10,000 questionnaire responses revealed that UAB employees and students are currently heavily automobile-dependent for their commute to UAB with over 88% of employees and 82% of students reporting commuting solo to UAB on their private vehicle. Students and employees both reported that the most important factors they consider when choosing a mode are reliability, time, and convenience. Even though the overwhelming majority of students and employees drive alone to UAB currently, UAB commuters appear receptive of the idea of shifting to more sustainable transportation modes such as carpools, vanpools, and transit, should such modes given availability, convenience and potential incentives. In fact, while only a 5% percentage of UAB commuters are currently involved in organized ridesharing, approximately 20% of solo drivers expressed an interest and desire to consider ridesharing alternatives, should an opportunity and incentive is presented to them. Moreover, an additional 15% of employees and 13% of students are willing to share a ride to the UAB campus with a relative or friend. It is recommended that UAB and CommuteSmart work together and target these populations with marketing plans and incentives to encourage mode switching. Further analysis of commuter survey data using cluster analysis techniques can provide valuable additional information about where UAB commuters origins and characteristics. This, in turn, can assist in strategically marketing ridesharing options in areas with high concentration of employees, thus reducing solo driving commutes to UAB campus in the future. Employees also expressed an interest in telecommuting, another excellent way to reduce commuting trips to campus. Telecommuting has been embraced by many large corporations
30
around the globe as a strategy to increase employee productivity and lessen time wasted in traffic, reduce operational expenses, and provide flexibility and choice in support of better work-life balance policies. For these reasons, as well as for reducing the potential congestion and parking demand burden on the UAB campus, it is recommended that UAB administrators and policy makers take steps to allow flexible work schedules and encourage telecommuting options for employees and distance learning options for students in the near future. A large percentage of UAB commuters driving alone reside in the Hoover and Vestavia areas where transit service is limited or non-existing. Thus, there is a need to further study the needs and opportunities to broaden transit presence in these areas, and increase availability and frequency of service. It also may be beneficial to target these populations with marketing plans and incentives to educate them about available commuting options and encourage mode switching. Under current conditions, most faculty (88%) and most students (94%) do not use the Blazer Express to move around campus. This could be because the users are not aware of benefits of using the service and/or the buses routes and schedules do not properly serve user needs. It is recommended that this issue is further investigated as actions may be needed to increase Blazer Express ridership and optimize routes in response to user needs. It should be noted that 20% of students and faculty expressed interest in either improved “Blazer Express bus service” or “More information on BJCTA and Blazer Express bus routes,” indicating that there is an interest in bus transit within the UAB community. Infrastructure improvements to support alternative transportation options on and around campus, such as sidewalks, bicycle lanes, transit stop shelters etc. are also essential. From the open ended response portion of the survey, most students and employees commented on the pressing need for improving parking practices at UAB, with special attention to cost restructuring, availability, and convenience of parking spaces around campus. Currently, the UAB Parking and Transportation Services department operates more than 84 off-street parking lots providing 12,645 spaces for parking where permits are mandatory. There are several miles of metered on-street parking spaces within UAB administered by the Birmingham Parking Authority. These spaces are intended primarily for commuters visiting the campus for a short period like one class. Other parking options include free, unrestricted, on-street parking spaces on campus and the vicinity of UAB which have the capacity to accommodate a large number of vehicles. Deducing from the questionnaire responses of the students and employees of UAB, it can be concluded that the university should implement a comprehensive parking management strategy that focuses both on the parking supply and parking demand sides in order to address current and future parking needs of the UAB commuters. Such an approach will address current concerns and future needs for parking while maintaining a more sustainable and livable university environment for all. In response to the results from the rest of the study, a recommendation is to incentivize students and employees to switch modes by marketing the convenience of not having to find 31
parking on campus if alternative transit modes were chosen. Another recommendation could be incentivizing students and employees with less expensive parking passes, or passes for special lots, if the commuters were willing to use alternative modes of transportation on specific days of their weekly commute. For example, if a university employee decided to commute two days per week using carpool, ride sharing, or transit, the employee could be given a less expensive parking pass for the other three days in the week during which he/she drove alone. Overall, the study collected and documented commuting patterns at UAB in order to benchmark current practices and preferences and help the University, as well as city and regional transportation partners, to better plan for transportation needs of the UAB community in the near- and long-term future.
REFERENCES Eom, J. K., Stone, J. R., & Ghosh, S. K. (2009). Daily Activity Patterns of University Students. Journal of Urban Planning and Development, 135(4), 141-149. doi: 10.1061/(ASCE)UP.1943-5444.0000015 Ma, Y. (2015). Travel Patterns of University Students in North Carolina. (Master of Science Thesis), University of North Carolina at Chapel Hill, Chapel Hill, NC. Tripp Umbach Associates. (2010). The Economic Impact of UAB: Current and Projected Economic, Employment, and Government Revenue Impacts : Final Executive Report (FY 08-09 and FY 19-20). Birmingham, AL: University of Alabama at Birmingham. VHB, P.C., & University of Norch Carolina at Chapel Hill (UNC Chapel Hill). (2013). 2013 UNC Campus Commuting Survey. Chapel Hill, NC: UNC Chapel Hill. Wang, X., Khattak, A. J., & Son, S. (2012). What Can Be Learned from Analyzing University Student Travel Demand? Transportation Research Record: Journal of the Transportation Research Board, 2322, 129–137. doi: 10.3141/2322-14
32
APPENDIX
33
UAB Student Commuting Patterns 1. Welcome to the UAB Commuting Survey
Thank you for taking a few moments to complete this survey about your daily commute to UAB. Your feedback is very important as it will help UAB to better understand commuting patterns and needs of employees and students.If you complete the survey by Friday, November 13th, 2015 you will be eligible to win one out of ten $50 VISA gift cards. Participation is voluntary. The survey takes approximately 5-6 minutes to complete. All responses will be treated as confidential and exempt from public disclosure by law. Whether or not you take part in this survey is your choice. There will be no penalty if you decide not to participate and you will not lose any benefits you are otherwise owed. Your kind assistance in providing input through this survey is greatly appreciated. If you have any questions, please do not hesitate to contact me. Thank you for your valuable assistance. Dr. Virginia P. Sisiopiku, Associate Professor & Transportation Program Director Civil, Construction, and Environmental Engineering University of Alabama at Birmingham Phone: 205 934-9912; E-mail:
[email protected] The survey is used for research purposes and the protocol number is E150901004. You should be 18 or older to participate. If you have questions about your rights as a research participant, or concerns or complaints about the research, you may contact the UAB Office of the IRB (OIRB) at 205 934-3789 or toll free at 1-855-860-3789. Regular hours for the OIRB are 8:00 a.m. to 5:00 p.m. CT, Monday through Friday. You may also call this number in the event the research staff cannot be reached or you wish to talk to someone else.
UAB Student Commuting Patterns 2. UAB Student Commuting Survey
1. How far is your typical commute to UAB (one way)? One mile or less
11-15 miles
1-5 miles
16-20 miles
6-10 miles
21 miles or more
2. What is your average commute time to get to UAB? 10 minutes or less
40-50 minutes
11-20 minutes
50-60 minutes
21-30 minutes
61-75 minutes
31-40 minutes
over 75 minutes
3. How do you enter the UAB campus? From I-65 Northbound (traveling from the south)
From an arterial street
From I-65 Southbound (traveling from the north)
I live on campus
From US 280 Other (please specify)
4. In a typical week, how often do you commute to UAB? 5 days per week
5 nights per week
4 days per week
4 nights per week
3 days per week
3 nights per week
1 to 2 days per week
1 to 2 nights per week
5. What is your travel schedule on a typical travel day? hh
mm
AM/PM
Leave home for UAB
:
-
Leave UAB for home
:
-
6. In a typical week day, how do you travel to UAB? Drive alone
Motorcycle
Dropped off by relative/friend
Bicycle
Organized carpool/vanpool
Walk
Transit
Other
7. If alternative options were available, how do you prefer to travel to UAB? Drive alone
Motorcycle
Dropped off by relative/friend
Bicycle
Organized carpool/vanpool
Walk
Transit
Other
8. How important is each of the following factors in selecting your regular travel mode to work (car, bus, walk, etc.)? Not important Cost (in dollars) Time Convenience Reliability Safety Environmental impacts
Neutral
Very important
9. If you rarely carpool, use transit, bike, or walk to UAB, what are the reasons? Select all that apply. Reason I do not carpool because I do not use transit because I do not bike to campus because I do not walk to campus because
10. If you drive to UAB, do you typically (answer all): Yes
No
Drive alone Park in a parking lot, deck, or metered parking space Park on the street for free Move your car during the day Use Blazer Express to move around campus
11. Where do you live? City Nearest intersection (e.g. Hickory Trc and Magnolia Dr) Zip Code
12. Where do you take most of your classes or do most of your work while at UAB? Building Name Nearest intersection (e.g. Hickory Trc and Magnolia Dr) Campus code
13. What is your gender? Female Male
14. What is your age bracket? 17 or less
18 to 24
25 to 34
35 to 44
45 to 54
55 to 64
65 or more
15. Are you a Freshman
Sophomore
Junior
Senior
Graduate student
Professional student
16. Do you live Alone
With roommate
With spouse
With parents
17. Which of the following best describes your current status? Full time student
Not currently enrolled
Part time student
18. Do you have a job? Job type On Campus Off Campus
19. How many of the following do you own? Number Cars/vans Motorcycles Bicycles
20. Which of the following would you like to see more on the UAB campus? Check all that apply. Parking places
Bicycle racks
Ride-sharing options
Green spaces; pedestrian facilities
Bicycle lockers
BJCTA bus stops
Blazer Express bus service
Bike share stations
Information about BJCTA and Blazer Express schedules
Other (please specify)
21. What suggestions do you have for improving transportation to/from and on the UAB campus?
UAB Student Commuting Patterns 3. UAB Student Commuting Survey
22. Ten (10) survey participants will win a $50 VISA gift card. If you are interested, please provide your contact information below (optional). Name Email Address Phone Number
Thank you for taking time to fill out this important survey. Your feedback is greatly valued. Please use the button below to submit your answers.
UAB Employee Commuting Patterns 1. Welcome to the UAB Commuting Survey
Thank you for taking a few moments to complete this survey about your daily commute to UAB. Your feedback is very important as it will help UAB to better understand commuting patterns and needs of employees and students.If you complete the survey by Friday, November 13th, 2015 you will be eligible to win one out of ten $50 VISA gift cards. Participation is voluntary. The survey takes approximately 5-6 minutes to complete. All responses will be treated as confidential and exempt from public disclosure by law. Whether or not you take part in this survey is your choice. There will be no penalty if you decide not to participate and you will not lose any benefits you are otherwise owed. Your kind assistance in providing input through this survey is greatly appreciated. If you have any questions, please do not hesitate to contact me. Thank you for your valuable assistance. Dr. Virginia P. Sisiopiku, Associate Professor & Transportation Program Director Civil, Construction, and Environmental Engineering University of Alabama at Birmingham Phone: 205 934-9912; E-mail:
[email protected] The survey is used for research purposes and the protocol number is E150901004. You should be 18 or older to participate. If you have questions about your rights as a research participant, or concerns or complaints about the research, you may contact the UAB Office of the IRB (OIRB) at 205 934-3789 or toll free at 1-855-860-3789. Regular hours for the OIRB are 8:00 a.m. to 5:00 p.m. CT, Monday through Friday. You may also call this number in the event the research staff cannot be reached or you wish to talk to someone else.
UAB Employee Commuting Patterns 2. UAB Employee Commuting Survey
1. How far is your typical commute to UAB (one way)? One mile or less
11-15 miles
1-3 miles
16-20 miles
4-10 miles
21 miles or more
2. What is your average commute time to get to UAB? 10 minutes or less
40-50 minutes
11-20 minutes
50-60 minutes
21-30 minutes
61-75 minutes
31-40 minutes
over 75 minutes
3. How do you enter the UAB campus? From I-65 Northbound (traveling from the south)
From an arterial street
From I-65 Southbound (traveling from the north)
I live on campus
From US 280 Other (please specify)
4. In a typical week, how often do you commute to UAB? 5 days per week
5 nights per week
4 days per week
4 nights per week
3 days per week
3 nights per week
1 to 2 days per week
1 to 2 nights per week
5. What is your travel schedule on a typical travel day? hh
mm
AM/PM
Leave home for UAB
:
-
Leave UAB for home
:
-
6. In a typical week day, how do you travel to UAB? Drive alone
Motorcycle
Dropped off by relative/friend
Bicycle
Organized carpool/vanpool
Walk
Transit
Telecommute/Other
7. If alternative options were available, how do you prefer to travel to UAB? Drive alone
Motorcycle
Dropped off by relative/friend
Bicycle
Organized carpool/vanpool
Walk
Transit
Telecommute/Other
8. How important is each of the following factors in selecting your regular travel mode to work (car, bus, walk, etc.)? Not important Cost (in dollars) Time Convenience Reliability Safety Environmental impacts
Neutral
Very important
9. If you rarely carpool, use transit, bike, or walk to UAB, what are the reasons? Select all that apply. Reason I do not carpool because I do not use transit because I do not bike to campus because I do not walk to campus because
10. If you drive to work, do you typically (answer all): Yes
No
Drive alone Park in a parking lot, deck, or metered parking space Park on the street for free Move your car during the workday Use Blazer Express to move around campus
11. If you currently drive alone, would you consider switching to carpooling or transit use if Gas price hits $4/gallon Special incentives were available (monetary, benefits, etc.) I wouldn't consider switching my travel mode I already use alternative transportation modes
12. Where do you live? City Nearest intersection (e.g. Hickory Trc and Magnolia Dr) Zip Code
13. Where do you work? Building Name Nearest intersection (e.g. Hickory Trc and Magnolia Dr) Campus code
14. What is your gender? Female Male
15. What is your age bracket? 17 or less
18 to 24
25 to 34
35 to 44
45 to 54
55 to 64
65 or more
16. Which of the following best describes your current occupation? UAB Hospital Employee - Full time
UAB Hospital Employee - Part time
University Employee - Full time
University Employee - Part time
17. How many of the following do you have in your household? Number Adults (including yourself) Children Cars/vans Motorcycles Bicycles
18. Which of the following best describes the total annual income of your household (before taxes)?
19. Which of the following would you like to see more on the UAB campus? Check all that apply. Parking places
Bicycle racks
Ride-sharing options
Green spaces; pedestrian facilities
Bicycle lockers
BJCTA bus stops
Blazer Express bus service
Bike share stations
More information on BJCTA and Blazer Express schedules
Other (please specify)
20. What suggestions do you have for improving transportation to/from and on the UAB campus?
UAB Employee Commuting Patterns 3. UAB Employee Commuting Survey
21. Ten (10) survey participants will win a $50 VISA gift card. If you are interested, please provide your contact information below (optional). Name Email Address Phone Number
Thank you for taking time to fill out this important survey. Your feedback is greatly valued. Please use the button below to submit your answers.