Ubiquitous Computing for Sustainable Energy (UCSE2010) A workshop at 12th ACM International Conference on Ubiquitous Computing (Ubicomp 2010) Sunday 26th September 2010
Albrecht Schmidt, Adrian Friday, Hans Gellersen, Friedemann Mattern
Ubiquitous Computing for Sustainable Energy (UCSE2010) A workshop at 12th ACM International Conference on Ubiquitous Computing (Ubicomp 2010) Sunday 26th September 2010
Organizers Albrecht Schmidt University of Duisburg-Essen
[email protected] Adrian Friday Lancaster University
[email protected] Hans Gellersen Lancaster University
[email protected] Friedemann Mattern ETH Zürich
[email protected]
Copyright is held by the author/owner(s).
Summary and Theme
Providing sustainable energy is a central challenge for mankind. The problems faced are inherently multidisciplinary and relate to technology, economics, psychology, and human values and we believe that Ubicomp research – with its approach and methodology as well as with its technologies – can make an important contribution. With renewable sources we see changes towards a more decentralised and fluctuating production of energy. Solar and wind powered energy supplies are examples where the availability is basically unlimited but actual availability differs greatly over time (e.g. between day and night). Informed users, who understand the impact of their energy usage and for whom the implications of consuming energy at a certain moment becomes accessible may act very differently. Similarly smart devices and networked systems can potentially adapt to available resources. Overall we see a potential that Ubicomp research can contribute to reduce the energy demand of society and to provide means for a better utilisation of renewable energy sources.
2
Topics 1) Understanding and motivating users of energy systems
Ethnographic studies on energy usage, Assessments of values and constraints users have, Surveys and studies on energy usage in the context of Ubicomp and Experience reports
2) Smart energy systems and technologies
Concepts and technologies for smart energy systems, Experience with smart energy production, Intelligent and adaptive energy consumers, Interaction between users and smart energy systems and User interfaces for energy systems
3) Intelligent energy infrastructures
Ubicomp technologies for smart grid infrastructures, Smart metering technologies and applications, Security and privacy in intelligent energy systems and Local (in-house) smart energy infrastructures
4) Socio-Economic drivers and incentives
Models and explanations for energy usages, Systems and technologies to foster energy awareness and Persuasive technologies in the energy domain
http://www.hcilab.org/events/ucse2010
3
Table of Contents Title and Authors
Page
Ubiquitous Computing for Sustainable Energy (UCSE2010)
5
A Survey and Thought-Provoking Impulses on Tackling Energy Efficiency in Households and Office Spaces
9
Albrecht Schmidt, University of Duisburg-Essen Adrian Friday and Hans Gellersen, Lancaster University Friedemann Mattern, ETH Zürich
Amro Al-Akkad, Fraunhofer Institute for Applied Information Technology FIT
Supporting Sustainable Living: Aware Homes and Smart Occupants
16
Adaptive thermal modelling for buildings
26
Take a Closer Look - The Role of the User in Ubiquitous Smart Energy Systems
29
User Created Machine-readable Policies for Energy Efficiency in Smart Homes
35
Monitoring Smart Building Performance Using Simulation and Visualisation
41
Domestic Energy: Practices and Consumption
48
Persuasive End-User Energy Management
51
Towards a PowerPedia – A Collaborative Energy Encyclopedia
53
Lyn Bartram, Johnny Rodgers and Rob Woodbury, School of Interactive Arts + Technology, Simon Fraser University
Carl Ellis and Mike Hazas, Computing Department, Lancaster University
Marco Jahn, Fraunhofer Institute for Applied Information Technology FIT
Vikash Kumar, Anna Fensel, Slobodanka Tomic, The Telecommunications Research Center Vienna (FTW) Rene Mayrhofer, eSYS Information Systems Tassilo Pellegrini, Semantic Web Company
Kris McGlinn, David Lewis, Eleanor O’Neill, Declan O’Sullivan, Trinity College Dublin Marcus Keane and Edward Corry, National University of Ireland
Janine Morley, Computing Department, Lancaster University
Johann Schrammel and Manfred Tscheligi, CURE - Center for Usability Research and Engineering
Markus Weiss and Adrian Merkle, Institute for Pervasive Computing, ETH Zurich Thorsten Staake and Elgar Fleisch, Information Management, ETH Zurich
4
Ubiquitous Computing for Sustainable Energy (UCSE2010) Ubicomp 2010 Workshop
Albrecht Schmidt
Abstract
University of Duisburg-Essen
Providing sustainable energy is one of the fundamental challenges for mankind. With energy usage being a part of everyday activities and with the increasingly diversity of energy creation this is an inherently multidisciplinary problem. Transportation and travel, heating and cooling, manufacturing and production are major areas in which energy is used and all these domains become more and more linked to ubiquitous computing. With an increase in decentralized energy provision, ranging from energy harvesting in devices to personal green power plants, a great potential for creating sustainable energy arises, however at the cost of a higher complexity of the distribution network and storage mechanisms. Overall we believe that research in ubiquitous computing can provide important contributions for a world with sustainable energy. In this workshop we hope to get people from different disciplines together to share their visions and insights on how to conserve, efficiently produce, use, and distribute energy.
[email protected] Adrian Friday Lancaster University
[email protected] Hans Gellersen Lancaster University
[email protected] Friedemann Mattern ETH Zürich
[email protected]
Keywords Copyright is held by the author/owner(s).
e-Energy, smart energy, smart grid, energy conservation, green ICT, energy efficiency, energy harvesting
5
ACM Classification Keywords J.m [Computer Applications] Miscellaneous, J.7 [Computers in Other Systems], H.5.2 [User Interfaces].
General Terms Design, Economics, Human Factors, Measurement
Introduction and Motivation Ubiquitous computing is a part of everyday life. Computers are embedded and intrinsic to the myriad of devices and machines we use, ranging from communication and entertainment devices to transportation and production systems. Our energy consumption is strongly and increasingly linked to activities that we carry out while using computerized devices and systems [1]. This opens up the opportunity to design these systems to conserve energy. One canonical example is heating and cooling the home. As such systems become programmable and as sensors become commonplace, systems can be made more efficient without losing quality: a heating system in a house that is aware of the whereabouts of the inhabitants can significantly decrease the needed energy [2, 3]. With devices such as fridges, washing machines and machinery becoming a part of the internet of things, further opportunities arise: devices can negotiate when to use energy with the supplier, e.g. based on a smart grid infrastructure. In this area ubiquitous computing is a central enabling technology for reducing energy consumption. We argue that energy usage should be one fundamental issue that is taken into account when designing systems. Research shows that users’ behavior and users’ awareness of their impact is important to motivate a more sustainable behavior [4]. Driving a car more
economically or sharing a ride (e.g. 3 people in one car instead of 3 cars) can massively reduce energy consumption. Here we see that ubiquitous computing technologies offer many approaches to take the energy users “in the loop” and to make them more aware of opportunities for saving energy. With many renewable energy resources such as solar power and wind power and approaches for energy harvesting [5], we move away from energy that is always on and always available at the same cost (e.g., like in traditional power plants). This leads to a model of a highly distribute energy generation – in communities (e.g. a local wind farm), in houses (e.g., solar panels on the roof), or even by individual devices (e.g., a backpack that charges a phone while walking). This model creates new opportunities to make the energy more sustainable, but at the same time increases the complexity of energy provision to devices and systems. Here too, ubiquitous computing and ubiquitous networks can offer solutions and key building blocks. A further area in which a lot of energy is used is manufacturing and production. This ranges from food to everyday objects and buildings. According to [6], a significant part of energy goes into the production and transportation of the things we buy. Here an interesting question is how we can use ubiquitous computing technologies to reduce the need for things or to make them last longer or to promote sharing within a local community. Technologies can help to increase awareness and on facilitate the more efficient use of things that are already produced.
6
Relevant Topics The small set of examples in the introduction shows that this area of research is very broad but inherently linked to ubiquitous computing research. We categorize the topics of interest into four areas: 1) Understanding and motivating users of energy systems to consider sustainability as a central concern. Here we expect that ethnographic studies on energy usage can help to increase our understanding of how to develop future systems that put users more in control and increase their responsibility of energy consumption. Such investigations should make assessments of values and constraints that users have and aim at uncovering practices and their rationale. We expect studies and surveys contributed to the workshop to provide the community with new insights. 2) Smart energy systems and technologies are a main topic for many systems and device researchers. The development of new concepts and technologies for smart energy systems poses many technological and business challenges. We hope that by sharing experiences with smart energy production systems and intelligent and adaptive energy consumers new ideas will be spread. User interfaces for energy systems and the interaction between users and smart energy systems link to the first topic and are critical to getting users into the loop and making them aware of their options and responsibilities. 3) Intelligent energy infrastructures, as realized in smart grid technologies and smart meter installations are only a starting point for new infrastructures. We
expect that ubicomp technologies offer new opportunities for smart grid infrastructures and enable new and more fine-grained approaches for smart metering technologies and applications. Important issues include security and privacy in intelligent energy systems as they will massively impact the user acceptance of new energy systems. In addition to large-scale infrastructures there will be new challenges in local (in-house) smart energy infrastructures. 4) Socio-Economic drivers and incentives are further important topics that need to be considered when creating new energy systems. Energy has a huge associated economic factor - in the budget of individuals as well as from a national or international economic perspective. We expect that researchers will discuss new models and explanations for energy usage, systems and technologies to increase energy awareness. There is a clear link to persuasive technologies in this field.
Goals and Expected Audience The goal of this workshop is to bring together researchers and practitioners with different backgrounds that relate to sustainable energy systems. We expect that in order to move forward in this topic we must bring together ideas and research from energy systems, human computer interaction, economics, and ubiquitous computing. The common ground is the interest in ubiquitous computing technologies in the energy domain. The overall aim of the workshop is to foster a community in Ubiquitous Computing for Sustainable Energy and to facilitate interaction.
7
Conclusion In summary, it is clear that sustainable energy is a central challenge for mankind. The problems faced are inherently multidisciplinary and relate to technology, economics, psychology, and human values and we believe that Ubicomp research – with its approach and methodology as well as its technologies – can make an important contribution. With renewable sources we see changes towards a more decentralized and fluctuating production of energy. Solar and wind powered energy supplies are examples where the availability is basically unlimited but actual availability differs greatly over time (e.g. between day and night). Informed users, who understand the impact of their energy usage and for whom the implications of consuming energy at a certain moment becomes accessible may act very differently. Similarly smart devices and networked systems can adapt to best share available resources. Overall we see a potential that Ubicomp research can contribute to reduce the energy demand of society and to provide means for a better utilization of renewable energy sources.
Energy-Efficient Computing and Networking (Passau, Germany, April 13 - 15, 2010). e-Energy'10. ACM, New York, NY, 1-10. 2010. 2.Gupta, M., Intille, S. S., Larson, K.: Adding GPSControl to Traditional Thermostats: An Exploration of Potential Energy Savings and Design Challenges. In Proceedings of the 7th international Conference on Pervasive Computing (Nara, Japan, May 11 - 14, 2009). H. Tokuda, M. Beigl, A. Friday, A. J. Brush, and Y. Tobe, Eds. Lecture Notes In Computer Science, vol. 5538. Springer-Verlag, Berlin, Heidelberg, 95114. 3.Intille, S. S.: Designing a Home of the Future. IEEE Pervasive Computing 1, 2 (Apr. 2002), 76-82. 4.Abrahamse, W., Steg, L., Vlek, C., Rothengatter, T.: A review of intervention studies aimed at household energy conservation. Journal of Environmental Psychology. Vol. 25, 273-291. 2005. 5.Paradiso, J. A., Starner, T.: Energy Scavenging for Mobile and Wireless Electronics. IEEE Pervasive Computing, vol. 4, no. 1, pp. 18-27, Jan.-Mar. 2005. 6.MacKay, D: Sustainable Energy – without the hot air. http://www.withouthotair.com/. Accessed 06’2010.
REFERENCES 1.Mattern, F., Staake, T., Weiss, M.: ICT for green how computers can help us to conserve energy. In Proceedings of the 1st international Conference on
8
A Survey and Thought-Provoking Impulses on Tackling Energy Efficiency in Households and Office Spaces Amro Al-Akkad
Abstract
Fraunhofer Institute for Applied In-
This paper is divided into two parts. First, it conducts a survey on how information and communication technology (ICT) have recently been applied for gaining more energy efficiency in households and office spaces. And second, it moots some new thought-provoking impulses on how to proceed with applying ICT to support more sustainable energy-efficient developments for domestic and corporate environments.
formation Technology FIT Schloss Birlinghoven 53754 Sankt Augustin
[email protected]
Keywords Energy efficiency, productivity, wasted energy, LEED, context-awareness
ACM Classification Keywords H5.m. Information interfaces and presentation (e.g., HCI): Miscellaneous.
General Terms Survey, Thought-provoking Impulses, Human Factors Copyright is held by the author/owner(s).
Introduction
Space reserved for
Energy is an integral part of almost all actions of our lives. Although energy is such a valuable resource, it might become in the long-run scarcely available to
ACM copyright notice
9
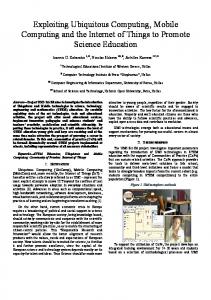
NET3. Summing up their broader focus is on saving energy and by this reducing the global carbon footprint as well. In this sense, many applications have been designed and evaluated that manage the user-centric intelligent monitoring and interactive control of energy consumption in domestic or corporate environments. Basically, often the electrical energy has been the main focus—with good cause, as 40% of energy consumed is electrical energy, and moreover this figure is estimated to rise for the next few decades [15]. In general, the outcome of those scenarios is to reveal energy hogs in households or office spaces. For this technically often off-the-shelf smart meter plugs are deployed that can capture in near real-time consumed energy and communicate this with wireless communication radio, e.g. Bluetooth or ZigBee to some application specific gateway; suppliers of smart meter plugs are Plogg4, or Plugwise5. All those applications [3,8,9,10,16] differ in their specifics, though in their essentials all target mainly two goals. First, to visualize energy consumption from a human-computer interaction perspective through intuitive or user-friendly interfaces respectively. And second, as a cause of this newly created transparence, to increase energy awareness of users within a given space.
humans: Estimates yield that for the year 2030 the global energy demand will double. And in addition, energy related greenhouse gas emissions are expected to rise up to around 55 percent than today [7]. In particular, the building sector constitutes a significant portion of the overall consumed energy; and, this fact refers to both developing and industrial countries [17]. In the style of Taherian et al. a human-centric approach will be applied to examine energy efficiency. At this, the focus of this paper is on households (domestic) and office spaces (corporate). Although, domestic and corporate environments are partly different, both also complement each other by involving humans strongly in actions taking place that demand energy [14]. This paper is divided into two parts. First, it conducts a survey on how information and communication technology (ICT) have recently been applied for gaining more energy efficiency in households and office spaces. And second, it moots some new thought-provoking impulses on how to proceed with applying ICT to support more sustainable energy-efficient developments for domestic and corporate environments.
Survey Fortunately, in the recent years the research community realized several mobile and ubiquitous prototypical applications that demonstrate examples for driving energy efficiency [3,8,9,10,16]. Solely, the European Union has funded several research projects dealing with how to apply ICT for gaining more energy efficiency, only to name a few: BeAware1, beywatch2, or CITY-
In the last decade, in industry many start-ups and spinoffs have started to emerge setting themselves the goal to build smart energy solutions. These solutions shall facilitate to reduce the overall energy consumption following the vision of becoming a green world. Several 3
CITYNET Project, http://citynet.zafh.net/ Plogg, http://www.plogginternational.com/ Plugwise, http://www.plugwise.com/
1
BeAware Project, http://www.energyawareness.eu/beaware/
4
2
beywatch Project, http://www.beywatch.eu/
5
10
companies, e.g. Crestron6, Honeywell7, or Lutron8 offer already customized solutions that are often summarized under the term building management or home automation systems. Further, large network providers, telecommunication and software companies, or not least energy providers have built small joint ventures dealing specifically with energy efficiency. Often those machined solutions represent sophisticated set-ups that are fine-tuned against a specific user profile. For instance, a little part of such a smart energy system could be a mechanism that regulates the electrical light inside a building according to the daytime and calendar date, or amount of brightness.
Productivity Productivity is one essential economic characteristic number. It forms the quotient: output / input. Energy costs belong to the input. For a company it is important to keep this figure high in order to run a business that is profitable, i.e. mathematically formulated: Productivity>1. Hence, from a business perspective for a company it might be unimportant if the energy consumption rises, as long the productivity rises proportionally. Wasted Energy This figure refers to the amount of energy that is used ineffectively while providing a certain service. For instance, if an air condition would cool an empty office room for the next two hours, as the person by whom the room is generally occupied forgot to switch it off.
Energy relevant parameters Below some energy relevant parameters will be defined to avoid any misunderstandings in the next chapter.
Varying energy pricing In future, energy providers will charge customers for varying energy prices, e.g. ‘time of day pricing’, or depending on the amount of natural resources that has been used to produce energy. In the United States flexible energy price tariffs are already in practice, e.g. at Alabama Power9 or ComEd10. For customers who agreed on a real-time pricing tariff the price changes are projected at least one day in advance. Customers have already been able to cut costs up to 15%, and by this at the same time contributed to reduce the total pollution from power plants [13].
Energy consumption This describes the amount of energy, expressed in kilowatt per hour (kW / h), that is required, e.g. to use different appliances in private households. Physically the term energy efficiency is incorrect, as in an integrated circuit energy cannot be consumed, but only be transformed. Correct notations should rather be energy demand or energy requirement. Though, for the sake of simplicity energy consumption has permeated. Energy consumption in households or office spaces typically comprises: heating, cooling, lightning, cooking, or miscellaneous electric loads resulting from using electric devices or appliances. 6
Crestron Electronics, http://www.crestron.com/
7
Honeywell, http://www51.honeywell.com/honeywell/
9
8
Lutron, http://www.lutron.com
10
Alabama Power, http://www.alabamapower.com/ ComEd, http://www.thewattspot.com/
11
Leadership in Energy and Environmental Design Leadership in Energy and Environmental Design11 (LEED) is a classification scheme for an energy- and eco-friendly development of buildings. A building can be classified into four quality levels: certified, silver, gold and platinum.
Middleware The use of a middleware layer hiding the details of the different technologies dealing with energy literacy and control is fundamental to exempt programmers from details that are not directly pertinent to their focus, which is the application development itself enabled by a given infrastructure. For instance, in [8] a generic middleware for networking embedded systems has been applied successfully for this purpose.
Discussion & Approaches All referred approaches represent good examples how ICT can drive energy efficiency in households and office spaces. Further, these applications may achieve a certain sustained success. For instance, these scenarios may help to detect energy guzzlers in private households that can be replaced by more efficient appliances. Also, a newly created energy awareness of users may help to change their personal behavior towards being more saving. In effect, the study of [2] showed that feedback on domestic energy consumption helped to yield savings in the range of 5-15%. However, future enhancements are required for tackling sustainably energy efficiency. Gap between research and industry Actually, academic research in energy efficiency is becoming somehow insular. A lot of systems are more or less redundant and built from scratch rather than on top of existing solutions. This is unfavorably fostered by existing industrial solutions that are often too expensive or per se reflect a too specific design, and thus constraining any openness. Hence, a rather lively exchange between research and industry would be more appropriate. Therefore, an approach would be to analyze available off-the-shelf solution in industry that can be extended by novel concepts conceived in research. 11
LEED, http://www.usgbc.org/DisplayPage.aspx?CMSPageID=1988
Exchange Standard So far, no common data exchange standard does exist for energy efficiency systems. However, a high degree of interoperability can establish data transfer, or beyond this the execution of distributed programs among coherent and isolated applications. A certified standard, something like the DLNA12 standard for multimedia, which solves to use digital media between different consumer electronic devices, is missing. The DLMS13 standard proves that it works to provide interoperable energy relevant data on the lower layer. Why do not provide something appropriate at the application layer? Control of Energy Usage Even if the user has the access to control and monitor in near real-time his energy consumption by the use of smart home applications, it is arguable that end-users will not be constantly able to update their specific profile due to time and further preferences; even, if energy providers will project prices one day in advance. A negative cause of fluctuations in real-time energy pricing could be that customers must fear to pay twice or three 12
DLNA, http://www.dlna.org
13
DLMS, http://www.dlms.com
12
times more than they normally would. However, by hindsight energy savings are not only favorable for customers to reduce their bills, but also for energy providers in order to cope better with peak hours. In fact, an alternative is that energy providers would have the permission to regulate specific electric appliances subtly for inhabitants in households and office spaces; for instance, in conjunction with telecommunication providers in order to benefit from an already available infrastructure. For example, an imperceptible regulation could be that an intelligent control unit of an energy provider initiates to reduce during peak hours only a little the strength of an air condition in households and office spaces. Indeed in Canada, there is already an endeavor in this direction. There, the nation’s public broadcaster aims at easing the pressure on the power grid by operating household appliances during off-peak hours from afar. The system is designed to use FM radio frequencies in order to send directives to household appliances, e.g. to turn on during night a wash machine, thus saving energy and reducing monthly bills [4]. Context-Awareness Eye-catching tools for supporting energy efficiency or even tools that simply require some explicit interaction with users might quite well support to improve the energy awareness of users. Though, at the same time such tools might distract users permanently from their intended actions and actual work focus. For instance, in office spaces such a distraction may affect negatively workers influence on the productivity of an enterprise. At this, context-awareness [1], as a fundamental cornerstone of ubiquitous computing, may help to put things right. Hence, it is interesting to start in rather single office rooms to study usual habits and actions of
inhabitants helping to evolve a certain user profile. Against this user profile and common interactions a context-aware framework may act implicitly [12] on behalf of users to support more energy efficiency, but at the same time balancing properly between the energy awareness of users and their effect on the productivity. A challenging task would be to figure out how to detect actions or behaviors that cause wasted energy. For instance, if an air condition is cooling an office room preparatory or for nothing. In this regard the empirical study of [5] shows how hard it is to employ a contextaware power management system for workers in office spaces that use desktop PCs, and further adding more sensors to improve context inference can actually increase the overall energy consumption. Physical Computing and HCI Physical Computing is an approach to learning how humans communicate through computers that starts by considering how humans express themselves physically [6]. There exist several sensor platforms, such as the Arduino14 platform or Contiki15. When trying to bring more energy efficiency into actions occurring in the daily routine of humans, sensors combined with an appropriate communication radio build an excellent fundament for a context-aware sensing module that can be linked over a dedicated protocol to an end-user (handheld) device. For instance, at [11] is explained how to build your own home-power monitoring system. Besides, establishing the sensing and connection between devices, the interaction of the system with its users needs to be addressed as well. Hence, users would be informed about consumed or wasted energy. 14
Arduino, http://arduino.cc/
15
Contiki, http://www.sics.se/contiki/
13
Depending on their context (e.g. busy or unengaged) the application would apply an adequate notification mechanism (unobtrusive or eye-catching). Sustainable energy standards The LEED standard is a good strategy to start for being energy efficient from the very beginning. Though, to provide a future-proof solution a further standard is required. Hence, a new challenge will be to define a sort of LEED for post-build occupancy, i.e. a standard that controls how energy- and eco-friendly the habitation and maintenance after the establishment of a building evolves. For this sensors can be installed to support the classifying of a building in such post-build occupancy LEED. Concerning this matter in planned new buildings sensors can be installed right from the start into the insides of a building.
Conclusion Energy efficiency is a fast growing research area and driver for industry as well. In this regard, some valuable contributions have already been developed, and further ongoing research projects indicate promising approaches. In this paper a survey is conducted on how ICT has been applied yet to foster energy efficiency. Furthermore, it is explained how ICT can support energy efficiency to yield more sustainable results. For this a number of diverse thought-provoking impulses are raised: To bring better together endeavors and results from research and industry.
To build applications on top of a middleware to ease application development.
To jointly agree upon an exchange standard at the application layer for a harmonized communication. To permit energy providers to operate building equipment and appliances from afar in order to avoid breakdowns of power grids during peak time. To employ context-aware applications those strive for increasing the energy awareness of users, but also do not hinder their influence on the productivity. To use context aware sensor modules those communicate with an end-user device (PDA, smart phone). To establish a ‘post-build occupancy’ LEED for gathering the energy efficiency of a building during habitation.
There is a great potential that ICT can contribute to foster energy efficiency in domestic and corporate environments. However, we need to view things with a broader horizon in order to yield sustainable results that will enable us to make greater leaps towards even more energy efficiency.
References [1] Abowd, G.D., Dey, A.K., Borwn, P.J., Davies, N., Smith, M. and Steggles, P. Towards a Better Understanding of Context and Context-Awareness. Proc. HUC 1999, Springer (1999), 304-307. [2] Darby, S. The effectiveness of feedback on energy consumption: A review for DEFRA of the literature on metering, billing and direct displays. Environmental Change Institute, University of Oxford (2006), 1-21. [3] Fischer, C. Feedback on household electricity consumption: a tool for saving energy? Feedback on household electricity consumption: a tool for saving energy? Springer (2008), 79-104.
14
[4] France-Presse, A. "E-Radio seeks to revolutionize energy consumption in Canada, http://www.mnn.com/earthmatters/energy/stories/e-radio-seeks-torevolutionize-energy-consumption-in-canada.", MNN (2010). [5] Harris, C. and V. Cahill. An empirical study of the potential for context-aware power management. Proc. UbiComp 2007. Springer (2007), 235-252. [6] Igoe, T. (2004 ). "hello. What Is Physical Computing?" Retrieved 24th June, 2010, http://www.tigoe.net/blog/what-is-physicalcomputing/. [7] International Energy Agency. World Energy Outlook 2008, http://www.worldenergyoutlook.org/. [8] Jahn, M., M. Jentsch, Prause, C., Pramudianto, F., Al-Akkad, A. and Reiners, R. The Energy Aware Smart Home. FutureTech 2010, IEEE (2010), 1-8.
smith/2010-04-22/real-time-pricing-can-cutelectric-costs, Evanston Now (2010). [14] Taherian, S., M. Pias, Coulouris G. and Crowcroft, J. Profiling energy use in households and office spaces. Proc. FIT4Green 2010, ACM Press (2010), 21-30. [15] U. S. Energy Information Administration. International Energy Outlook 2010, USA.gov (2010). http://www.eia.doe.gov/oiaf/ieo/highlights.html. [16] Weiss, M., Mattern, F., Graml, T., Staake, T. and Fleisch, E. Handy feedback: connecting smart meters with mobile phones. Proc. MUM 2009, ACM Press (2009), 1-4. [17] Wood, G. and M. Newborough. Dynamic energyconsumption indicators for domestic appliances: environment, behaviour and design. Energy and Buildings, Elsevier Science (2003), 821-841.
[9] Kanstrup, A. M. and E. Christiansen. User-driven Points for Feedback Motivated Electricity savings in Private Households. Poster session presented at Joint Actions on Climate Change. (2009), 1-10. [10] Karlgren, J., L. E. Fahl\, et al. (2008). Socially intelligent interfaces for increased energy awareness in the home. Proc. IOT 2008, Springer (2008), 263-275. [11] ladyada.net. "Tweet-a-Watt.", http://www.ladyada.net/make/tweetawatt [12] Schmidt, A. Implicit Human Computer Interaction Through Context Personal Technologies, Springer (2000), 191-199. [13] Smith, B. Real-time pricing can cut electric costs, http://evanstonnow.com/story/news/bill-
15
Supporting Sustainable Living: Aware Homes and Smart Occupants Lyn Bartram
Abstract
School of Interactive Arts + Technology
Awareness of resource consumption in the home is a key part of reducing our ecological footprint, yet lack of appropriate understanding and motivation often deters residents from behaviour change. We report on the design and implementation an in-home system that supports residents in awareness of resource use, facilitates efficient control of house systems, and encourages conservation in daily activities. Initial responses from deployments in two high-profile sustainable homes indicate the potential this holistic approach has in engaging residents in sustainable living. We present the design rationale for our approach, and discuss the challenges and opportunities we have addressed.
Simon Fraser University Surrey 250 -13450 102 Avenue Surrey, BC V3T 0A3 CANADA
[email protected] Johnny Rodgers School of Interactive Arts + Technology Simon Fraser University Surrey 250 -13450 102 Avenue Surrey, BC V3T 0A3 CANADA
[email protected] Rob Woodbury School of Interactive Arts + Technology Simon Fraser University Surrey
Keywords
250 -13450 102 Avenue
Sustainability, occupant engagement, interactive ecosystem, resource conservation, behaviour change.
Surrey, BC V3T 0A3 CANADA
[email protected]
ACM Classification Keywords H.5.2 [Information Interfaces and Presentation]: User Interfaces. Copyright is held by the author/owner(s). UbiComp 2010, September 26–29, 2010, Copenhagen, Denmark.
General Terms
ACM 978-1-4503-0283-8/10/09.
Design, Human Factors
16
Introduction A sustainable home is more than an efficient building: it is also a living experience that encourages occupants to use fewer resources more effectively. Research has shown that small changes in behaviour, such as turning off lights, reducing heat and uncovering or covering windows, can result in energy savings between 10% and 20% [31]. But changing the way we use resources is proving challenging. We envision the combination of alternative energy with pervasive and interactive technologies for feedback and control as a powerful vehicle for reducing energy demand and building a conservation ethic. These technologies and patterns of use are the focus of recent research [2],[4],[7],[28],[32] but knowledge of how they should be most effectively integrated into sustainable home design is in its infancy [7],[31]. We seek to enable occupants in making appropriate resource use decisions without imposing undue technological complexity or effort. In this paper we describe the design and first implementations of EcoControl and ALIS, a combined system to support and encourage sustainable living practices. Our experience in implementing the system in two unique houses has provided us with insights into the design challenges of embedding technology in people’s homes, and left us with key questions regarding evaluation and metrics for success.
A Tale of Two Houses These insights into building information and control systems for the aware resident arise from our involvement in the design and implementation of two sustainable homes: North House and West House. North House [22] is a solar-powered home that placed 4th overall in the 2009 Solar Decathlon in Washington,
D.C. With the objective of achieving net-zero performance (producing at least as much energy as it consumes) in the challenging Canadian climate, North House incorporates sophisticated custom energy systems, adaptive building envelope technologies, specialized lighting and climate systems, and automated optimization behaviour. Because the façades of North House are almost entirely glass, there are few places to embed physical controls for lights, thermostats, or other devices. Thus, the first version of the EcoControl System provided the only means for the resident to control, track and manage energy performance in the house. West House [29], our second and current project, addresses a different set of goals. Conceived as a sustainable, “near net-zero” home, it is a small, passively efficient house that uses electricity from the grid, natural gas for heating and cooking, and solar energy to augment heating, hot water and electricity production. It is presented as a conventional home, and typical controls (light switches, thermostats and security systems) are included throughout the house, so that digital and physical controls and feedback are intermingled. We built West House as part of our ongoing collaboration with the City of Vancouver, whose policy makers are keenly interested in how information technology, social media, alternative energies and building design can be combined to foster more sustainable living practices in “typical” houses. North House saw more than 60,000 visitors at the Solar Decathlon; 65,000 people visited West House during its public display at a temporary location at the Vancouver 2010 Winter Olympic Games. During these events, we logged thousands of control interactions through the
17
software interfaces. This volume was due to enthusiastic visitors who were encouraged to interact with the control systems in the home, including extensive tire kicking by large groups of school children. This resulted in a robust, field-tested system. Anecdotal interviews with many of the visitors provided valuable insight into aspects of potential acceptance, resistance and use of the system, in particular with respect to how it was integrated into the unique layout and interior design of each house.
Related Work Significant research has focused on the power of pervasive and networked computing to automate and enable supportive and adaptive services within “smart homes.” This work has largely been targeted at enabling assistive environments for in-home care such as the Aware home [18] or the i2Home project [34]. Home automation systems such as 4HomeEnergy™ [1] increasingly add monitoring components and services to automate energy use to their already complex systems. Systems proposed by the AIM project [6] and a recent Apple patent filing [8] extend home automation to support variable control of how devices are powered and provide feedback on consumption at the device level. More recently, sensing networks have been proposed to analyse and react to user behaviour in the environment to optimize power use [12],[13] and enable load shifting [16]. The focus in these technologies is measurement, analysis and control of power in the home, with automation as an underlying principle. In a different approach, Weiss et al. developed a web-based application for monitoring home energy use that allows the resident to monitor consumption on a smart phone and turn individual appliances on or off [28].
The psychological literature [3],[17],[25] makes it clear that feedback is a central aspect of motivating resource conservation in the home. Recent web-based services partnered with power utilities have emerged toward this end. Google PowerMeter™ and Microsoft Hohm™ allow residents to monitor and analyse aspects of their energy consumption using common “energy dashboard” displays and some description of energy use impacts. Dedicated in home displays (IHDs) such as Rainforest’s EMU™ show total electricity consumption in terms of kilowatt-hours and money spent. Point of consumption tools such as the Kill A Watt™ are dedicated energy monitoring units attached to a particular appliance or outlet that provide numerical electrical and financial expenditure. In contrast with these traditional computing displays, a number of researchers have developed ambient monitoring and awareness tools for use in the home [11], [34]. These have the goal of communicating information without requiring analytical attention, such as incorporating displays of energy use into household items such as clocks or power cords [11], personal wear [34] and abstract informative art as eco-visualizations [14]. Research into how technologies may aid or hinder residents in developing more sustainable behaviours within the home has arisen more recently [7],[32]. As these researchers (and indeed our public energy utility partners) have pointed out, data feedback is not enough. Awareness does not equate to behaviour change, and a diversity of motivations exist for conservation. Key issues [7] for residents are the lack of real time information around consumption; comprehension of what the energy use units actually mean in terms of behaviour [30]; the complexity of energy-management devices such as programmable
18
thermostats [7]; poor location of feedback away from locations where resource use decisions are made [15],[30]; and the need for motivational tools such as goal-setting abilities and social networks [17],[19],[23]. Chetty et. al. advocate several design principles: make real-time information visible and comprehensible; design for individual and collective agency for motivation and reward; ensure technologies are attainable; and seek new ways of stimulating discussion and engagement [7]. Fitting these technologies into the home poses additional challenges. Stringer et. al emphasize that residents have competing ideas about where visible technology should be located and who controls it. They also feel overburdened by the complexity and inflexibility of home technologies they already use [26]. This can be seriously aggravated by automation: humans have an uneasy relationship with automated control [33], as we discovered in our first prototype deployment.
motivating benefits, including non-financial incentives. With this in mind, we have derived the following criteria from both previous research and from an ongoing series of workshops and user studies.
Design Rationale
4. Control: Enable efficient resource use decisions by designing a control hierarchy for optimized resource use. Situate and distribute controls appropriately: embedded in the home, remote or mobile.
Enabling the Smart Occupant In contrast to the smart home populated with intelligent and automated devices, we focus on the aware home with support for the smart occupant. In our work, we seek to reduce the technological and cognitive effort required to make decisions about resource use and understand its impacts, and to make it easier for residents to do the right thing. Our rough “grounding equation” can be expressed as Cost > Benefit ≠ Change. Simply, if the perceived cost (effort, time) of doing something outweighs the perceived benefits, people will not change their behaviour. Especially in our part of North America where resources are relatively cheap, we need to reduce the overhead of performing conservation actions and increase the
1. Rich, real-time feedback: Make real-time and cumulative resource information available to support decision-making and information access at a variety of levels: in-the-moment awareness; lightweight monitoring; analysis and reasoning; consequential judgment and prediction. 2. Context: Present information in contextually appropriate ways: for example, express energy use in both financial terms and common usage (“enough to power a washing machine”). Embed information where decisions are made to maximize relevance. 3. Individual and Social Motivation: Provide goalsetting capabilities and integration with social and community networks.
5. Aesthetics: Respect the design sensibility of a home. Explore ambient, subtle feedback that coheres with the affective constraints of the dwelling. 6. Familiarity: Reduce complexity by leveraging tools people already use in their information landscape, such as calendars, browsers and clocks.
The EcoControl System This design rationale has informed the development of the EcoControl System. It comprises three main components: the mechanical systems and resource
19
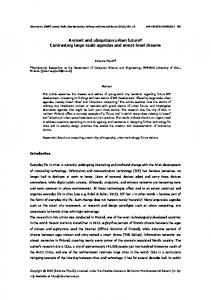
infrastructure layer enabling fine-grained measurement and device control; a control and network layer that parses, stores and formats data and commands between the software and mechanical components and implements the automation logic; and the user-facing Aware Living Interactive System (ALIS) which embodies the resident’s interaction with the home. From the perspective of the resident, these combined systems provide integrated control over lights, shades, climate, and other house controls, and distributed feedback on resource consumption within the home (Figure 1). The control system monitors electrical production from roof-mounted and building-integrated solar panels and electrical consumption within the house on a per-circuit basis. This enables fine-grained monitoring of power use within the home. Consumption information for specific appliances (fridge, stove, etc), or specific subsystems (entertainment system, living room lights) is available on both a real-time and historical basis. Water use is monitored at intake for both cold and hot water. In the next iteration of the system, under development now for deployment in October, we will be adding more detailed monitoring for water, wastewater, and natural gas. In keeping with the principle of leveraging existing tools, we use a web services software architecture and communication model. This approach enables rapid prototyping and allows us to easily connect to external services and tools already in use by residents, such as Google Calendar, weather APIs, social networks, and external energy analysis tools such as Pulse Energy™. It also allows us to provide a familiar interface and interaction paradigm to residents through the browser.
Figure 1: EcoControl diagram, showing three system layers.
ALIS: The Aware Living Interface System A constant theme in our initial user sessions was that people wanted appropriate information and control distributed throughout the home rather than having it housed on a central display. They wanted both to be made aware of the impacts of their energy use decisions while simultaneously expressing a preference for straightforward forms of feedback that would not introduce new tasks, tools and information overload into their daily routines. Thus we take an information ecosystem approach to control and feedback [5] that includes web-accessible applications, distributed control interfaces, ambient indicators, personal motivation tools and social networking features. These represent a subset of the approaches we have considered throughout the project and should not be considered as a definitive set of viable techniques. ALIS is built from a comprehensive information model which incorporates control and device details; resource-specific production and consumption data in terms of standard units, pricing, and standard usage equivalences; personal and
20
shared goals; and a hierarchical model of energycontrol settings to enable “one-step” optimization.
Figure 2: The embedded control panel interface from the garage in West House. The panel provides local control points for lighting and climate, and onetouch house mode buttons (upper right). Tabs to access other ALIS views are aligned along the bottom of the interface.
Controls As in standard home control, ALIS enables the resident to control and monitor lights, shades, and climate settings. In addition, the resident can configure energyoptimizing “modes” as presets in ALIS controls. For example, turning off most lights and lowering the thermostat in “Sleep mode”, or tuning settings and shutting down standby power in “Away” mode. These presets can be activated either by one button from any ALIS control interface (such as the mobile phone or embedded touch panel — Figure 2) or scheduled for planned activation. For example, in a prototype currently under development, a smart alarm clock by the bed can wake both the resident and the house (by putting the latter into Home mode). Note that these are presented as examples: modes are entirely user configurable, and coexist with individual control settings for fine-grained control when desired. Controls differed slightly in North and West House(s). In North House, we added override controls for the sophisticated internal and external automated shade systems that tracked the sun, and extra state information to show the house was in “automated” or “manual” mode. Visitors to North House were intrigued by the efficiency of the automated shading system, but uncomfortable with the idea that if they wanted to change the behaviour (for example, to open shades to read a book) they had to suddenly “manage” the house control system. They struggled with a model of how the system worked, with what “optimal” and “non-optimal” modes represented, and with how they might balance their needs with the apparent state of the system. In a
different approach, West House currently uses no automated devices for climate control: we are experimenting with leaving energy optimization in the hands of its occupants, supported by contextual feedback to enable informed decision-making. Feedback
Figure 3: The ALIS dashboard indicates daily usage statistics and provides uncomplicated data visualizations for at-a-glance awareness of resource consumption. It also conveys tips related to usage data and displays residents’ progress toward community challenge goals.
ALIS provides a variety of feedback displays and analytical tools. Detailed information on resource production and consumption is available in real-time and historical views, categorized in different ways (by type of device, by location in house, by time of use). We have integrated Pulse Energy™ software for detailed performance analysis and prediction (Figure 4). These detailed views complement an Overview
21
Dashboard (Figure 3) that expresses resource use in simplified terms: as standard units (kWh, L), financial figures, by equivalent usage (“Today’s water use is equivalent to two baths”) and in relative terms (“25% less power than yesterday”). Embedded informative art visualizations like the kitchen backsplash (Figure 6) provide feedback by showing gradual effects of use during the day: as consumption increases, different display areas illuminate and luminance changes. Figure 4: Pulse Energy™ energy management software is integrated into ALIS for detailed data visualization and reporting on energy consumption and production.
Motivation Residents can set personal milestones and challenges that can be measured by the system, such as, “use 10% less energy than last month.” ALIS then tracks and reflects progress toward these goals. The horizontal bar in the Dashboard in Figure 3 is one such representation. In our design specification, but not yet implemented, is an extension of this approach to community challenges and competitions through existing social networks such as Facebook. Platforms ALIS is currently implemented on four hardware platforms: embedded touch panel computers, personal computers via a web browser, mobile devices, and integrated informative art. The system can also accommodate expansion across further platforms. Each platform implementation of the user interface is contextualized for the location, use context, and form factor of the delivery hardware. PERSONAL COMPUTERS The ALIS PC interface offers the most detailed access to feedback about resource consumption in the home. It provides the resident with access to a high-level house Dashboard, a detailed analytical Resource Usage
interface, and integration to a social network where users can share and compare their energy conservation techniques with others in their local community or join initiatives like carpooling. Residents use the PC interface from any web-connected computer to configure presets, set goals, and schedule house operation. The overarching goal of this GUI is to provide a task-focused set of tools that can be used on any web-enabled device in order to increase awareness, enable analysis, configure control and foster informed decision-making about residential resources. EMBEDDED PANELS Three touch panels are embedded into the structure of each home. A large touch panel is placed in a central location: in the kitchen backsplash in North House, and on the wall in the central hallway in West House. Additionally, two smaller panels provide localized control and feedback throughout the home. In North House these are placed at the two entryways. In West House, one is installed in the garage and the other is placed beside the upstairs desk. Access to the full ALIS desktop interface is possible at each access point, but complicated by the affordances and form factor of a touch screen. To address this, we have configured the interfaces on the panels to default to information and control views appropriate to their location. For example, the main control panel allows easy access to the house controls and the Overview Dashboard, while the garage panel provides lighting and climate controls for the garage area, one-touch home control presets, and community and transportation interfaces. For example, we anticipate that at this location the resident may be particularly interested in public transit
22
schedules, carpooling options, and data on the performance of their electric car. MOBILE DEVICES The mobile application provides feedback and control to the residents of the home from their pocket – a simplified remote house control. The mobile application was developed for the Apple iPhone and iPod Touch (Figure 5) as an extension of the desktop web application and is currently being ported to other mobile platforms such as Symbian. It offers a subset of the features available in the web application, with each feature redesigned for use on a mobile device. For example, the controls available from the mobile emphasize ease of use through logical groupings. These “master” controls allow the resident to adjust the lights for a whole room, or shades for a whole house façade, with a single control. More fine-grained control of individual fixtures is still available, but a hierarchy of control makes the most commonly used items easily accessible.
Figure 5: One screen of the ALIS Mobile application, showing a master light control for the Dining area.
INFORMATIVE ART ALIS also includes unique informative art approaches to providing feedback. The Ambient Canvas is one example of this approach: an informative art piece embedded in the kitchen backsplash (Figure 6). It gives feedback on the use of resources such as electricity, water, and natural gas. As opposed to typical graphical displays that may use numbers or charts to convey information, the Ambient Canvas combines LED lights and filters of various materials to produce light effects on the kitchen backsplash. This subtle feedback on performance and energy efficiency does not require active attention on the part of the resident, and integrates into the home cohesively. In
this context, informative art is intended to promote awareness of resource use to assist and influence sustainable in-the-moment decision-making.
Figure 6: The “Ambient Canvas” kitchen backsplash display.
Conclusion While we realize that information and ubiquitous technologies may play a powerful role in encouraging conservation, the design of these systems for effective home use faces critical challenges. We are exploring these design parameters through an integrated range of user interfaces on different platforms, from smart phones and web browsers to embedded and ambient displays, each designed to support sustainable decision-making in the home. We have operationally tested the system in two very challenging public showcases, where more than 100,000 people have visited and interacted with the live systems. From these experiences, we have already learned several important lessons: 1.
Aesthetics are critical, both for those who build the environment (architects and interior designers) and those who live in them. We underestimated how
23
2.
3.
challenging it would be to discover an “aesthetic” system that would please all stakeholders. Interactive developers must work closely with home designers and residents, as there are many visions of where specific interfaces and displays actually fit in the home.
understanding. We also intend to expand the range of experimental feedback devices, including development of the smart alarm clock and informative art in digital photo frames. We anticipate this ongoing work will contribute to the field in the following ways:
Automation is problematic: even the suggestion of introducing it makes people worry about complexity and loss of control. Designing systems that balance occupant control and comfort with optimal efficiency is critical if we expect residents to adopt these approaches.
1.
Extend knowledge of interactive interfaces for inhome technological systems that support sustainability;
2.
Explore the impacts of awareness, understanding, practical action, integrated control, data logging and community interaction on resource use decisions;
3.
Improve the products, processes and services that support occupants in integrating these information tools and systems into their living spaces.
We have received strong responses to the “nonscreen” ambient displays. Visitors have been very enthusiastic about the Ambient Canvas, especially seniors. The overwhelming message was that attractive displays that do not require “looking up information on a computer” hold great interest for residents. What these displays should look like is still an open question, spanning the pragmatic considerations of information visualization with the idiosyncratic constraints of personal aesthetic taste.
Acknowledgements We sincerely thank our many industrial and government partners for their incredible support.
References [1]
Future Work Our future work will focus on building from these insights. We currently plan thorough evaluation of the system in a real-world context. Starting in October 2010 and through the next three years, West House will serve as both a technology research space and an occupied living lab. Resource sensing will be extended to incorporate natural gas and wastewater monitoring. Studying residents in this fully functional home in a vibrant neighbourhood will enable us to evaluate a variety of approaches, and engage with occupants and community members to further develop our
4Home. (2010) www.4home.com.
[2] Aldrich, F.K. (2003) Smart Homes: Past, Present and Future. In Inside the Smart Home, ed. R. Harper. Springer. [3] Abrahamse, W., Steg, L., Vlek, C., Rothengatter, T. (2005) A review of intervention studies aimed at household energy conservation. Journal of Environmental Psychology, 25 (3). [4] Aipperspach, R., Hooker, B., Woodruff, A. (2008) The Heterogeneous Home. In Proc. of UbiComp '08, pp. 222-231. [5] Bartram, L., Rodgers, J. and Muise, K. (2010) Chasing the Negawatt: Visualization for Sustainable Living. IEEE Computer Graphics and Applications, 30(3). [6] A. Caponea, M. Barros b, H. Hrasnicab, S. Tomprosc. (2009) A New Architecture for Reduction of Energy Consumption of Home Appliances. European conference of the Czech Presidency of the Council of the EU TOWARDS eENVIRONMENT, e-Envi2009. Prague, March 25-27.
24
[7] Chetty, M., Tran, D., Grinter, R.E. (2008) Getting to Green: Understanding Resource Consumption in the Home. In Proc. of UbiComp '08, pp. 242-251. [8] Fadell, A. Apple Inc. (2009) Intelligent Power Monitoring. U.S. Provisional Patent Application No. 20100010857. [9] Froehlich, J., et. al. (2009) HydroSense: infrastructuremediated single-point sensing of whole-home water activity. In Proc. of UbiComp '09, pp. 235-244.
[22] North House. (2009) http://www.team-north.com. [23] Petersen, J. E., Shunturov, V., Janda, K., Platt, G., & Weinberger, K. (2007). Dormitory residents reduce electricity consumption when exposed to real-time visual feedback and incentives. International Journal of Sustainability in Higher Education 8(1), 16-33. [24] Shipworth, M. (2002) Motivating Home Energy Action: A Handbook of What Works. Australian Greenhouse Office.
[10] Gertner, J. (2009, April 16) Why Isn’t the Brain Green? The New York Times, pp. MM36.
[25] Stern, P. (1992) What Psychology Knows About Energy Conservation. American Psychologist, 47 (10).
[11] Gustaffson, A. and Gyllenswärd, M. (2005) The power-aware cord: energy awareness through ambient information display. In Proc. of CHI '05, pp. 1423-1426.
[26] Stringer, M., Fitzpatrick, G. and Harris, E. (2006) Lessons for the Future: Experiences with the Installation and Use of Today’s Domestic Sensors and Technologies. In Proc. Of Pervasive 2006, Dublin, Ireland.
[12] Heo, J., Hong, C.S. Kang, B. and Sang, S.J. (2008) Design and Implementation of Control Mechanism for Standby Power Reduction. IEEE Transactions on Consumer Electronics, Vol. 54, No. 1. [13] Harle, R.K. and Hopper, A. (2008) The potential for locationaware power management. In Proc. of UbiComp '08, pp. 302-311.
[27] Velikov, K. and Bartram,L. (2009) North House: Developing Intelligent Building Technology and User Interface in Energy Independent Domestic Environments. Proceedings of PLEA 2009 (Passive and Low Energy Architecture), Quebec City. [28] Weiss, M., et. al. (2009) Handy feedback: Connecting smart meters with mobile phones. In Proc. of Mobile and Ubiquitous Multimedia '09, pp. 4713-4717.
[14] Holmes, T.G. (2007) Eco-visualization: combining art and technology to reduce energy consumption. Creativity and Cognition 2007, ACM, Washington, DC, USA.
[29] West House. (2010) http://westhouse.sfu.ca.
[15] Intille, S. (2004) Ubiquitous Computing Technology for Justin-Time Motivation of Behavior Change. Proceedings of MedInfo, vol. 11 (Pt 2), pp. 1434-7.
[30] Wood, G. and Newborough, M. (2007) Energy-use information transfer for intelligent homes: Enabling energy conservation with central and local displays. Energy and Buildings, 39, 495-503.
[16] Karlgren, J., et. al. (2008) Socially Intelligent Interfaces for Increased Energy Awareness in the Home. In Proc. of The Internet of Things to Come '08, pp. 263-275
[31] Woodbury, R., Bartram, L., Cole, R., Hyde, R., Macleod, D., and Marques, D. (October 2008) Buildings and Climate Solutions. Pacific Institute for Climate Solutions.
[17] Katzev, R.D. & Johnson, T.R. (1987) Promoting energy conservation: An analysis of behavioral research. Boulder, CO: Westview Press.
[32] Woodruff, A., Hasbrouck, J., Augustin, S. (2008) A bright green perspective on sustainable choices. In Proc. of CHI '08, pp. 313-322.
[18] Kientz, J. A., Patel, S. N., Jones, B., Price, E., Mynatt, E. D., and Abowd, G. D. (2008) The Georgia Tech aware home. Proceedings of CHI '08. ACM, New York, NY, 3675-3680.
[33] Woods, D.D. (1994) Automation: Apparent simplicity, real complexity. In M. Mouloua & R. Parasuraman (Eds.), Human performance in automated systems: Current research and trends (pp. 1-7). Hillsdale, NJ: Erlbaum.
[19] Kim, Y., et. al. (2009) ViridiScope: design and implementation of a fine-grained power monitoring system for homes. In Proc. of UbiComp '09, pp. 245-254. [20] Mankoff, J., Matthews, D., Fussell, S.R. and Johnson. (2007) Leveraging Social Networks to Motivate Individuals to Reduce their Ecological Footprints HICSS 2007, Hawaii. [21] mHome Automation. (2010) Embedded Automation www.embeddedautomation.com.
[34] Yun, T. (2009) Investigating the impact of a minimalist inhome energy consumption display. In Proc. of CHI '09 Extended Abstracts, pp. 4417-4422. [35] Zimmermann, G., and Vanderheiden, G. (2007) The Universal Control Hub: An Open Platform for Remote User Interfaces in the Digital Home. In: Proceedings of HCI International 2007, LNCS 4551, p. 1040 ff. Springer.
25
Adaptive thermal modelling for buildings Carl Ellis Computing Department. Infolab21, Lancaster University. Lancaster, UK
[email protected] Mike Hazas Computing Department. Infolab21, Lancaster University. Lancaster, UK @comp.lancs.ac.uk
Abstract Modelling a house’s thermal properties and interactions is a difficult task, normally involving surveys and long periods of measurements. I propose a system which can learn all of these properties, or some aggregate representation, dynamically with very little to no input from inhabitants or trained personnel. This means the system would have to use what ever basic monitoring data was available to it and from this data create a model for each room and their interactions. This system must infer where a heating source is, and the way each heating source can affect the house individually and in tandem with multiple other sources. This shall allow for rapid deployment into unknown houses which rather than learning the behaviour of its occupants, learns the behaviour of the building itself.
Background and Related Work
Copyright is held by the author/owner(s). USCE2010, ACM 9781605589305/10/04.
Everyone in their lives at some point has been told to turn off light switches when they leave a room and to turn the central heating down to a lower temperature. This saves money, the environment, and cuts down your carbon emissions which in the current economical and political climate may help you avoid possible future green taxes. This then becomes a problem of working out the savings to comfort ratio in your own head with sluggishly responding systems that skew your decision making. To know the best way to heat your house, office, or warehouse you must understand how the building interacts with the outside air, the ground, and its interior rooms. This requires a model of
26
the house where the heat transfer coefficient (Uvalue) of every wall is known, which is a differential value, as well as the thermal clamp of each room [1] which is the constant thermal dissipation which may stem from floors and neighbouring dwellings, and the heat gained from solar flux which is the total energy from the sun. The literature is full of modelling techniques for houses, but most are focused on how heat transfers through certain materials and with incredible detail [2, 3]. Modelling techniques which focus on large interactions, like a house, normally simplify the process by making the model very simple, usually by treating the house as a single thermal mass[1], or making it very detailed by surveying the building to be modelled and every material's Uvalue. Modelling a house as a single thermal shell may give accurate results on a predicted average house temperature, but within homes there is a need to know the room by room temperature and the transfer coefficients of each interface. In a house with multiple occupants individual temperature needs may very possibly change on a room by room basis, and so a finer granularity is prudent within a model. This assumption of a single shell hides a lot of useful data away, as certain internal rooms may hold heat for a very long time, or a select few outside rooms may be the leakiest of the house. Pakanen and Karjalainen [4] provide an energy consumption tool for buildings of flats where they can work out a fair energy allocation based on how much heating you get from your own flat and from surrounding dwellings. Their system only wishes to calculate static heat flows between flats rather than in situ measurements, and so they have detailed measurements from within the flats to determine the modelling parameters. Their system does not deal with heat sources just heat flow, but it is a very accurate system for that. The process does require every
room being modelled to be at the same temperature for a period so the static flows can be calculated, which when transfered into a domestic setting becomes a little involved. For large scale deployments of software which models any house, a large degree of flexibility is required. It is completely unfeasible that every house in the world can be accurately surveyed for floor plans, Uvalues, and outside temperatures. Even if a survey could be done, once sensors are placed into a house their positions would need to be mapped perfectly and all the values gathered from the survey would have to be inputted somehow. This would mean time from trained personnel, which would be expensive, or time from the inhabitants, which would require a bit of training for a skill they would never have to use. Every time the house changes, modifications to the survey would be needed. As shown in studies by Boait and Rylatt [5] standard thermostat and central heating controls are already difficult to use properly, so a complex system of inputting many variables is somewhat out of the question. For a reasonable level of flexibility and for a generic system to be created, techniques such as machine learning and state estimation can be used. This of course is not a simple solution, but similar methods have been tried although in a less generic manner such as Mozer’s Neural Network House [6].
Challenges As costs should be brought down to a minimum, simple sensors should be used when deploying within a building. So a main challenge of the project will be to create an aggregate model using minimal sensor information. As little as a temperature sensor for each area should be able to provide enough data to calculate the thermal properties of a house on a room by room basis. For each room the following properties are needed: an id of some sort, knowledge of the neighbouring room’s ids, the temperature model, and if it has a heat source.
27
The thermal model of each room would initially be composed of the following properties: temperature trends, a heat transfer coefficient for each neighbour interface, and a thermal clamp. However, each room will only have a measured temperature with which to work out these properties, which is where the continuous fine grained data and some assumptions come in. Using known quiet times in the data, constraints upon thermal clamps and Uvalues can be calculated to allow the model to evaluate itself against the measured data. Heat sources can be discovered by monitoring the temperature differentials for any abrupt change. Spaces which are not heated will have temperatures based upon solar flux and any heat from surrounding rooms. Windows and doors need special consideration, as when closed will mimic a normal wall, but once open it will change their behavior considerably. Another challenge of this project is evaluation. Five or six datasets may be acquired but anymore becomes impractical and expensive, so whether simulations can help verify the system works will have to be investigated. However, simulations have the distinct disadvantage of not containing anything you did not account for, and so a number of real world deployments [1] RC Sonderegger. Diagnostic tests determining the thermal response of a house. NASA STI/Recon [2] G Jones. Steadystate heat transfer in an insulated, reinforced concrete wall: theory, numerical simulations, and experiments. Energy and Buildings, 29(3):293–305, January 1999. [3] D Winiarski and D Oneal. A quasisteadystate model of attic heat transfer with radiant barriers. Energy and Buildings, 24(3):183–194, October 1996.
may be necessary for a full evaluation, and to create accurate simulators.
Outcomes Of The Project This project aims to create a thermal model which uses, at first, detailed structural knowledge including, if any, the position of windows and doors. Then, once that model is conforming to the measured building, begin removing prior data and adding in functionality to equate the missing data and build an equivalent model. The overall aim is to create a system which can be deployed into any building with sensors in every room and a central server which will learn the properties of the building using modelling techniques developed in the field of heatings and buildings. Once a buildings behavior is measured, or equated, to a large degree of accuracy it then becomes possible to predict how a building will then react to situations which are not necessarily easy to produce on the actual building. With this ability as a platform applications for actuation then become possible.
[4] J Pakanen and S Karjalainen. Estimating static heat flows in buildings for energy allocation systems. Energy and Buildings, 38(9):1044–1052, September 2006 [5] PJ Boait and RM Rylatt. A method for fully automatic operation of domestic heating. Energy and Buildings, 42(1):11– 16, 2009. [6] SM.C. Mozer. The Neural Network House: An Environment hat Adapts to its Inhabitants. In Proc. AAAI Spring Symp. Intelligent Environments, pages 110–114, Menlo Park, CA, 1998. AAAI Press.
28
Take a Closer Look - The Role of the User in Ubiquitous Smart Energy Systems Marco Jahn
Abstract
Fraunhofer Institute for Applied Information Technology FIT
The core concept of many energy awareness systems is that
Schloss Birlinghoven
providing feedback about energy consumption will lead to
53754 Sankt Augustin, Germany
significant energy savings.
[email protected]
grate other interventions (than feedback) like goal-setting,
Although some systems inte-
rewards, or comparison, there is no structured mapping from the findings of behavioral psychology to such systems. This raises the question if and how such interventions can contribute to change our behavior and sustain these changes in the long run. In the field of human-computer interaction (HCI) some researchers argue that common feedback-based systems are not suited for promoting long-term behavioral changes towards a more energy efficient lifestyle [5, 8]. This seems to be true, when taking into account the fact that people differ widely in their attitudes, motivations, knowledge etc. I argue that it makes sense to take into account the peculiarities of people when designing smart energy systems. Further, I present ongoing research considering the role of the user and the relevance of motivation within the context of an ubiquitous smart energy system.
Keywords energy efficiency; ubiquitous computing; behavior change Copyright is held by the author/owner(s). Space reserved for
ACM Classification Keywords
ACM copyright notice.
H.5.2 Information Interfaces and Presentation: User interfaces – Evaluation/ methodology
29
Introduction
goal setting, information, feedback, rewards, and combina-
Advancements from the field of ubiquitous computing will
tions of these) and resulting effects on peoples’ energy con-
open up great possibilities for the design of smart energy
servation efforts. While most of these studies resulted in en-
systems. Currently, energy efficiency is - or is becoming - a
ergy savings reaching up to 15%, Abrahamse et al. also add
huge hype but the potential of integrating energy efficiency
that [...] underlying determinants of energy use and energy-
into ubiquitous systems is still waiting to unfold. Ubiquitous
related behaviors have hardly been examined [...] and that
computing and the possibility to integrate information and
the problem of sustaining the behavior has not been tackled.
knowledge into our everyday environments has the poten-
Furthermore, the attitude and knowledge of people towards
tial to contribute to an energy efficient lifestyle. If such an
pro-environmentalism was not subject to most of these stud-
environment would be able to understand the specific goals,
ies.
attitudes and motivations of its users, it could react according
While Abrahamse et al. review various kind of interventions,
to these parameters.
Darby [3] focusses on the role of feedback and comes to
In this paper I present ongoing research that aims at pro-
the conclusion that direct feedback provided by some kind
viding a link between behavioral psychology and ubiquitous
of monitor or display can support savings from 5-15%. But,
computing. I argue that in order to support long-term behav-
similar to Abrahamse et al., Darby also points out that in order
ioral change towards a more energy efficient lifestyle, smart
to establish an intrinsic motivation to save energy, additional
energy systems need to take into account user-specific at-
interventions might be helpful.
tributes, especially motivation. Changing behavior and sustaining it, is not a simple matter of providing feedback. We
The Leading Role of Feedback
rather need to know about a persons motivation, knowledge
Current developments in the research community as well as
and attitude beforehand, and then can think of a suitable in-
in the industry, have a clear tendency towards feedback-
tervention. Further, I describe our ubiquitous office system
based energy awareness projects and/or tools; a band-
that we employ to collect user data related to energy con-
wagon that also the big industry players did jump on. Microsoft Hohm1 and Google Power Meter2 both provide to
sumption.
the user real-time power consumption information, following the assumption that increased awareness induces behavioral
The Role of Interventions
change.
Regardless of the current hype about energy awareness and
Research projects cover ambient hardware feedback like in
efficiency, the question of how to motivate behavioral change
[6] and [11] as well as software based systems. The eMe-
towards energy efficient behavior, is subject to research for
ter system [12] connects a mobile phone with a smart meter
[1] provide an
to provide real-time feedback. Jahn et al. [10] present an
overview of 38 studies on interventions aimed at household
energy aware smart home system that provides device-level,
energy conservation, many of them reaching back to the
real-time feedback and control functionality. EnergyLife [9]
1970s. These studies examine different interventions (e.g.
combines feedback information with goal setting and aware-
quite a long time now.
1 2
Abrahamse et al.
http://www.microsoft-hohm.com/ http://www.google.com/powermeter/about/
30
ness tips. Both, feedback and tips are available for single devices as well as for whole households.
The Need for Personalization While I strongly believe that providing feedback to the user is useful and can help him to change his behavior, I also think that this is just the very basis of achieving long-term behavioral changes. Abrahamse et al. [1] point out that the early
2. Contemplation (Actor is aware about his problematic behavior and intends to change) 3. Preparation (Actor is planning to take action) 4. Action (Actor is changing his behavior) 5. Maintenance, Relapse, Recycling (Actor tries to sustain the new behavior)
studies did not take into account the users’ motivations, atti-
He et al. [8] apply the TTM to energy feedback technology
tudes, and knowledge. Darby [3] speaks of the environment
and provide a motivational framework describing goals (i.e.
and social factors.
how to motivate the actor to move on to the next stage) and
If we want to support long-term behavioral change, we need
recommendations (i.e. how technology can help to reach a
to take into account that people are different; they have dif-
goal) on how to step up in the process of behavioral change.
ferent goals, attitudes, motivations, levels of education etc.
I believe that applying the TTM to energy feedback sys-
For someone who is completely indifferent to his energy con-
tems is a promising approach and that ubiquitous computing
sumption, fine-grained feedback might not be the right per-
provides the appropriate base technology to develop user-
suasive technique. He might rather need some information
centred smart energy feedback systems.
on the consequences of his behavior. The case is likely to be different with a person that devotes her whole live to sustainOther researchers take a closer look at models from behav-
The User, the Motivation and the Ubiquitous System
ability. ioral psychology. Froehlich [5] and He and Greenberg [7]
With the rise of ubiquitous computing more and more smart
state that feedback itself does not necessarily lead to sus-
devices, sensors, and actuators will be embedded into our
tained behavioral change. He and Greenberg point out that
every-day environments whether it be the home, the office
[...] changing consumption behavior is a psychologically, so-
or public spaces [15]. I believe that such environments can
cially and culturally complex problem.
be exploited to motivate energy conservation (or more gen-
Riche [14] and He et al. [8] take a closer look at the pro-
eral, pro-environmental) behavior, in a way that takes into
cess of behavioral change. Both consult the Transtheoretical
account the individuality of the user. Allowing a system to
Model of Change (TTM) [13], which describes the process of
classify a user according to e.g. the stages defined in the TTM
behavioral change as a hierarchy of stages to pass through.
could contribute to developing tailored interventions, fitting
This process can roughly be described as a change of attitude
a user’s personal attitude.
and a new behavior that can replace problematic behavior. In
Froehlich et al. [5] describe the gap between environmental
detail the actor undergoes several stages, namely:
psychology and HCI and discuss relevant issues. One question that remains open is, how to model behavioral change
1. Precontemplation (Actor is uninformed and unaware, unwilling to change behavior)
and stages of motivation. I argue that to foster behavioral change, as a first step it is of the utmost importance to know
31
the user and his current stage of motivation. Our goal is
Research Goals
to track the user’s energy-related behavior in an ubiquitous
The vision behind this research is that of a ubiquitous sys-
office environment and derive certain facts e.g. his current
tem that helps users to sustain an energy efficient lifestyle,
stage of energy usage, his level of knowledge or his stage of
regardless of their original attitude and motivation. With the
motivation according to the TTM.
research described in this paper I aim at providing some rele-
As described in [10] we developed a feedback-based ubiq-
vant answers to the question: How can ubiquitous computing
uitous system that exploits device-level energy consumption
contribute to change our behavior towards an energy efficient
information and makes this information available to the user
lifestyle? In detail, these results will be:
via different kinds of interaction metaphors. This system is based on the Hydra middleware [4, 2]. The Hydra middleware
1. An approach to classify users. The main goal of track-
framework supports the development of scalable, pervasive
ing user behavior within our smart office system is to
systems of networked devices. It simplifies the development
derive information regarding their current level of mo-
of such systems by abstracting from the heterogeneity of dif-
tivation. I we can classify users according to the TTM,
ferent network communication protocols, allowing unified de-
we could use such classifications to provide adapted
vice access on a Web Service layer.
interventions to the user. This would be a huge step
Currently this system is able to track energy consumption on
towards really user-oriented smart energy systems.
the level of single devices using Plogg3 wireless plugs to acFurther, we employ the Arduino4
2. A deeper insight into peoples’ energy related behavior.
sensor platform to integrate more sophisticated energy-
By tracking and analyzing user behavior we can learn
related usage tracking. Thanks to Hydra, we can easily ab-
when and why people consume energy. Based on this,
stract from the specifics of programming for Arduino. We can
we can also try to find out if and why they are wasting
just access sensors and actuators via Web Services and thus
energy. Further, we might learn something about psy-
rapidly integrate new functionality into our system. Currently
chological parameters that constitute motivation (atti-
integrated sensors recognize temperature, lighting and pres-
tudes, believes, and values [8]).
cess consumption data.
ence of people. Tracking of data is done in an event-based manner. For en-
3. A development framework for prototyping smart en-
ergy consumption data, an event is a significant variation
ergy systems. We aim at making our ubiquitous energy
in the consumption flow. Sensor data are also modeled as
system as open and extensible as possible. The goal is
events e.g. switching light on/off. An energy consumption
to have a framework, that allows for fast setups of the
event contains references to the user, device, room and has
system in different environments, so we are able to run
a time stamp and of course a consumption value measured
evaluations with different kinds of input and environ-
in watts. As a first step, we will simply track these events in
mental determinants. Ideally, the system will be able
a number of offices and then analyze the data regarding its
to manage a set of interventions and support flexible
quality for making assumptions about the user.
combination of these.
3 4
http://www.plogginternational.com http://www.arduino.cc/
32
Conclusion
[4] M. Eisenhauer, P. Rosengren, and P. Antolin. A Devel-
I argued that the current trend towards feedback-based sys-
opment Platform for Integrating Wireless Devices and
tems that do not take into account people and their motiva-
Sensors into Ambient Intelligence Systems. In Proc.
tion, knowledge, environment, etc. will not necessarily lead
SECON 2009. IEEE, 2009.
to sustained behavior change. Although there are approaches to enrich such systems with findings from behavioral psy-
[5] J. Froehlich, L. Findlater, and J. Landay. The design
chology, a structured approach is not recognizable. While
of eco-feedback technology. In Proc. CHI 2010. ACM
of course, considering the individual characteristics of people
Press, 2010.
is a very complex problem, ubiquitous computing provides a basis for tracking and analyzing user behavior. Therefore, I employ a ubiquitous office system to track relevant user events (including power consumption of devices,
[6] A. Gustafsson and M. Gyllenswärd. The Power-Aware Cord: Energy Awareness through Ambient Information Display. In Proc. CHI 2005. ACM Press, 2005.
lighting, presence, etc.). In the next step I will analyze these
[7] H. A. He and S. Greenberg. Motivating Sustainable En-
data and try to extract information to classify users. One pos-
ergy Consumption in the Home. In Proc. CHI 2009. ACM
sibility will be to map these classifications to the stages of the
Press, 2009.
TTM. I believe that taking a closer look at the user and his behav-
[8] H. A. He, S. Greenberg, and E. M. Huang. One size does
ior in an ubiquitous energy system can help to understand
not fit all - Applying the transtheoretical model to en-
his attitude and motivation towards energy efficiency. An un-
ergy feedback technology design. In Proc. CHI 2010.
derstanding, which I think is essential for the design of smart
ACM Press, 2010.
ubiquitous energy systems. [9] G. Jacucci, A. Spagnolli, L. Gamberini, C. Björksog,
References [1] W. Abrahamse, L. Steg, C. Vlek, and T. Rothengatter. A
M. B. Ò, and P. Monti. Designing Effective Feedback of Electricity Consumption for Mobile User Interfaces. PsychNology, 7(3):265 – 289, 2009.
Review of intervention studies aimed at household energy conservation. Journal of Environmental Psychology, 25:273–291, 2005.
[10] M. Jahn, M. Jentsch, C. R. Prause, F. Pramudianto, A. AlAkkad, and R. Reiners. The Energy Aware Smart Home. In Proc. FutureTech 2010. IEEE, 2010.
[2] A. Al-akkad, F. Pramudianto, M. Jahn, and A. Zimmermann. Middleware for building pervasive systems. In Proc. IADIS 2009, 2009.
[11] S. Kuznetsov and E. Paulos. UpStream: Motivating Water Consumption with Low-Cost Water Flow Sensing and Persuasive Displays. In Proc. CHI 2010. ACM Press, 2010.
[3] S. Darby. The effectiveness of feedback on energy consumption. A Review for DEFRA of the Literature on Metering, Billing and direct Displays, 2006.
[12] F. Mattern, T. Staake, and M. Weiss. ICT for green. In Proc. e-Energy ’10. ACM Press, 2010.
33
[13] J. Prochaska and W. Velicer. The Transtheoretical Model of health behavior change. Am. J. of Health Promotion,
on electricity feedback in the home. In Proc. CHI 2010. ACM Press, 2010.
12(1):38–48, 1997. [15] M. Weiser and J. Brown. The coming age of calm tech[14] Y. Riche, J. Dodge, and R. a. Metoyer. Studying always-
nology, 1996.
34
User Created Machine-readable Policies for Energy Efficiency in Smart Homes
Vikash Kumar
Anna Fensel
The Telecommunications
The Telecommunications
Research Center Vienna (FTW)
Research Center Vienna (FTW)
Donau-City strasse 1,
Donau-City strasse 1,
1220 Wien, Austria
1220 Wien, Austria
[email protected]
[email protected]
Slobodanka Tomic
Rene Mayrhofer
The Telecommunications
eSYS Information Systems.
Research Center Vienna (FTW)
Steinhüblstraße 1, Attnang-
Donau-City strasse 1,
Puchheim, A-4800,
1220 Wien, Austria
Austria
Abstract The project SESAME1 utilizes smart metering, building automation and policy-based reasoning to support home owners and building managers in saving energy and in optimizing their energy costs while maintaining their preferred quality of living. In this paper, we present how user-created policies are being applied to develop a system of least interference that supports the user in gaining awareness about energy consumption habits and saving potentials. Proposed concepts are currently being implemented and validated in an extensible demonstrator platform which provides a proof-of-concept for an innovative technical solution.
[email protected] Upper Austria University of Applied Tassilo Pellegrini
Sciences, Mobile Computing
Keywords
Semantic Web Company
Softwarepark 11, 4232
Lerchenfeldergürtel 43
Hagenberg, Austria
Vienna, 1160 Austria
[email protected]
Smart Metering, Building Automation, Energy Efficiency, Sensor Networks, Ontologies, Policy Based Reasoning, Knowledge Capture, Knowledge Management.
[email protected] Copyright is held by the author/owner(s). UCSE 2010: A Workshop at UbiComp’10, September 26, 2010, Copenhagen, Denmark. 1
http://sesame.ftw.at
35
ACM Classification Keywords H.4.4 [Information Systems]: Information Systems Application.
interaction between the user and the energy providers or grid operators.
General Terms Semantics.
Introduction The SESAME project uses ontology-based modeling and rule-based reasoning to address challenges beyond the smart home control [1, 2], focusing on the new types of interactions between the user domain and the stakeholders in the deregulated energy market, a topic which receives increasing interest at the EU level2,3. To realize energy-efficient smart home that has the ability to interact with the external information and control systems of energy suppliers, AMI information providers, etc., SESAME approach is strongly based on rule-based reasoning and service-oriented architecture. Services within the SESAME framework provide different functionality at different interfaces as illustrated in Figure 1. For example, the smart-meter data is published by the smart metering provider through an external SOAPbased Web service. On the SESAME system side the Web service client invokes this service and updates the knowledge base. Sensors, appliances and displays are implemented as service-based information publishers and consumers with published service interfaces. Each service interface implements a notification passing capability. This is true also for the service-based 2
EU FP7 Project Intelligent Self-describing Technical and Environmental Networks (S-TEN www.s-ten.eu). 3 EU FP7 ProjectSmartHouse/SmartGrid (SHSG)3. www.smarthouse-smartgrid.eu.
Devices Home Automation Services
User
Home Energy Services Knowledge Base
Utility Energy Service
Metering Service
Figure 1. SESAME Service Architecture The SESAME ontology model [3] is the core of the knowledge base, which is an RDF store that hosts the instances of the model, and is populated with real data from different information sources, e.g., sensors, appliances, the user profile, energy supplier profile, etc. The ontology is also the basis for the creation of rules. For the implementation of the knowledge base we use the Jena, JESS and Pellet frameworks. In the SESAME concept, the ontology model of the environment is complemented with the system-level user specific policies. System-level policies define different lower-level situations and related actions. For example a system-level rule may specify threshold values for a specific sensor and states that a specific appliance is to be switched on if the sensor reading is less than or equal to the threshold value. We assume that system-level rules would be created by a “power user” well acquainted with the semantics of the devices and activities, or they may automatically come with the devices installed in the environment. In the SESAME project, for the creation of such rules we integrated a
36
By applying tariff schemes from the Austrian Energy Exchange4 we also calculated the average energy costs for a single household per day and per week. These calculations were crucial as simple scenarios showed that a change in behavior might lead to a reduction of energy consumption, but not necessarily to a cost reduction and vice versa if the prices of the energy market would be used by the end customer. These effects have to be observed closely as cost-efficiency and energy-efficiency do not necessarily correlate positively.
general domain tool [4]. System level policies are described in more details in the coming sections. By customizing the system-level policies, users can further specify their preferences. Creation of such user specific policies will happen at the system installation time or occasionally after the system feedback to the user, so the user can adjust his/her preferences. In order to understand the potentials for energy saving, and how to provide the best support to the user to create policies, we conducted a diary experiment presented in the following section.
System-level Policies
The Diary Experiment
Using the findings of the diary experiment, we investigated in creating system-level polices that are directed towards achieving the goal of reducing the costs and overall carbon footprint of the user without compromising on his/her standard of living. These can be described under following broad categories: (i) tariff dependent policies, (ii) device dependent policies, and (iii) threshold dependent policies. This classification is not exhaustive, and there are some additional policies that we define which do not lie in the scope of this classification.
To gain an insight into behavioral patterns within the home, four in-depth interviews were conducted with two men and two women living in individual households. The sample was not meant to be in any way representative for a certain kind of cohort, social class or target group, but was intended to identify occupancy patterns, device types and their corresponding usage. Therefore, two time frames have been analyzed. The interviewees were asked to describe in detail their appliance usage during morning time from getting up to leaving for work – a time frame which is in so far crucial, as morning hours generate peak loads at the energy providers’ side. Additionally, participants were asked to describe a typical week in their lives which was necessary to capture occupancy and sleeping patterns during workdays and weekends. From this information we modeled a normalized seven day period in a single resident household representing the devices in use, occupancy and sleeping patterns. The average energy consumption per device-type was calculated and differentiated by active and passive use.
Tariff dependent policies Tariff dependent policies take into account the information on various current and future pricing schemes published by utilities and available to the system through its smart meter. A schedulable device, for example, may be configured by a policy to operate during low tariff periods of the day.
4
http://www.exaa.at/
37
Device dependent policies Device-dependent policies distinguish between certain device types based on technical specificities and user behavior. These can be categorized as (i) permanent devices, which should never be turned off e.g. a fridge, (ii) stand-by devices, which can be turned off, when nobody is at home or everybody is asleep e.g. TV set, and (iii) ad-hoc devices, which are needed spontaneously e.g. lights. These device specific policies take into account special characteristics of individual devices that can be harnessed in a way to achieve user goals of convenience, cost reduction and reduction of greenhouse emissions. For example, a stand-by device may be turned off by a policy after 15 minutes of staying idle. Threshold dependent policies These policies are based primarily on the limits put on certain environmental conditions in and around the location where the appliances are installed. While on one hand they provide a better user experience by enforcing the most preferred environmental conditions to the user, on the other, they ensure optimal use of energy resources by the appliances. For example, a heater could automatically switch on by applying a policy if temperature falls below 18°C.
User Interaction To obtain user preferences during the initial setup of the system, the users will be guided through a set of questions streamlined with the policy types described above. The aim is to collect primarily behavioral and device-specific information, as well as information on preferences concerning room climate, tariffs and energy types. Typical question sets could be divided under the following categories which again do not necessarily
represent an questions:
exhaustive
classification
of
possible
Behavioral questions Queries seeking policy related information about normal user behavior fall under this category. Such questions would seek information like (i) the user’s waking up times on weekdays, weekends, holidays, etc., (ii) times for going to bed, (iii) times for leaving and returning home from work on various days of the week, (iv) frequency of using dishwasher, washing machine, iron, cooking plates, etc. Environment-related questions These questions gather information about resident’s choices with respect to various environmental conditions like (i) desired temperature limits (higher and lower) in various rooms for various seasons, (ii) desired humidity limits (higher and lower) in various rooms for various seasons, (iii) preferred lighting intensity in various locations, etc. Tariff dependent questions These questions gather information about resident’s choices with respect to (i) preferred type of tariff by a) provider, b) pricing scheme, c) energy mix, and (ii) preferred type of energy: a) green energy b) cheap energy, etc. Device specific questions These questions gather information about resident’s choices with respect to (i) inclusion of schedulable appliances under the intelligent planning by the system, (ii) predefined usage of certain devices while out of home or asleep (i.e. washing machine), (iii) order of preference of tools for cooling the bedroom , (iv) turn
38
off time frame of standby devices after x minutes of being idle, etc. The output of the questionnaire automatically maps into a set of partially predefined system-specific rules. The Policy Acquisition Tool (PAT) is a policy editor and engine that will assist a user in modifying the default policies generated and in creating new policies according to his/her own habits and preferences [4]. After the user feeds in his/her preferences via the questionnaire, the default policies of the system are instantiated and presented in the PAT editor enabling further modification and/or approval. The PAT tool is a web application with JSON based front end for policy construction, editing and saving and a backend reasoning based on the Python version of Euler reasoner. It uses the N3 native knowledge representation format.
Evaluation The empirical modeling of usage patterns performed in the diary experiment lead to the conclusion that a policy based energy control could result in energy savings by simply applying automated turn-off rules to stand-by devices (saving up to 22%)5 and ad-hoc devices alone when streamlined with the behavioral patterns of the user. But to fulfill the requirement of keeping up the resident’s standard of living an “approach of least interference” with the normal user behavior has to be followed. This means that spontaneous changes in predefined settings (triggered by the user) should override policies in place and execute the desired action without delay or pervasive notification. In addition, regular reports shall help the resident to discover interdependencies between usage 5
patterns, energy consumption and costs, so that future decisions can be made on an informed basis. Estimation of the savings achieved in terms of cost and energy is the primary tool that evaluates the effectiveness of SESAME system. A simple formula for calculation of savings achieved by turning off the standby devices can be used:
S = ∑ni = 0 di × (hi - ki), where S= savings in Euro (per day), i = index of the stand-by device, n = total number of stand-by devices in house, di = cost (in Euro) per hour consumed by device ‘i’ in standby mode, hi = number of hours (per day) device ‘i’ normally stays in standby mode and ki = number of hours (per day) device ‘i’ stays in standby mode after interference from the smart home. Similar formulae are used for estimating savings of individual policies that save energy by switching off unnecessary appliances. To test these concepts in a controlled environment, an experimental prototype integrated within a box is created. As shown in Figure 2, it consists of some real devices, two temperature sensors, a movement sensor, two electric heaters, a switch, a plug and it has a capability to integrate simulated and real devices such as a washing machine, cooking plates, refrigerator, etc. An integrated smart meter collects real time data from these in the appropriate scale. System actions on various appliances pertaining to the default and user created policies are implemented through a central UCB controller. The UCB is a universal IP-based control box which acts as a central control device in connecting and controlling the operation of various devices.
http://en.wikipedia.org/wiki/Standby_power
39
system-level rules and are used for reasoning in the SESAME system. Work is underway on assessing savings achieved by policies that attain their goal by different techniques including scheduling of appliances under a variable tariff regime. Special focus is also on user friendly enhancement to the current interface to help non-expert users in easily creating, modifying, deleting and saving their own policies.
Acknowledgements. The work is supported by the FFG COIN funding line, within SESAME project. The Telecommunications Research Center Vienna (FTW) is supported by the Austrian government and the City of Vienna within the competence center program COMET. The authors thank SESAME project partners: E-Smart Systems d.o.o. Belgrade (Serbia), and The Experimental Factory of Scientific Engineering (Chernogolovka, Russia) for their contributions. Figure 2. SESAME Demonstrator
Conclusion The project SESAME uses semantic technology in creating a technical solution that integrates smart metering and demand management, building automation and policy-based reasoning and offers an energy-optimization capability for the energy consumer and provider. The information used is coming from sensors from multiple domains, including the physical sensors (e.g., temperature, light, presence) and the information sensors from the energy management domain services, or other sources, such as weather services, etc. This information is crucial in modeling user preferences and rules. In this paper, we discussed policies which users create to specify their preferences regarding the comfort of living and energy saving goals. These policies are created by customizing
References
[1] Xu, J. et al., Ontology-Based Smart Home Solution and Service Composition. International Conference on Embedded Software and Systems, ICESS’09, 297-304. [2] Ricquebourg, V. et al., Context Inferring in the Smart Home: An SWRL Approach. 21st International Conference on Advanced Information Networking and Applications Workshops. AINAW'07, Vol. 2, pp.290-295 [3] S. Tomic, A. Fensel, M. Schwanzer, M. Kojic Veljovic, M. Stefanovic, Semantics for Energy Efficiency, in Applied Semantic Technologies: Using Semantics in Intelligent Information Processing, April 2010, Publisher: Taylor and Francis, USA. [4] Zhdanova et al., A Semantic Policy Management Environment for End-Users and its Empirical Study, Networked Knowledge - Networked Media: Integrating Knowledge Management, New Media Technologies and Semantic Systems, Springer Verlag (2009).
40
Monitoring Smart Building Performance Using Simulation and Visualisation performance monitoring. The Performance Framework Tool (PFT) enables an energy manager to specify specific scenarios e.g. monitor zone temperature, and can produce energy performance indicator metrics for a building model. The Pudecas simulation and visualisation platform has been integrated with the PFT to provide monitoring of buildings with embedded sensors (Smart Buildings) at the design stage. Underpinning these tools is the Industry Foundation Classes (IFC) building information model (BIM). The discussion in this paper will specifically focus on the relationship between the performance simulation and visualisation models, and the building information model.
Kris McGlinn
Marcus Keane
Trinity College Dublin
National University of Ireland,
2 College Green
University Road,
Dublin 2, Ireland.
Galway, Ireland.
[email protected]
[email protected]
Edward Corry
David Lewis
National University of Ireland,
Trinity College Dublin
University Road,
2 College Green
Galway, Ireland.
Dublin 2, Ireland.
[email protected]
[email protected]
Eleanor O’Neill
Declan O’Sullivan
Trinity College Dublin
Trinity College Dublin
2 College Green
2 College Green
Dublin 2, Ireland.
Dublin 2, Ireland.
Keywords
[email protected]
[email protected]
Smart Building Performance Monitoring, Smart Building Simulation and Visualisation.
Abstract
ACM Classification Keywords
Building energy certification standards require that modern buildings meet strict energy consumption targets. However, energy managers do not currently have the necessary tools to monitor building performance. In this paper we introduce a tool-set that supports simulation and visualisation for energy
Prototyping, User-centred Evaluation/methodology, Modelling.
Introduction In March 2007, the European Council set clear goals to reduce total energy consumption by 20%. The building sector is responsible for 40% of total EU energy consumption1 and so will need to set ambitious
Copyright is held by the author/owner(s). UCSE2010, September 26-29, 2010, Copenhagen, Denmark. ACM ---.
design,
1
http://ec.europa.eu/research/industrial_technologies/lists/energ y-efficient-buildings_en.html
41
objectives in terms of energy reduction. Performance based assessment of building operation during the design process for accountable energy usage will play a significant role in meeting this objective[1]. Monitoring building energy performance requires embedded technologies which measure aspects of the building environment relevant to energy consumption, like the effect of user behaviour on heating, ventilation and air conditioning (HVAC) systems [2]. We refer to buildings with embedded technologies for monitoring the internal environment as Smart Buildings (SBs). To analyse SBs at the design stage requires SB simulation. A large number of building energy simulation programs have been developed to date, more recently becoming more sophisticated and focussing on whole-building simulations. These provide users with key building performance indicators such as energy use and demand, temperature, humidity, and costs [3]. However, significant gaps still remain in current knowledge and tools. For example, there is a lack of tools which monitor energy usage into the operational phase of the Building Life Cycle (BLC), which makes it difficult to determine if the building is meeting its original performance requirements. Also, the impact of user behaviour on building energy consumption at design stage is difficult to monitor [2]. Drawing on the experience of the ubicomp community, Virtual Reality (VR) has been employed to conduct evaluations of applications which require contextual data from sensors, e.g. location [4], [5]. In this paper we look at the integration of the Performance Framework Tool (PFT), a civil engineering tool for defining building performance objectives, with a VR based ubicomp simulation and visualisation platform
(Pudecas) [6], [7]. Central to our approach is a shared Building Information Model (BIM) called the Industry Foundation Classes (IFC).
Background and State of the Art Building Information Modelling The Building Information Model (BIM) is a well established idea within the building industry. It describes a model for storing all the information relevant to the BLC (which defines the life of a building from design, through occupancy and on to demolition) [8]. The BIM extends through the entire life cycle, and therefore performance metrics defined during the design stage, can be used to conduct further monitoring during operation. In order to realise the acceptance of BIMs, the International Alliance for Interoperability (IAI) is developing the Industry Foundation Classes (IFC) standard. IFC has the potential of enabling service engineers to collaborate between heterogeneous disciplines, improving interoperability, reducing costs and overall design quality. Currently, IFC is also the only BIM that is an accepted ISO standard. Smart Building Simulation The use of intuitive visualisation of monitoring results from performance simulation and assessment has been identified as an enabler to easy and quick interpretation of results [1]. Research efforts within the ubicomp community have looked into developing user centric simulated smart environments [4], [5] and these have demonstrated their usefulness when developing and evaluating applications which make use of sensed data. As yet, these approaches have not looked specifically at the use of an industry accepted standard like IFC to model their simulations or applications across the BLC.
42
Within the building performance analysis community, simulation models can be divided into two groups [1]. Those based upon physical (or deterministic) simulation models which use building geometry to build calculation models and those which use statistical (or empirical) calculation models. Physical simulation requires an expert who understands the tools and the process of importing the necessary BIM data to configure the simulation.
Figure 1 Performance Framework Tool
Statistical calculation models are derived from measured data which drive simulations that can then be applied to a range of buildings under certain assumptions (e.g. that building systems behave in a similar manner under similar conditions). For example sensor data, like location, can be simulated [9] which in turn can provide contextual data to applications [10]. The benefit of statistical models over physical models is that once the initial models are created they can be applied quickly to other buildings without the need of detailed building geometry at an early stage of design. When more fine grained analysis is required additional parameters can be added.
Monitoring Tool for Building Assessment
Figure 2 SimConViz Building Monitoring
In this section we introduce the simulation and visualisation based monitoring tool for SB assessment (Figure 3). Firstly we discuss the Performance Framework Tool (PFT) which enables an energy manager to specify building operation scenarios. Following this we discuss the Pudecas platform which has been integrated with PFT and which includes the Virtual Reality Smart Building (VR SB), the SimCon Generator, the SimConViz monitoring tool and underlying statistical models. Finally we discuss how IFC supports the combined toolset.
Figure 3 Monitoring Building Performance
Performance Framework Tool There is significant loss in information throughout the building lifecycle [11], particularly around the client’s brief and initial design information. As a project moves through the BLC, information used during the construction phase is lost as the building becomes operational. Information is passed between professionals in a minimalist manner, resulting in information loss and degradation in quality. This is particularly true for HVAC design intent, which is rarely carried through to the operational phase. The Performance Framework Tool (PFT) seeks to provide a framework for the capture of the building energy performance within the context of the BIM. By capturing design intent and operational characteristics, comparisons can be made with actual performance data, gathered during the operational phase, or simulated performance data.
43
This task requires a formalised, structured approach to the definition of energy performance within buildings and a means of appending this definition to a standardised BIM, using Industry Foundation Classes (IFC). A formal data transformation method has been defined by O’Donnell [12]. This method builds on previous work by Hitchcock, [13] defining the performance aspect concept, aimed at informing building operators about their decisions. Performance aspects are linked to performance objectives, which qualitatively describe a particular aspect of building performance. Objectives are in turn quantified using performance metrics which provide benchmark values for this performance. When taken together, a scenario can be described as a collection of performance objectives, grouped by performance aspect and evaluated using performance metrics. By linking these performance metrics to gathered sensor or simulated data, it is possible to evaluate the qualitative objectives and gain an understanding of how a particular scenario is performing. In this way, a structured overview of building operation, throughout the BLC, can be established, based on the original design intent. The next stage of the process is to accurately define the scenario methodology within the BIM. Design intent requires that the building operates within certain parameters. For instance an overall Energy Usage Intensity (EUI), in kWh/m2/yr will give a certain picture of the potential performance levels of the building. Several factors contribute to this figure. By considering these factors in detail and identifying operational parameters for these components, a far greater understanding can be gained about the building operation. For instance, is a boiler or Air Handling Unit operating within defined parameters?
By capturing design intent within a structured framework, an ongoing analysis can be carried out using building operational data. Building optimisation and fault detection are two significant benefits from this type of analysis. Building management systems tend to gather large amounts of data from various sources. Typically this data is discarded on a 24/48hr basis. By capturing this data and comparing it against design intent, a greater understanding of building performance can be gained. The Performance Framework Tool allows the energy manager to break down the building operation to its constituent parts, benchmarking the performance of each. It serves to provide a framework capable of creating, storing and accessing this context sensitive formally transformed data across the entire building life cycle. By formally capturing design intent, using a structured framework, within the context of a standardised building information model, the operational phase of a building becomes as much a part of the building as the roof or the foundation. By aligning this framework with relevant data streams, building performance can be monitored and optimised.
Pudecas Smart Visualisation
Building
Simulation
and
Interactive Virtual Reality Smart Building During the design phase of an SB, i.e. pre-construction, real data outputs cannot be generated; therefore, simulation of the building environment is necessary. The Pudecas VR SB provides first person interactive environments for conducting user centric building performance monitoring early in the design phase. It provides dual functionality to the Pudecas platform. Firstly, it maintains the global state of the world including information about the precise location of
44
simulated users (avatars). Secondly, it generates XML encoded messages to the other components and monitoring tools which make up the Pudecas platform. This VR simulator is a modification of the popular HalfLife 2 games engine [14]. Multiplayer simulations allow up to 32 users to interact simultaneously in the context of the virtual world. SimCon Generator The SimCon Generator provides dynamic, interactive, simulated sensed data on the state of a simulated SB (e.g. temperature, location). The simulated data streams are modelled as SimCon Sources through a usable interface called the SimConfig tool [10]. The dynamicity of the generated data is the result of configurable response curves and error distributions. Response curves define outputs over a given set of conditions, for example, simulated temperature data which changes depending on the time. Error distributions can be used to model expected deviations in the output to mimic the uncertainty inherent in sensed data. Simulating Sensed Data The simulation models are based upon readings taken from the Environmental Research Institute (ERI) building over a one year period2. The ERI is equipped with more than two hundred sensors and the simulated temperature data is based upon measurements taken by three sensors every fifteen minutes for the year of 2008. The SimCon Generator reads in xml data sets of these readings to create simulated data streams. A mean value is used to provide a more accurate representation of the temperature over a given span of 2
http://www.ucc.ie/en/eri/
time (e.g. from 12:00 to 13:00 hours over the month of June). This value is used as the simulated output and the standard deviation is used to introduce a variance in the output using a Gaussian distribution. This data has been sufficient for early proof of concept testing of the SimConViz building performance monitoring (detailed in the next section), but as yet has not been integrated with the data taken on the state of the VR SB, which is necessary to provide the interactive element required for user centric evaluations. SimConViz SimConViz provides visualisation of building geometry and provides a systems view of different aspects of building state, e.g. temperature and occupancy [10]. SimConViz has been integrated with the PFT tool. PFT performance metrics are compared against simulated data streamed from the SimCon Generator. A traffic light system (highlighted by rings in Figure 2) displays red when a performance metric is falling outside the required range and green when it is within the expected range. This type of visualisation highlights building performance in an intuitive manner and as such should be accessible to the range of expected users who are involved in building monitoring (e.g. energy managers). SimConViz can monitor both simulated data at the design phase and also data produced by real sensors at the operational phase.
BIM Support The IFC approach which supports this tool-set offers significant benefits in terms of interoperability and shared data support. This has meant that the toolset is based on a standardised data model and enables interoperability with IFC compliant 3-D CAD tools. IFC is still limited in terms of sensor definitions and other
45
devices of interest to the ubicomp domain. However, extensions are being developed within the NEMBES project3 to extend the IFC model enabling the toolset presented here to monitor a wider set of considerations more relevant to SBs and the concerns of smart energy management. The NEMBES project has a niche position in that it has brought together professionals from a diverse set of disciplines including Civil Engineering, Architecture, Ubiquitous Computing, Networking, and Sensor Motes and Hardware.
Figure 4 Environment Information Layers for holistic monitoring.
From this experience, we have identified a number of layers within our view of the information model as shown in Figure 4. Each of these information layers represents an aspect of the environment and as such has the potential to impact on the effectiveness of a SB’s performance. Starting with the Building Layout, this layer defines the physical configuration of a building and its spatial relations. Often this is a constant factor within a design process since many SB installations involve retrofitting sensor technology. The 3
http://www.nembes.org/
next layer describes the sensors, their location, positioning and other attributes. The third layer, which is the least mature in this work, looks at supporting investigation of building performance in response to changing quality of sensor data (context). Finally the top two layers look at performance from an occupantcentric point of view. As such these layers include models to support activity and mobility simulations.
Future Directions and Next Steps A number of directions have been identified to progress this work. Firstly, we intend to extend the analysis capabilities to include low level sensor concerns including the impact of the quality of context (sensor data inputs) and system behaviour in response to imperfect context. This will support and account for a fuller profile of analysis for SB systems; potentially going further to address more of the building lifecycle. Secondly, we intend to make more extensive use of the Pudecas VR SB simulator to investigate the impact of occupancy levels on building performance. The new work undertaken as part of this research will draw on the occupancy and mobility simulation in Pudecas to drive multi-occupant test scenarios for building performance analysis.
Conclusion In summary, in this paper we presented a tool-set and framework for monitoring SB performance using simulation and visualisation. Initial integration of the PFT and Pudecas Simulation Platform has been completed. In this work we are providing a tool which can analyse the large data-sets gathered by building management systems to produce meaningful assessment of the building’s performance. Simulation enables designers of these buildings to perform
46
[6]
E. O'Neill, D. Lewis, and O. Conlan, "A simulationbased approach to highly iterative prototyping of ubiquitous computing systems," ICST (Institute for Computer Sciences, Social-Informatics and Telecommunications Engineering), 2009, pp. 1-10.
[7]
K. McGlinn, E. O'Neill, and D. Lewis, "SimCon: a tool for modeling context sources for rapid evaluation of pervasive applications using virtual reality," 5th Annual International Conference on Mobile and Ubiquitous Systems: Computing, Networking, and Services, 2008, p. 1–2.
[8]
B O'Sullivan and M. Keane, "Specification of an IFC based intelligent graphical user interface to support building energy simulation," National Symposium of The Irish Research, 2005, p. 247.
[9]
J. Hightower and G. Borriello, "Location systems for ubiquitous computing," Computer, vol. 34, 2001, p. 57–66.
[10] P. Hoes, J. Hensen, M. Loomans, B. Devries, and D. Bourgeois, "User behavior in whole building simulation," Energy and Buildings, vol. 41, 2009, pp. 295-302.
A. Schmidt, "There is more to context than location," Computers & Graphics, vol. 23, 1999, pp. 893-901.
[11]
S. Dawood, R. Lord, and N. Dawood, "Development of a visual whole life-cycle energy assessment framework for built environment," Proceedings of the 2009 Winter Simulation Conference (WSC), 2009, pp. 2653-2663.
R. Hitchcock, M. Piette, and S. Selkowitz, "Performance metrics and life-cycle information management for building performance assurance," ACEEE 1998 Summer Study on Energy Efficiency in Buildings, Citeseer, 1998, p. 165–177.
[12]
J. O'Donnell, "Specification of Optimum Holistic Building Environmental and Energy Performance Information to Support Informed Decision Making," Doctorate, University College Cork, Ireland, 2009.
[13]
R. Hitchcock, "High-Performance Commercial Building Systems Program," Standardized Building Performance Metrics–Final, 2003, pp. 1-36.
assessments prior to the construction stage with a view to delivering accurate predictions about the buildings efficiency. Finally, visualisation enables us to provide an intuitive view of the environment in which the designer can use their own mental model and spatial understanding of the building to more easily relate to the PFT output.
Acknowledgements This work is supported by the Higher Education Authority (HEA) under the NEMBES project (www.nembes.org).
References and Citations [1]
[2]
[3]
A. Schlueter and F. Thesseling, "Building information model based energy/exergy performance assessment in early design stages," Automation in Construction, vol. 18, 2009, pp. 153-163.
[4]
M. Bylund and F. Espinoza, "Testing and demonstrating context-aware services with Quake III Arena," 2002.
[5]
J. Barton and V. Vijayaraghavan, "UBIWISE," A Ubiquitous Wireless Infrastructure Simulation, 2002.
47
Domestic Energy: Practices and Consumption Author
Abstract
Janine Morley
In this position paper, I outline an inter-disciplinary PhD proposal that intends to investigate the link between domestic energy consumption, domestic practices and social and cultural factors. This will put the data gathered from ubiquitous computing technologies into contention with qualitative social research data. One significant area that can be explored, by combining these methodologies, is the concept of user choice and the associated scope for reduction in energy consumption.
[email protected] PhD Student, Department of Computing, Lancaster University (Starting August 2010)
Keywords Domestic energy, energy consumption, domestic practices, social context
Introduction
Copyright is held by the author/owner(s). Ubiquitous Computing for Sustainable Energy (UCSE2010) Workshop UbiComp’10, September 26–29, 2010, Copenhagen, Denmark.
Domestic energy consumption accounts for about 30% of the UK’s total energy usage and is subject to an active field of research. To date, this research has tended towards identifying generalizable variations, often reduction effects, in energy consumption associated with interventions, social and economic demographics, attitudes, household composition, building design and other factors. Such research methods require quantitative analysis of sufficiently large samples. Despite what Crosbie [1] recognizes as
ACM 978-1-60558-843-8/10/09.
48
a long-held appreciation that household energy use can only be properly accounted for by a cultural or lifestyle model, quantitative methods and their restricted account of social and cultural factors have continued to dominate the field. Where there has been qualitative research into the social and cultural influences on domestic energy consumption (e.g. [2] [3]), it has generally not been associated with finegrained energy use data. Thus, we have on the one hand a multitude of data about energy consumption, some of which suggests that certain variations in domestic consumption are due to behavioural differences but no associated understanding of what these differences actually are and why they exist. On the other hand, we are gaining an understanding of the cultural expectations surrounding energy use, for example comfort or cosiness, but no detailed understanding of how this bears out in practice. As Crosbie argues, a more thorough understanding of domestic energy use depends on combining quantitative and qualitative methods.
Proposed Research The proposed study aims to arrive at a successful and informative combination of quantitative and qualitative data to describe relationships between social and cultural factors, practices in the home and the resulting energy consumption. Quantitative analysis of data gathered from ubiquitous computing technologies will be analyzed in the context of detailed usage data and findings from qualitative social enquiry. In particular, two questions, that should help clarify the scope for and constraints on achieving energy reductions by changing user behaviour, will be examined:
1.
What variation in energy consumption is currently attributable to individual “choices”?
2.
What factors in the social context affects, constructs and defines those individual “choices”?
Choice is a problematic concept that will need careful treatment. It presents difficulties both in terms of defining what a “realistic” choice is and in distinguishing practices where there are potential choices from that which is actually experienced by the user as a choice. The proposed multi-disciplinary approach should be well placed to draw and probe these distinctions, and their significance in the resulting energy consumption.
Researcher Experience and Interests I have a degree in psychology and experience of applying this discipline to research and develop advice on communications and technology use for a large UK public sector organization. Since 2006, my professional work has centred on sustainability. I have worked on climate change plans and policies, analyzed carbon footprints and made recommendations to reduce energy consumption in a local government organization and a UK university. I am particularly interested in the domestic, everyday focus of the proposed study as an area of change and resistance which is highly significant to sustainability.
References [1] Crosbie, T. Household energy studies: the gap between theory and method. Energy & Environment, 17, 5 (2006),735-736 [2] Pierce, J., Schiano, D. J. and Paulos, E. Home, Habits, and Energy: Examining Domestic Interactions and Energy Consumption. Proc. CHI 2010, ACM Press (2010)
49
[3] Woodruff, A., Hasbrouck, J. and Augustin, S. A Bright Green Perspective on Sustainable Choices. Proc. CHI 2008, ACM Press (2008)
50
Persuasive End-User Energy Management Johann Schrammel
Abstract
CURE - Center for Usability Research and Engineering
This paper describes the objectives and work program of the PEEM (Persuasive End-user Energy Management) project. PEEM is a cooperation of CURE, the ICT&S Center at University of Salzburg and SalzburgAG and will run for two years starting in July 2010.
Modecenterstraße 17 / Objekt 2 1110 Wien, Austria
[email protected] Manfred Tscheligi CURE - Center for Usability Research and Engineering &
Keywords
ICT&S Center, University of Salzburg
Energy Feedback, Ambient Displays, Persuasion
[email protected]
ACM Classification Keywords H5.m. Information interfaces and presentation (e.g., HCI): Miscellaneous.
PEEM The objective of the PEEM project is to research and develop new strategies and tools for the home context that provide energy-related feedback to the costumer in a persuasive and unobtrusive way. We want to utilize the potential of ambient displays for reducing energy consumption without loss of comfort for the users. Tailored persuasive approaches overcoming limitations of existing solutions will be developed, prototyped and experimentally validated with real user in realistic longterm settings.
Copyright is held by the author/owner(s). Ubicomp 2010 Workshop: Ubiquitous Computing for Sustainable Energy (UCSE2010)
Research has shown that detailed feedback on domestic energy consumption can substantially contribute to achieve durable effects on energy savings in private households [1]. However, existing solutions such as regular energy bills or conventional home energy
51
displays provide the feedback untimely or in a way that is difficult to understand. It requires the user to make mental efforts to translate the available information into appropriate actions. Furthermore, the information is not presented in the context where it is needed most i.e. when interacting with the home appliances or environment. Therefore the feedback lacks a direct and tangible link to the consumers’ behaviour. Current mechanisms also frequently have shortcomings with regard to long-term effectiveness, as initial results tend to wear off once the novelty effect is over [4]. PEEM therefore aims at improving the communication of energy feedback by seamlessly integrating it in the environment of the user and providing it where and when it is most useful and efficient. Such an integration of feedback could increase the comfort of the users, as no abstract translation and explicit attention towards achieving the goals is needed. Moreover, positive effects on the sustainability of behaviour change are expected.
3 Examples for ambient energy feedback: Power Aware Cord (top), Energy Orb (middle), Energy AWARE Clock (bottom)
The main starting point for the study is to explore persuasive technologies to influence behaviour towards optimized end-user energy management. Recent technological progress especially with regard to computational power, connectivity, availability of data and equipment cost allows deploying persuasive technologies in more and more contexts economically. Hence, advanced strategies of persuasion are technically possible. The potential of such approaches have been shown in different contexts (e.g. [2][3]). Within PEEM we aim to systematically explore the possibilities of ambient persuasive home displays for energy savings and develop targeted strategies for achieving energy-savings in the context home. PEEM
will build on knowledge from existing design concepts and approaches, three especially relevant examples are shown on the left. The developed persuasive ambient displays will be experimentally evaluated in 30 households in and around the city of Salzburg. As we are interested in long-term effects the devices will be in use for 6 months in the households allowing us to differentiate between initial and sustainable effects. The project will deliver valuable results on different levels. First, new prototypes and tools for providing situated and persuasive energy feedback will be developed. Second, guidelines on how to best implement ambient energy feedback in the home context will be defined and third, an empirical quantification of achievable effect sizes using persuasive ambient displays is determined.
References
[1] Darby, S. 2006 The effectiveness of feedback on energy consumption. A review for DEFRA of the literature on metering, billing, and direct displays. University of Oxford, Environmental Change Institute. [2] Froehlich, J., Dillahunt, T., Klasnja, P., Mankoff, J., Consolvo, S., Harrison, B., and Landay, J. A. 2009. UbiGreen: investigating a mobile tool for tracking and supporting green transportation habits. In Proc. CHI '09. ACM. [3] Gustafsson, A. and Bång, M. 2008. Evaluation of a pervasive game for domestic energy engagement among teenagers. In Proc. ACE '08, ACM. [4] Henryson, J., Håkansson, T. and Pyrko, J. 2000. Energy efficiency in buildings through information – Swedish perspective. Energy Policy. Volume 28, Issue 3
52
Towards a PowerPedia – A collaborative energy encyclopedia Markus Weiss
Thorsten Staake
Keywords
Institute for Pervasive Computing
Information Management
ETH Zurich
ETH Zurich
Energy use, visualization, smart meter, mobile computing, feedback systems.
[email protected]
[email protected]
Adrian Merkle
Elgar Fleisch
Institute for Pervasive Computing
Information Management
ETH Zurich
ETH Zurich
[email protected]
[email protected]
ACM Classification Keywords H5.2. Information interfaces and presentation: User interfaces.
General Terms Measurement, Design, Human Factors.
Abstract
Introduction
When it comes to conserving electricity, it is crucial for users to understand how much electricity is used by single appliances. However, the rather technical feedback in pure numbers and intangible units of existing energy feedback systems is not appropriate for most users. To improve this situation, we present PowerPedia, a system that aims at providing action guiding feedback beyond pure consumption values. PowerPedia enables users to identify and compare the consumption of their residential appliances to those of others. It thus helps users to better assess their electricity consumption and draw effective measures to save electricity. Copyright is held by the author/owner(s).
Residential electricity consumption accounts for one third of the total electrical energy produced [1]. Despite considerable efficiency gains with respect to the large and omni-present household appliances (e.g., refrigerators, freezers, washing machines), electricity use for household appliances in the IEA191 grew by 57% from 1990 to 2005 [2]. Moreover, electricity consumption in residential buildings is highly dependent on the behavior of the habitants. Virtually identical households (same buildings with same number of inhabitants, identical age groups, same location, and a similar set of appliances) can easily vary by a factor larger than two 1
19 of 22 countries covered by the International Energy Agency (IEA) provide detailed insights on household energy use.
53
with respect to energy usage [3]. A major burden for people who are willing to save energy at home is the lack of information about their energy consumption. Although, there exist helpful off-the-shelf products that depict the energy consumption in near real time, they do not fully meet the user needs, since their representation is often rather technical and they lack the ability to put the intangible consumption in a picture that allows users to draw conclusions and effective measures.
sumption over time, and consumption equivalents (e.g., CO2). However, with such systems users cannot determine the consumption of single appliances. Another downside is the complex installation due to the required modification around the electric wiring. Other work from Peterson et al. [6] builds upon a circuit breaker box that is to be attached to the fuse box in order to acquire consumption information per circuit and propose a user interface on a mobile phone.
In this work, we present a system that tries to overcome this drawback by providing users with actionguiding feedback rather than pure numbers. PowerPedia enables users to identify and compare the consumption of their residential devices to those of others. At the same time, an efficiency ranking shows users how their appliances perform compared to appliances of the same category. In addition, general and devicespecific measures to conserve energy can be obtained from the community and consumer web sites.
Device-level electricity feedback systems can provide more detailed information about the consumption of single devices. They are mostly realized as smart power outlets that are plugged between the power outlet and the power cord of the appliance that is to be monitored. In order to visualize the consumption data, systems such as Kill-a-Watt [7] and Click [8] feature an attached display that often depicts rather limited information. Other smart power outlets [9, 10] provide remote access to the measured data through wireless communication means and thus enable users to access the data with their mobile phone for example. However, feedback is limited to the devices directly attached to the outlet. To overcome this drawback other research focuses on the development of systems that integrate multiple sensors [11]. A gateway is responsible for the discovery of the smart sockets within communication distance. The approach facilitates functions such as remote switching, supports different user interfaces, and offers local aggregates of device-level services (e.g., the accumulated consumption of all sockets). While the concept is interesting, the application of a large number of current sensors and communication modules is often too cumbersome and expensive [12].
Portable energy feedback systems With the rise of ubiquitous computing technologies, information provisioning at an increasingly detailed level becomes possible. In terms of energy feedback, this has led to systems that provide feedback on the consumption on household and on device level. Household-level systems visualize the total residential electricity consumption with a sensor that is either installed in the fuse box or at the electric mains. There exist several commercially available solutions, e.g., Wattson [4] or Onzo [5] to just name two. In addition to displaying the current overall consumption, most of them also provide other features, such as a presentation of the historical consumption, accumulated con-
54
In contrast to the systems sketched above, our work tries to put the energy consumption in a picture that allows users to better assess and classify the consumption of their residential appliances. In order to conserve energy, users need action guiding feedback rather than technical feedback in intangible numbers [13]. For that, we propose PowerPedia that is based on a smart metering infrastructure and provides users with appliancespecific information on the efficiency and energy saving measures that can be applied to conserve energy.
PowerPedia PowerPedia aims at providing users a tool that allows them to determine more about the electricity consumption of their appliances. Most people do not have an understanding about how much energy is consumed in their households. In particular, they often do not know how much electricity is used by a single appliance or how their appliance performs energy-wise compared to other appliances of the same device category. In the following, we first describe the general concept of PowerPedia before we present the architecture and finally the developed user interface. General Concept The goal of PowerPedia is to make users aware how much energy their residential appliances use. It allows them to better assess the electricity consumption and the energy efficiency of their appliances. For that, users are provided with a possibility to determine the electricity consumption of single devices with simple means (that is an electricity measurement functionality provided on a mobile phone user interface). By connecting a mobile phone directly with a smart electricity meter, users can determine the current electricity consumption of single switchable appliances. However, since many
users have no comprehension of intangible units such as watt or watt-hour, and thus are not able to judge whether that corresponds to a particularly high or low consumption, further support is required. Besides measuring the consumption, users can use PowerPedia to derive further information on the efficiency and specific energy saving possibilities of devices. By publishing the measured device to PowerPedia, users can compare the consumption of the measured device against the consumption of other devices that reside in the same device category and have been previously published by others. In addition, device and category specific energy saving measures can be uploaded. In that way, users become aware of the efficiency of their devices as well as of measures conducted by other users or recommended by consumer organizations. In order to keep track of the most energy-efficient devices of each category, PowerPedia embeds a harvester module that automatically updates the data by incorporating the top performing devices gathered from consumer organizations. The harvester also initializes PowerPedia with a first set of energy-efficiency measures.
Figure 1. Architecture of PowerPedia realized as an extension to the eMeter system.
55
Architecture The overall architecture of PowerPedia is depicted in figure 1. PowerPedia is realized as an additional component to the eMeter system, which is described in more detail in [15]. It consists of two components: the SignatureServer that stores the information about residential appliances and a harvester that is used to automatically update the PowerPedia. In order to access the provided functionality a stationary and a mobile user interface have been implemented.
Table 1. Example URIs of the PowerPedia
The first component, the SignatureServer, is written in PHP using the Recess2 framework. One of the advantages of Recess is the built-in support for REST [14]. This enables users to access resources using URLs. For that, every resource is bound to a unique resource identifier (URI) that can be accessed and modified with corresponding http verbs (GET, PUT, POST, DELETE). The final data format of the resource is not defined by REST, which leads to high flexibility as data can be represented differently just by adding the corresponding ending, e.g., .html for HTML or .json for JSON. Table 1 provides an overview of selected functionalities that are provided by the RESTful PowerPedia API. It details the URI that can be called together with the corresponding http verb to perform the indicated action. Figure 2 shows an example of the JSON representation of device number 96 that is stored in the Signature. It can be obtained as response by simply calling the following URL: http://[serverAddress]/powerPedia/device/96.json
{ "device":{
}, "user":{
}
}
"id":"96", "name":"Osram - Mini Globe", "description":"Leistung (Watt)", "picture":"www.topten.ch/[...]/mglobe-e27.jpg", "manufacturer":"Osram", "type":"Mini Globe", "categoryId":"19", "createdOn":1272312189, "avgWatts":"7.0000", "efficiencyrating":{ "count":4, "position":1, "best":7W, "worst":9W, }, "userId":"5" "id":"5", "username":"m", "password":"x", "createdOn":1273790766
Figure 2. Json represention of a device stored in PowerPedia.
2
www.recessframework.org
The SignatureServer follows the Model-View-Controller paradigm that is the basis of the Recess framework. The following models are implemented: User: The user model is used to store user authentication information. This includes a username, a password as well as the first and last name. Category: The categories are used to group appliances of the same category (e.g. lights). Categories are structured hierarchically, which means that a category can have multiple sub-categories. Devices: The device model is used to represent a signature of each device. It contains fields (figure 2) for the name, a description of the device, a picture, the manufacturer, the type, the consumption, time information, and an efficiency rating. Every device is linked to exactly one category. Recognition: The recognition model is used to store the data that is collected when users measure the electricity consumption and subsequently upload it to PowerPedia. A recognition is linked to a device and to the model of the user who uploaded the recognition. Devicepersonals: To compute the cumulative energy and the costs of a device, the user can specify the usage for every measured device. The model is linked to the user and the device. Furthermore, the user can specify the location of the device (e.g. office, home).
The second component, the harvester, is used to initialize the Powerpedia with a first set of devices and energy saving measures as well as to monthly update the database with the most energy efficient appliances of each category. For that, the SignatureServer starts the update by issuing a GET request to the corresponding URI of the harvester (figure 3). The harvester then scans dedicated external consumer organization web
56
Signature Server
Database
5. Store devices
1. GET Request
4. JSON Response
3. HTML Response 2. GET Request Harvester
External Website
Figure 3. The harvester ensures that the SignatureServer holds a list of the most energy-efficient devices per category.
sites to acquire and extract the data before translating it into JSON. After that, the result of the scan is passed on to the SignatureServer, which updates its list of devices in the database. The mobile user interface exploits the functionality provided by PowerPedia. It is implemented in Java and runs on the Android operating system. To visualize the consumption data acquired by the smart meter, the client sends a GET request to the Energy Server utilizing the REST-API. The server responds with a JSON string, which facilitates the parsing of the data in the application on the mobile device. The same principle is used to publish new devices to PowerPedia as well as to acquire facts, such as efficiency or energy saving measures, of a particular device from PowerPedia. User Interface In order to overcome the drawbacks of existing energy monitoring systems, the Android user interface aims at making users aware of how much energy their residential appliances use. Thus, besides basic feedback features (e.g., current consumption, historic consumption, and standby consumption), the interface provides a measurement functionality that allows users to identify how much single appliances consume. To put the consumption in a bigger, more tangible picture, additional action guiding information, such as appliance efficiency and user-based energy saving measures are provided. For that, users can publish their devices to PowerPedia and compare the consumption against the consumption of devices previously published by others. The measure view (figure 4 left) allows users to interactively measure the electricity consumption of single switchable appliances. To perform a measurement,
users have to initialize the measurement by pressing the start button. Thereafter, users are asked to turn on or off the device that should be measured. Within two to ten seconds, the system will then compute the result based on the measurement algorithm. That is, besides regarding the increase or drop in real power, the algorithm also takes the different electric circuits and additional physical variables, such as apparent power and power factor, into account. This allows determining on which line the switching event has occurred as well as failure detection in the case where two appliances are switched on at the time. In the latter case, users are notified to repeat the measurement, and by comparing the jump after normalization to the previous measurement, the consumption can be identified. Thereafter, users can personalize the measurement (figure 4 middle). The user interface offers the possibility to take pictures of the measured appliance, assign a location, specify a device category and manufacturer, and adjust its utilization to calculate the incurred yearly costs. By publishing the device to PowerPedia, users can compare their measured consumption to the consumption entered by other users as well as to the consumption of the most energy-efficient appliances of the category harvested from consumer organization web sites. An efficiency ranking puts the consumption in a more tangible picture. It shows users the efficiency rank of their device, information on the best and worst performing device as well as the number of uploaded devices in the category. The tips view (figure 4 right) displays energy saving measures loaded from PowerPedia. It consists of tips that can be applied in general as well as specific tips that relate to the device category of published devices. The user interface also offers the possibility to upload
57
one’s own energy saving measures. Tips can be checked to indicate that they have been applied. This allows indicating the percentage of users that already have applied the measure.
Acknowledgements The authors would like to thank our industry partners Landis + Gyr and Illwerke VKW as well as F. Aggeler for their help.
References [1]
EEA USA. www.eia.doe.gov/aer/.
[2] International Energy Agency (IEA) 2008. Worldwide Trends in Energy Use and Efficiency - Key Insights IEA. [3] Parker, D., Hoak, D., Cummings, J. Pilot Evaluation of Energy Savings from Residential Energy Demand Feedback Devices. FSEC, Rpt: FSEC-CR-1742-08, 2008.
Figure 4. Android user interface. Measure view (left), device details (middle), energy saving measures (right).
Conclusions and Future Work In this work, we presented a system that allows users to interactively explore their energy consumption. The possibility to upload the measured data to PowerPedia which serves as a community platform introduces a social networking aspect to energy feedback systems. It puts the energy consumption in a broader picture beyond pure numbers and encourages users to compare the consumption of their devices to those of others. As the system continuously updates the database with the most efficient device types from external sites, it succeeds to provide user with top rated devices. Besides real power, our system also measures additional variables, such as apparent power, distortion power, and power factor. Thus, besides evaluating the prototype, future work targets the possibility to gather a broad collection of appliance signatures that can be used to automatically recognize switching events of devices in the load curve.
[4]
DIY Kyoto. http://www.diykyoto.com, 2010.
[5]
Onzo Ltd. http://www.onzo.co.uk/, 2010.
[6] Peterson, D. et al. WattBot: a residential electricity monitoring and feedback system. Proc. CHI 2009. [7]
P3 International. http://tinyurl.com/436sw, 2010.
[8]
EWZ. http://www.ewz.ch, 2010.
[9]
Energy Optimizers Ltd. http://tiny.cc/nzc7j, 2010.
[10] Paradiso, J.A. Some Novel Applications for Wireless Inertial Sensors. Proc NSTI Nanotech, 2006. [11] Guinard, D., Weiss, M., Trifa, V. Are you EnergyEfficient? Sense it on the Web! Adj. Proc. Pervasive 09. [12] Mattern, F., Staake, T., Weiss, M. ICT for Green – How Computers Can Help Us to Conserve Energy. Proc. e-Energy, 2009. [13] Froehlich, J. Promoting Energy Efficient Behaviors in the Home through Feedback: The Role of HumanComputer Interaction. Proc. HCIC Workshop 2009. [14] R. Fielding, R. Taylor. Principled Design of the Modern Web Architecture. ACM Trans. Internet Technology, 2002, 2(2):115–150. [15] M. Weiss, T. Graml, T. Staake, F. Mattern, and E. Fleisch. Handy feedback: Connecting smart meters with mobile phones. Proc. MUM 2009, Cambridge, UK, 2009.
58