2003 by the Society of Wood Science and Technology. ULTRASONIC ... Ronnie Y. Vunâ . Graduate ... WOOD AND FIBER SCIENCE, JULY 2003, V. 35(3). File # ...
WOOD AND FIBER SCIENCE Tuesday Jun 17 2003 06:16 PM Allen Press • DTPro System
wood 35_207 Mp_381 File # 07tq
ULTRASONIC CHARACTERIZATION OF STRUCTURAL PROPERTIES OF ORIENTED STRANDBOARD: A COMPARISON OF DIRECT-CONTACT AND NON-CONTACT METHODS1 Ronnie Y. Vun† Graduate Research Assistant
Qinglin Wu† Associate Professor Louisiana Forest Products Laboratory School of Renewable Natural Resources Louisiana State University Agricultural Center Baton Rouge, LA 70803
Mahesh C. Bhardwaj Research and Development Director
and
Gary Stead President SecondWave Systems Corporation 1020 East Boal Avenue Boalsburg, PA 16827 (Received January 2002) ABSTRACT
A through-thickness ultrasonic transmission (UT) in oriented strandboard (OSB) was done to compare the performance of direct-contact (DC) and non-contact (NC) ultrasonic systems. The DC measurements produced a higher velocity than the NC system for a given board type, possibly due to transducer’s compression over liquid couplant in the DC method. The UT responses correlated nonlinearly to sample density. The responses were not affected by the panel shelling ratio for the threelayer boards. Viable correlations between panel properties and UT parameters were board-specific for either method. Attenuation and root means square voltage (RMS) parameters were suitably used as density predictors if the flake alignment level is known; otherwise, velocity parameter could be used. In the single-layer boards, internal bond strength, bending stiffness, and breaking resistance were highly correlated to attenuation and RMS, a calibration importance. A density of 900 kg/m3 marked the transition point for the UT responses. The point showed the transition between the diminishing physical effects of the interspatial voids in the lower density half and the increasing plastic-strain hardening modifications in the higher density half. The high correlations of DC-Velocity and NCAttenuation to density and strength properties attest a feasible application of both methods in wood composite research and in a real-time quality control system for fiber-based facilities. Keywords: tenuation.
Densification, direct-contact, non-contact ultrasound, quality control, OSB, velocity, at-
INTRODUCTION
Oriented strandboard (OSB) is one of the modern structural wood composites widely 1 This paper (NO: 02-40-0457) is published with the approval of the Director of the Louisiana Agricultural Experiment Station. † Member of SWST.
Wood and Fiber Science, 35(3), 2003, pp. 381–396 q 2003 by the Society of Wood Science and Technology
used as sheathing, flooring, and I-joist materials in house construction. OSB consists of wood strands or flakes glued with an exteriortype, waterproof resin. Mat layering and alignment of wood flakes are used to improve mechanical properties of the board. The mat formation by depositing resin-coated flakes re-
WOOD AND FIBER SCIENCE Tuesday Jun 17 2003 06:16 PM Allen Press • DTPro System
382
wood 35_207 Mp_382 File # 07tq
WOOD AND FIBER SCIENCE, JULY 2003, V. 35(3)
sults in relatively loosely packed mats. Although mat density increases during hot pressing, the final product still contains a substantial volume of voids (Furuno et al. 1983). Understanding the void structure created by the interactions of raw material and mat formation parameters has many important implications for evolution of the optimal properties into a quality product. In particular, the presence of voids in OSB reduces its elastic moduli and affects its dimensional stability (Lenth and Kamke 1996; Wu 1999). Therefore, attention must be given to the void distribution and its effects on product performance. Voids are strong scatters of elastic waves. Various nondestructive techniques have been used to quantify voids and their effects on panel properties in polymer composites (Judd and Wright 1978). Among these methods, ultrasonic transmission (UT) is the most generally useful technique at present (Chen and Beall 2000; Vun et al. 2000; Jeong 1997; Jeong and Hsu 1995). The method involves transmitting a short pulse of ultrasonic energy through the specimen, measuring the attenuation caused by passage through the material, and defining the maximum acceptable void content in terms of ultrasonic attenuation (Judd and Wright 1978). This method has an advantage over conventional approaches in that it can be used to assess the whole panel rather than only a small portion. The need for application of nondestructive evaluation (NDE) technologies to improve the understanding of material characteristics (i.e., defects, basic properties, geometry, bonding quality, etc.) for wood composites has been overwhelmingly driven from technology push to market pull (Beall 1996a). However, effective applications of the technologies in the necessary operating conditions with reasonable accuracy should be supported with knowledge of material responses obtained from system calibration. In studying wood composites, the NDE is beset with intrinsic material problems such as high attenuation and dispersion, anisotropy, growth properties, and heterogeneity of boundaries (Beall
1996b). In addition, coupling of transducers to wood-based materials as used in the directcontact (DC) system presents the greatest source of variability and the major impediment to on-line implementation of NDE in processing wood-based materials (Ermolov 1998). The factors that affect coupling efficiency include acoustic impedance match of the transducers to the substrate, type of couplants between the transducer and the substrate, and characteristic of the substrate. Thus, the success of UT techniques depends largely on the couplants, including grease/gel couplants, adhesives, elastomerics, and air, and the coupling process. With the advent of high transduction transducers used in non-contact (NC) ultrasonics, the exorbitant acoustic impedance barriers between air and most materials can be resolved (Bhardwaj 1997). This has resulted in a more sensitive NC air-coupling than the gel-coupling technique. Ultrasound technologies have been widely used today as compared to X-ray and g-ray methods because of their cost-effectiveness, portability, non-hazardousness, and applicability to all states except plasma and vacuum of matters (Bhardwaj et al. 2000). For a proper application of the UT techniques in a complex wood composite such as OSB, the effect of void content as influenced by board density on ultrasonic responses and panel properties needs to be investigated. The objectives of this work were (1) to investigate the feasibility of using DC and NC ultrasonic systems for measuring OSB properties as influenced by panel density, flake alignment level, and layering structures; and (2) to establish relationships among the processing variables that determine the material behavior of the boards and UT parameters such that calibration models can be developed for both ultrasonic systems. EXPERIMENTAL PROCEDURES
Specimen preparation Using aspen flakes and liquid phenol-formaldehyde resin, single- and three-layer OSB
WOOD AND FIBER SCIENCE Tuesday Jun 17 2003 06:16 PM Allen Press • DTPro System
wood 35_207 Mp_383 File # 07tq
383
Vun et al.—ULTRASONIC TESTING OF OSB
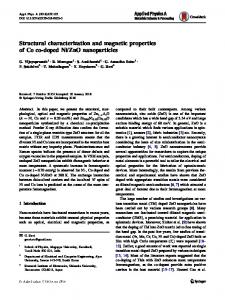
panels were fabricated for the study (Wu 1999; Lee and Wu 2002). Panels in each type were made with 0.5% wax at the 4% RC level (based on oven-dry weight of the wood flakes) in two replicates. The single-layer boards had four nominal densities (450, 650, 850, and 1150 kg/m3), and three alignment levels. The three-layer boards had four shelling ratios (represented by flake weight ratio, FWR, between the face layers and the entire panel), and two alignment levels. The single-layer panels (610 3 610 3 13 mm) were prepressed to thickness prior to heating of the mats for resin curing at 1908C for 6 min. The three-layer panels (610 3 610 3 13 mm) were made with a conventional pressing procedure (one-min closing and 6-min pressing time at 1908C). After hot pressing, the panels were conditioned and edge-trimmed. Based on the measured flake angles from panel surface, flake alignment levels were quantified using percent of alignment (Geimer 1979). The flake alignment level was classified into three categories: (1) high alignment level (HAL), which ranged from 76 to 85%, (2) low alignment level (LAL), from 56 to 59%, and (3) random alignment level (RAL), from 22 to 29%. Ten base specimens (51 3 51 3 13 mm) were randomly selected and cut from each panel replicate, giving a total of twenty samples at each condition. The major flake alignment direction of the panel was marked on the top surface of each sample. The specimens were conditioned at 248C and 60% relative humidity prior to the UT testing to reach an average equilibrium moisture content of 7.2% for all panels. Thereafter, the specimens were destructively evaluated for the mechanical properties. Direct-contact transmission Direct-contact UT measurements were taken in a through-transmission mode with two Panametrics 100-kHz transducers—coupled on each opposite surface of the specimen using silicon gel (Fig. 1a) and a constant pressure under 3-kg weight. A Panametrics 5058 Pulser/Receiver was used to generate a 400volt impulse that excites one transmitting
transducer, and the other transducer captures the transmitted signal. Equipment calibration settings, including gain, damping, pulse height, pulser gain, and attenuator, were selected to cover the whole density range of the specimens tested. With a consistent setting of 40–60 dB gain or 0–80 dB attenuator, 30-dB preamplified signals were sampled at a rate of 5 MHz, and the signals were digitized by a GageScope 8-bit CS225 card and processed by a signal processing software. Velocity, impedance, attenuation, and root mean square (RMS) voltage of the DC ultrasound parameters were used to characterize the properties of the OSB (Vun 1998). The through-thickness velocity, V(m/s), is the ratio between sample thickness and signal transit time: V 5 d/t
(1)
where d is the sample thickness (mm) and t is the signal transit time (ms) across the thickness. The impedance of the material determines the alternating current of stress waves that flows through the material. As an analog to a given alternating current potential difference, the impedance of the ultrasonic current is affected by difference in sample density (Benson 1991). The material impedance, Z (Gg/s.m 2), is then calculated by Z 5 V· r
(2)
where r is the sample density (10 kg/m3). Attenuation is the energy loss associated with a decrease in the wave amplitude scattered by discontinuity and absorption among the different densities. Attenuation, a(dB), is given by 23
a 5 20 Log(A/Aref)
(3)
where A is the peak amplitude (v), and Aref is the maximum amplitude allowable by the system (i.e., 5.2 volts). The RMS voltage represents the signal intensity of the acquired signal (Beauchamp and Yuen 1979), which is measured on a linear scale in voltage and computed by time-averaging rectification as
WOOD AND FIBER SCIENCE Tuesday Jun 17 2003 06:16 PM Allen Press • DTPro System
wood 35_207 Mp_384 File # 07tq
384
WOOD AND FIBER SCIENCE, JULY 2003, V. 35(3)
Fig. 1.
Experimental setup for direct-contact (a) and non-contact (b) ultrasonic systems.
1
1 RMS 5 Dt
E
2
1/2
n (t) dt 2
(4)
where Dt is the time interval (ms) and n is the voltage. Non-contact transmission A SecondWave NCA1000-2E, non-contact ultrasonic system equipped with two 250-kHz, 25-mm NCT102 transducers was used for the NC through-thickness measurements (Fig. 1b). The system uses a deconvolved-chirp specially synthesized to characterize the acoustic impedance of the piezoelectric matching layer, which generates a high air-transduction necessary for NC ultrasound propagation in test materials (Bhardwaj et al. 2000).
The system computes sample thickness and ultrasound velocity according to: dm 5 Va ·tam 5 Va ·[ta 2 (t1 1 t2 )/2] Vm 5
dm [tam 2 (ta 2 t12 )]
(5) (6)
where Vm is the ultrasound velocity through the test material (m/s), Va is the reference ultrasound velocity in air (m/s), dm is the material thickness (m), tam is the time of flight (ToF) in air relative to material thickness (s), ta is the ToF of direct transmission in the air column (s), t1 is the reflected round trip ToF from transducer 1 to the bottom surface of the material (s), t2 is the reflected round trip ToF from transducer 2 to the top surface of the
WOOD AND FIBER SCIENCE Tuesday Jun 17 2003 06:16 PM Allen Press • DTPro System
wood 35_207 Mp_385 File # 07tq
385
Vun et al.—ULTRASONIC TESTING OF OSB
material (s), and t12 is the ToF through air column when material is in between transducer 1 and transducer 2 (Fig. 1b). The attenuation energy is determined by the integrated response (IR). IR (dB) is the net power of the actual ultrasound energy transmitted through the material as evaluated by: IRm 5 IRa 2 IR12
(7)
where IRm is the integrated response of the peak energy transmitted in the material, IRa is the IR in air, and IR12 is the IR in air when the material is in between the transducers. Being frequency independent, IR is related to the transmission coefficient (T) that measures how ultrasound is transmitted from one medium to another, given by: T5
Z1 Z 2 (Z1 1 Z 2 ) 2
(8)
where Z1 and Z2 are the acoustic impedance of ultrasonic propagation in medium 1 and medium 2, respectively. IRm is related to T as IRm 5 20 Log(T)
(9)
The variable IRm provides information on internal material quality such as degree of bonding, nature of the microstructure and texture, absence or presence of phases, and type of inclusions in the material (Bhardwaj 1997; Bhardwaj et al. 2000). The UT measurement with the NCA1000 analyzer was done as follows. After the transducers were aligned, the equipment was calibrated to a known air ultrasound velocity of 344–346 m/s and a reference specimen, a 25.4-mm transparent polystyrene having 21.75 ms round trip ToF and 2320 m/s material velocity under ambient conditions. From the first peak analysis, gates were created forming four ultrasonic paths of propagation. These paths were P1: transducer 1 to transducer 2, P2: transducer 1 to material bottom surface reflection, P3: transducer 2 to material top surface reflection, and P4: transducer 2 to transducer 1. Then, based on the reference velocity and thickness, the velocity, thickness, and ToF of
the test materials were computed and displayed. Panel density and density profile Vertical (thickness) and horizontal (length or width) density profiles of each specimen were mapped using a Quintek Density Profiler (QDP-01X) after UT measurements. The maximum, average, and minimum densities along each direction were evaluated from the measured profiles for each sample. Mechanical properties After UT and density measurements, each base specimen was ripped to obtain two insitu 51 3 13 3 13-mm bending samples with the largest dimension of each sample parallel to the major flake alignment direction, and a 51 3 25 3 13-mm sample for testing internal bond (IB) strength. All tests were conducted with a 4260 Instron machine according to the ASTM-D1037. The IB tests were done at a strain rate of 1 mm/min; whereas the modulus of elasticity (MOE) and modulus of rupture (MOR) of each sample were measured with a 6 mm/min loading rate. Each failed specimen was oven-dried to determine its moisture content at the testing time. IB (MPa), bending stiffness (E·I, MPa.cm4), and breaking resistance (R·S, MPa.cm3) were computed as: IB 5
P bL
(10)
E·I 5 MOE
bh 3 12
(11)
R·S 5 MOR
bh 2 6
(12)
where P is the peak load from the IB test (N), E is the MOE (MPa), I is the moment of inertia given by I 5 bh3 /12 (cm4), R is the MOR (MPa), S is the section modulus given by S 5 bh 2 /6 (cm3), and b, h, and L are the width, height, and length (cm) of the specimen, respectively.
WOOD AND FIBER SCIENCE Tuesday Jun 17 2003 06:16 PM Allen Press • DTPro System
386
wood 35_207 Mp_386 File # 07tq
WOOD AND FIBER SCIENCE, JULY 2003, V. 35(3)
Statistical analysis SAS (2000) software was used to perform analysis of variance (ANOVA) with the Bonferoni adjustment for multiple comparisons of the class groups. The measured ultrasonic parameters, density, and strength are segregated by resin content, flake alignment, board type (i.e., single layer versus three layers), and UT methods. A backward elimination option was used in the model selection procedure to evaluate the sensitivity of the variables to the high and low densities in the vertical and horizontal directions. Scatter plots with the appropriate regressions (polynomial or power) were used to establish the correlations among density, strength properties, acoustic velocity, attenuation, and RMS. RESULTS AND DISCUSSIONS
Density profile and basic properties Typical density profiles for the single- and three-layer boards are shown in Fig. 2. As expected, the single-layer boards had relatively uniform vertical density profiles with an overall density variation of 6 75 kg/m3 about the mean. The uniform profile was attributed to the prepressing prior to mat heating during hot pressing (Wu 1999). For the single-layer panels (Table 1), the general trend of the mechanical properties is an increase with density at all flake alignment levels. MOE, MOR, and IB strength increased as the flake alignment level increased from low to high. The same trends were also observed with the DC velocity. For both methods, the UT velocity increased and UT attenuation decreased as the sample density increased. In the three-layer boards, the M-shape density profiles (Fig. 2b) showed a high surface density and a low core density that led to an overall density variation of 6 144 kg/m3 about the mean. The average MOR (29.4 MPa) of the three-layer panels was significantly lower than that of the single-layer panels (44.5 MPa, excluding the random panels). This was caused by the low-density core layer in the three-layer panels. The panel shelling ratio had
Fig. 2. Typical density profiles of single- (a) and three-layer (b) OSB used in the study.
significant effects on MOR and MOE panels (Table 2). However, its effect on all ultrasonic variables was insignificant. Also, the ultrasonic variables were not affected by differences in flake alignment levels for the boards. Velocity-density correlation The UT velocity in the single-layer boards (Table 1) was generally higher than that of the three-layer boards (Table 2) at a similar density. This was due to difference in the density profile and layering structure between the board types. With a wider density range (465– 1400 kg/m3), the single-layer panels had a higher correlation between the UT velocity and density than the three-layer panels (Table 3). The velocity from both methods responded poorly in the three-layer panels with a narrow density range (600–825 kg/m3) among the boards. The DC method produced a consistently
WOOD AND FIBER SCIENCE Tuesday Jun 17 2003 06:16 PM Allen Press • DTPro System
wood 35_207 Mp_387 File # 07tq
387
Vun et al.—ULTRASONIC TESTING OF OSB
TABLE 1.
Mechanical and ultrasonic properties for the single-layer boards at the 4% RC level.
Boardc type
Density (kg/m3)
Mechanical propertiesb
HAL
LAL
RAL
MOR (MPa)
MOE (MPa)
594 30.4 (5)a (2.1) 783 46.0 (79) (6.3) 1043 65.1 (41) (5.6) 1207 68.4 (42) (1.6) 562 21.0 (22) (1.5) 808 41.4 (50) (3.1) 1013 56.7 (55) (8.0) 1251 64.9 (6) (15) 570 9.9 (46) (2.9) 817 30.1 (57) (5.7) 925 36.0 (84) (8.8)
243 (20) 485 (133) 1056 (214) 1296 (160) 185 (12) 447 (67) 961 (196) 1213 (406) 122 (31) 376 (77) 509 (264)
Ultrasonic propertiesd
RS EI (MPa·cm3) (MPa·cm4)
9.9 (0.6) 14.2 (2.0) 21.2 (2.2) 23.0 (0.5) 7.0 (0.7) 12.9 (0.9) 18.1 (3.0) 20.3 (4.5) 3.2 (1.1) 9.1 (1.7) 12.0 (2.6)
51 (5) 94 (26) 213 (46) 275 (28) 40 (3) 87 (13) 190 (43) 237 (78) 25 (8) 71 (14) 106 (49)
IB (MPa)
DCV (m/s)
DCA (2dB)
DCR (v)
DCZ (Mg/s·m2)
NCV (m/s)
NCA (2dB)
0.64 (0.18) 1.12 (0.18) 1.43 (0.05) 1.47 (0.25) 0.57 (0.12) 0.85 (0.14) 1.16 (0.12) 1.28 (0.07) 0.48 (0.04) 1.13 (0.08) 1.02 (0.24)
810 (112) 920 (61) 1326 (160) 1257 (126) 748 (32) 847 (18) 1270 (47) 1308 (171) 707 (99) 919 (108) 950 (54)
28.25 (5.5) 7.11 (6.0) 1.23 (0.4) 0.75 (0.5) 32.13 (7.5) 2.30 (1.2) 1.56 (1.7) 1.35 (0.8) 29.03 (7.0) 3.74 (3.5) 3.75 (2.5)
0.31 (0.06) 0.88 (0.28) 1.11 (0.07) 1.23 (0.10) 0.24 (0.11) 1.00 (0.11) 1.07 (0.17) 1.13 (0.14) 0.30 (0.10) 1.01 (0.17) 0.92 (0.14)
481 (67) 709 (127) 1222 (375) 1426 (228) 421 (22) 684 (45) 1288 (113) 1636 (210) 407 (87) 752 (123) 882 (125)
610 (7) 770 (66) 905 (83) 1075 (207) 1046 (364) 693 (39) 853 (77) 1103 (274) 638 (56) 724 (75) 721 (51)
83.0 (6.1) 66.7 (2.2) 71.3 (4.1) 84.0 (6.0) 87.8 (5.0) 68.7 (3.6) 79.3 (2.6) 86.7 (8.1) 83.0 (6.0) 72.5 (3.1) 73.3 (3.1)
a
Values in parenthesis are the Standard Deviation. MOR 5 Modulus of rupture (MPa), MOE 5 Modulus of elasticity (MPa), RS 5 Breaking resistance (MPa·cm3), EI 5 Bending stiffness (MPa·cm4), IB 5 Internal bonding strength (MPa). c HAL 5 High alignment level ;80%, LAL 5 Low alignment level ;58%, RAL 5 Random alignment level ;26%. d DC 5 Direct-Contact Method, NC 5 Non-Contact Method, 2V 5 Velocity (m/s), 2A 5 Attenuation (2dB), 2R 5 Root Means Square (volt), 2Z 5 Impedance (1023 Gg/s2m2). b
higher velocity than the NC method (Tables 1 and 2) for a given board type. This was probably because of impedance and frequency mismatch caused by pressurized gel-coupling process in the DC method. Such effects are absent in the NC method. The maximum amplitude of the transmitted wave occurs when the ‘‘acoustic impedances’’ of the media are matched. This kind of matching is required for a wave to be transmitted from one medium to another, for example, from liquid to solid (Benson 1991). This result is consistent with observations made by Bhardwaj (1997) and Bhardwaj et al. (2000) that DC ultrasonic velocities are always higher when working with viscoelastic, cellular, and powder-compact materials—particularly when liquids or gels are used as couplants. Under the current setup, the NC system produced a maximum velocity of 1270 m/s, compared with 1670 m/s from the
DC system for the same board type. The average impedance (a product of velocity and density) in the DC method had higher values than those from the NC method. For both methods, the impedance was significantly affected by the layering of boards. Figure 3a shows a general nonlinear relationship between UT velocity and density. The regression curves between UT velocity and density (Fig. 3) showed the distinctive trends segregated by alignment levels for both methods. Particularly, the NC velocity models seemed effective in segregating the random, low, and high alignment levels in the highdensity range. Meanwhile, the DC velocity models segregated the alignments well in the mid-density range. This observation suggested that both methods could produce a viable velocity-density model, if flake alignment parameter of the test material is known.
WOOD AND FIBER SCIENCE Tuesday Jun 17 2003 06:16 PM Allen Press • DTPro System
388
wood 35_207 Mp_388 File # 07tq
WOOD AND FIBER SCIENCE, JULY 2003, V. 35(3)
TABLE 2.
Mechanical and ultrasonic properties for the three-layer boards at 4% RC level. Mechanical properties
FWRa
Density (kg/m3)
MOR (MPa)
MOE (MPa)
Ultrasonic properties
RS (MPa·cm3)
-----------------------------------------------------------------------------------
0.3 0.4 0.5 0.6
744 (48) 725 (18) 751 (43) 748 (31)
26.5 (3.0) 30.5 (3.1) 31.0 (2.5) 33.2 (3.1)
395 (23) 414 (19) 489 (48) 514 (49)
9.0 (1.3) 10.1 (1.1) 10.3 (0.8) 11.0 (0.7)
-----------------------------------------------------------------------------------
0.3 0.4 0.5 0.6 a
718 (46) 767 (49) 722 (82) 700 (23)
26.9 (3.3) 30.1 (3.2) 28.1 (6.7) 26.2 (3.3)
413 (56) 493 (73) 421 (117) 383 (33)
9.5 (1.3) 10.8 (1.8) 9.8 (2.2) 9.2 (1.2)
EI (MPa·cm4)
DCV (m/s)
DCA (2dB)
DCR (v)
DCZ (Mg/s·m2)
NCV (m/s)
NCA (2dB)
High Alignment Level ----------------------------------------------------------------------------------87 701 4.26 0.93 518 571 79.0 (2) (90) (4.3) (0.19) (41) (27) (4.9) 89 710 5.92 0.84 514 608 77.0 (4) (35) (4.2) (0.21) (24) (48) (2.8) 105 719 0.91 1.18 539 615 78.8 (10) (24) (0.7) (0.10) (21) (22) (3.8) 109 736 2.46 1.08 549 603 78.2 (7) (65) (3.0) (0.24) (46) (32) (1.3) Low Alignment Level -----------------------------------------------------------------------------------96 753 6.52 0.91 542 652 78.8 (14) (60) (8.7) (0.37) (75) (38) (2.9) 113 792 1.69 1.16 607 650 77.2 (8) (46) (2.6) (0.26) (49) (19) (6.5) 95 747 8.16 0.83 540 653 79.2 (25) (53) (11) (0.30) (78) (77) (2.6) 88 731 10.0 0.75 512 637 79.8 (8) (46) (14) (0.35) (42) (61) (5.3)
Flake weight ratio between the face layers and the entire panel. Other notations are the same as shown in Table 1.
TABLE 3. Model parameters for ultrasonic DC and NC properties and panel density at the combined alignment level. Model Y 5 A 1 B r 1 C r2 1 D r3, where Y 5 Velocity, Attenuation or RMS and density r in kg/m3. Significant parameters were evaluated by the backward elimination procedure at the 10% significant level. UTa parameter
Regression coefficientc (combined valued) Panel typeb
A
B
Velocity (m/s) 213.03615 / / /
------------------------------------------------------------------------------------------
DC 2 Vel NC 2 Vel
1L4%RC 3L4%RC 1L4%RC 3L4%RC
3909.46 736.04 511.55 624.4
--------------------------------------------------------------------------------------
DC 2 A NC 2 A
1L4%RC 3L4%RC 1L4%RC 3L4%RC
251.23 594.85 173.53 146.57
--------------------------------------------------------------------------------
DC 2 RMS a
1L4%RC 3L4%RC
22.46 24.41
c
D
R2
-------------------------------------------------------------------------------------------
1.67E202 / 3.30E204 /
26.42E206 / / /
0.70 0.00 0.64 0.00
Attenuation (2dB) --------------------------------------------------------------------------------------6.08E204 20.6785 21.80E207 0.86 21.5416 1.00E203 / 0.47 / 0.61 20.23536 1.34E204 24.06E204 3.80E207 0.12 /
Root means square (volt) --------------------------------------------------------------------------------0.006518 / 0.83 22.93E206 / 22.00E208 0.37 2.57E205
NC and DC denote non-contact and direct-contact methods, respectively. 1L and 3L denote one- and three-layer boards, and 4%RC denotes 4% resin content. / denotes eliminated non-significant coefficients. d Combined alignment and flake weight ratio for the 1L and 3L, respectively. b
C
WOOD AND FIBER SCIENCE Tuesday Jun 17 2003 06:16 PM Allen Press • DTPro System
wood 35_207 Mp_389 File # 07tq
Vun et al.—ULTRASONIC TESTING OF OSB
389
Fig. 4. Scatter plots of the DC and NC attenuation (Att) and DC RMS against density for the three-layer (3L) panels (combined shelling ratios) at the 4% RC level.
Fig. 3. Scatter plots of the velocity, attenuation, and RMS voltage (r) as a function of average panel density for 4% RC single-layer (1L) panels, segregated by DC and NC methods.
Attenuation/RMS-density correlation Typical non-linear attenuation- and RMSdensity relationships in the single-layer panels are shown in Fig. 3b for both methods. The NC attenuation decreased as the density increased, and reached a minimum at about 900 kg/m3. Above the density level, the NC attenuation increased as the density increased further. This indicates certain internal property changes as a result of densification under heat-
ing during hot pressing. The DC attenuation decreased and the DC RMS increased as the density increased. Above the 900 kg/m3 density point, both curves leveled off. This further indicates internal property changes above the density level. The density level showed the transition between the diminishing physical effects of the interspatial voids in the lower density half and the increasing plastic-strain hardening modifications in the higher density half. In contrast to the difference in UT velocity, the three-layer panels had similar patterns of attenuation and RMS responses (Fig. 4) as those of single-layer panels. The DC attenuation-density models had consistently higher R 2 values than the NC attenuation-density models (Table 3). The predicted DC attenuation and RMS were invariant to flake alignment changes. This indicated that the DC attenuation and DC RMS were effective in detecting internal properties beyond physical impediments of interfacial boundary of the material. The DC RMS models, approximately inverse to the DC attenuation, showed a better correlation (R 2 $ 0.98) with density for the 1L4%RC panels. Strength-density correlation IB strength, bending stiffness (E·I), and breaking resistance (R·S) were highly corre-
WOOD AND FIBER SCIENCE Tuesday Jun 17 2003 06:16 PM Allen Press • DTPro System
0.97 0.87 0.96 0.79 a
Model Y 5 AX2 1 BX 1 C, where Y 5 internal bond (IB, MPa), bending stiffness (E.I., MPa·cm4), or breaking resistance (R.S., MPa·cm3), and X 5 average density (kg/m3).
26.5543 214.601 213.486 29.1633 0.0125 0.0463 0.0467 0.0283 8E206 20.00001 20.00001 22E206 0.89 0.82 0.96 0.87 174.2 .82889 14.682 34.335 20.5673 0.1654 20.1057 20.1681 0.0005 0.00008 0.0003 0.0003 0.76 0.85 0.88 0.78 0.0044 0.0013 0.0073 0.0037 20.000002 23E208 20.000003 20.000001 Random Low High Combined
21.4204 20.1555 22.4965 21.1138
C B
Breaking resistance
A R2 C B
Bending stiffness
A R2 C B
Internal bond strength
A
A quadratic polynomial regression was done to establish correlation between panel strength properties (i.e., IB, EI, and RS) and UT parameters (i.e., velocity, attenuation, and RMS). The model parameters are summarized in Table 5. The models, plotted in Fig. 6 and 7, were well fitted with the experimental data. As shown in Table 5, all three strength properties correlated better to the DC parameters (velocity, attenuation, and RMS) as compared with the NC parameters. This indicates that strength prediction based on DC measurements would be more accurate than the NC methods. It can be seen from the plots in Fig. 6 that the relationships between the IB strength, EI, or RS and the UT velocity formed a similar trend as the strength-density relationship. There was a general linear relationship for velocity up to about 1250 m/s for both methods.
Panel alignment
Panel strength-UT property correlation
Parameters for the polynomial model between mechanical properties and density for the single-layer 4%RC panels.a
lated with average density for all panels (Table 4). Figure 5 shows that the strength-density models fitted well with the experimental data at various alignment levels. Rising IB-density curves (combined alignment level) are seen in the panels. This shows a potential for IB improvement in the 1L4%RC panels by increasing resin content and/or density of the panel. Furthermore, a significant improvement of the IB strength can be realized by increasing alignment level from random to high (Fig. 5 and Table 1) at a given density level. Both E·I and R·S were highly correlated to the average sample density (R 2 . 0.79). The E·I-density correlations improved from random to high alignment boards (Table 4). The increasing E·I slopes with alignments (Fig. 5) indicate that higher bending stiffness could be achieved with higher flake alignments regardless of density level. However, the R·S-density curves have similar slopes and different intercepts for the different alignment levels, indicating that the intrinsic material strength rather than the flake alignment influences the breaking ruptures for all panel types.
R2
WOOD AND FIBER SCIENCE, JULY 2003, V. 35(3)
TABLE 4.
390
wood 35_207 Mp_390 File # 07tq
WOOD AND FIBER SCIENCE Tuesday Jun 17 2003 06:16 PM Allen Press • DTPro System
wood 35_207 Mp_391 File # 07tq
Vun et al.—ULTRASONIC TESTING OF OSB
391
Beyond that velocity, the DC curves leveled off significantly indicating that all strength properties became independent of the UT velocity in the density range. The flake alignment levels showed little effects on the relationship. There was also a similar general trend for the NC data. All three mechanical properties (i.e., IB, EI, and RS) showed an increased trend with DC RMS and a decreasing trend with DC attenuation (Fig. 7). The relationship is generally nonlinear (Table 5). The mechanical properties showed an inconsistent trend with NC attenuation for boards at all flake alignment levels. Flake alignment levels did not significantly influence the UT measurements from both DC and NC methods. Thus, under the current NC settings, strength prediction based on NC attenuation would be inaccurate for OSB products. In the three-layer boards, the NC attenuation showed invariant responses to the panel shelling ratio (i.e., FWR in Table 2). However, the DC attenuation had a minimum value at FWR 5 0.5 for the high alignment boards; whereas, the DC RMS had a maximum value. UT parameter-panel property interactions
Fig. 5. Scatter plots of internal bond (IB), bending stiffness (E·I), and breaking resistance (R·S) versus density for single-layer boards, segregated by high (HAL), low (LAL), and random (RAL) alignment levels.
Table 6 shows the results of the sensitivity analysis through the backward elimination procedure to show the interactions among the panel properties and UT parameters as influenced by high and low densities in the thickness and horizontal planes of each sample. The average density was strongly correlated to the low and high thickness densities. The low density in both planes significantly affected the bending stiffness of the high-alignment panels. As expected, the high stress concentration was formed in the low density ranges, leading to the bending fracture. Velocity, in general, was significantly restrained by the low-density points in the thickness direction, especially for the high alignment panels. It was significantly dependent on the high-density area in the horizontal plane for propagation. Particularly, the low-vertical and high-horizontal densities restrained NC
WOOD AND FIBER SCIENCE Tuesday Jun 17 2003 06:16 PM Allen Press • DTPro System
392
WOOD AND FIBER SCIENCE, JULY 2003, V. 35(3)
TABLE 5.
Y
IB
EI
RS
wood 35_207 Mp_392 File # 07tq
Parameters for panel strength and UT property models for the single-layer 4%RC boards.a DC 2 velocity (m/s)
Align level
A
B
Random Low High Combined Random Low High Combined Random Low High Combined
22.E206 23.E206 22.E206 22.E206 22.E204 27.E204 24.E204 23.E204 22.E205 24.E205 22.E205 22.E205
0.0044 0.0065 0.0054 0.0052 0.5357 1.7473 1.1565 0.831 0.0581 0.1064 0.0693 0.0687
NC 2 Velocity (m/s) C
R2
A
B
C
R2
21.6712 22.8514 22.1862 22.1413 2246.76 2886.85 2615.66 2433.95 226.673 248.538 230.055 231.565
0.55 0.88 0.61 0.65 0.46 0.79 0.77 0.71 0.69 0.78 0.87 0.76
26.E206 26.E207 24.E206 22.E206 25.E204 23.E204 25.E204 21.E204 22.E205 21.E206 26.E205 23.E205
0.0097 0.0022 0.0083 0.0053 0.8508 0.7144 1.3426 0.6371 0.0605 0.0244 0.1256 0.0753
23.1715 20.3998 22.9333 21.6737 2293.85 2267.94 2579.53 2287.61 221.69 23.752 246.393 228.095
0.24 0.63 0.78 0.57 0.12 0.42 0.74 0.61 0.23 0.42 0.82 0.58
a Model Y 5 AX2 1 BX 1 C, where Y 5 internal bond strength (IB, MPa), bending stiffness (E.I., MPa·cm4), or breaking resistance (R.S., MPa·cm3); X 5 Velocity (m/s), Attenuation (2dB), or RMS (v).
velocity. This suggests that the high-horizontal density facilitated the tortuosity of velocity flux into the material, taking paths hindered by the bottleneck of the lowest thickness density portion. It appeared to present a ‘‘path of the least resistance’’ for the wave energy regardless of the original direction of the wave (also observed by Dickens et al. 1996). The DC attenuation and RMS behaved in a similar
manner. The energy loss in attenuation for both methods was caused by reflections along the high- and low-density boundaries in the thickness direction, and by lateral scattering along the horizontal density plane. CONCLUSIONS
Through-thickness DC and NC ultrasonic transmission responses were used successfully
Fig. 6. Scatter plots of DC and NC velocities versus IB, E.I. and R.S. for single-layer, 4% RC boards, segregated by high (HAL), low (LAL), and random (RAL) alignment levels.
WOOD AND FIBER SCIENCE Tuesday Jun 17 2003 06:16 PM Allen Press • DTPro System
wood 35_207 Mp_393 File # 07tq
393
Vun et al.—ULTRASONIC TESTING OF OSB
TABLE 5.
Extended. DC 2 Attenuation (dB)
A
B
0.0006 20.044 20.0002 20.0077 0.0005 20.0436 0.0004 20.0342 0.0712 24.7309 0.0417 24.9312 0.2998 214.82 0.1659 29.6383 0.0054 20.4483 0.0048 20.4519 0.0181 20.9359 0.0103 20.6775
NC 2 Attenuation (dB) C
1.2006 1.0558 1.4392 1.2511 101.12 162.35 220.79 171.02 11.726 17.052 21.279 17.336
R2
0.81 0.53 0.84 0.66 0.49 0.34 0.64 0.42 0.71 0.52 0.77 0.49
A
B
DC 2 RMS (v) C
20.0033 0.4664 215.394 20.0005 22.7437 0.0888 0.0031 20.4798 19.323 0.0017 20.2628 11.105 20.572 83.914 22992.7 20.35 55.617 22064.2 0.4091 258.047 2188.7 0.3457 249.991 1909.7 20.0532 7.6543 2265.28 20.024 3.696 2126.74 0.0217 23.206 134.26 23.6606 151.87 0.024
to characterize OSB’s basic properties as influenced by processing variables. All UT responses in relation to the sample density were distributed nonlinearly. DC velocity was higher than the NC velocity, presumably because of transducer or liquid couplant compression effects in the DC method and agglomeration of surfaces as affected by heat and pressure treatments. Generally good models in the single-layer boards were attributed to the nature of the internal structure defined by the uniform density profile and the mean larger density range. The ultrasonic properties were not affected by the panel shelling ratios for the three-layer boards. The unique DC velocity and NC attenuation responses approaching the inflection density (900 kg/m3) indicated the diminishing effects of the physical voids in the low-density half and the strain hardening in the high-density half. The facts attested that the processing formulation in panel manufacturing, particularly high-density panels, could have definite effects on ultrasonic properties. The strength properties of the boards generally increased with density and flake alignment levels. Viable density models devised in either method were board-specific. Attenuation and RMS were an effective predictor of density if flake alignment level was not known; otherwise the UT velocity could be used. High density–strength correlations were ob-
R2
A
20.7664 0.45 20.4449 0.12 20.6341 0.24 20.3256 0.06 0.28 2105.22 0.16 292.287 118.97 0.18 74.356 0.07 0.46 210.586 25.4168 0.05 3.6106 0.06 3.408 0.03
B
C
1.8303 0.0329 1.1318 0.3565 1.8352 0.1276 1.218 0.2659 228.434 223.64 22.2581 245.65 31.077 14.777 22.96 41.141 22.5095 23.827 4.0763 17.237 6.8702 7.5363 4.6268 7.0564
R2
0.79 0.53 0.84 0.67 0.47 0.34 0.68 0.45 0.70 0.52 0.79 0.53
served for all board types. The bending stiffness correlated highly to low density points in both thickness and horizontal directions, whereas the breaking resistance correlated well to high sample density. Velocity from both methods depended significantly on the low thickness density, whereas the attenuation/ RMS was significantly affected by high and low density boundaries in the thickness direction. The high correlations in both UT– strength and UT–density relationships signal that UT techniques can provide a quick effective assessment of OSB’s internal characteristics. Although the NC system does provide a suitably remote measurement convenience, we recommend that the instrumentation setup and calibration consideration need to match the natural frequency of the test material. With a proper calibration technique, the ultrasonic method is an effective tool for wood composite research and for on-line quality monitoring in fiber-based facilities. ACKNOWLEDGMENTS
The financial support to this project by USDA NRI Competitive Grant Program (99351103-8298) is gratefully acknowledged. The authors wish to thank the SecondWave System Corporation for providing the noncontact ultrasonic transmission measurements,
WOOD AND FIBER SCIENCE Tuesday Jun 17 2003 06:16 PM Allen Press • DTPro System
394
wood 35_207 Mp_394 File # 07tq
WOOD AND FIBER SCIENCE, JULY 2003, V. 35(3)
Fig. 7. Scatter plots of NC attenuation, DC RMS and DC attenuation versus IB, E.I. and R.S. for single-layer, 4% RC boards, segregated by high (HAL), low (LAL), and random (RAL) alignment levels.
WOOD AND FIBER SCIENCE Tuesday Jun 17 2003 06:16 PM Allen Press • DTPro System
wood 35_207 Mp_395 File # 07tq
395
Vun et al.—ULTRASONIC TESTING OF OSB
TABLE 6. Sensitivity test (in p-values) using backward elimination procedure to evaluate levels of interactions and influences among the structural properties and UT parameters in the high and low densities areas along the thickness and horizontal planes for 4% RC panels. Vertical-Thickness Variables
Alignment level
Density High
Stiffness (E.I.)
Combined Random Low High Combined Random Low High Combined Random Low High Combined Random Low High Combined Random Low High Combined Random Low High Combined Random Low High Combined Random Low High
0.0929 NS NS NS NS 0.0001 NS NS 0.0001 0.0001 0.0036 0.017 NS 0.0001 0.018 NS 0.0022 NS 0.0003 NS 0.0058 NS 0.0036 NS NS NS NS NS 0.0012 0.0006 0.0001 NS
Breaking (R.S.)
AvepDensity
DCpVelocity
DCpAttenuation
DCpRMS
NCpVelocity
NCpAttenuation
and Dr. Aravamudhan Raman, Department of Mechanical Engineering, Louisiana State University, for his helpful suggestions. REFERENCES
AMERICAN SOCIETY FOR TESTING AND MATERIALS (ASTM). 1996. Annual Book of ASTM Standard D1037-96, American Society for Testing and Materials, Philadelphia, PA. BEALL, C. F. 1996a. Application of ultrasonic technology to wood and wood-based materials. In Ferenc Divos, ed. Proc. 2nd University of Western Hungary International Conference on the Wood Science/Technology and Forestry. Sopron, Hungary. . 1996b. Future of nondestructive evaluation of
Horizontal-Plane
Density Low
Density High
Density Low
NS NS NS 0.0001 NS NS NS NS 0.0001 0.002 0.0001 0.0413 0.0001 NS NS 0.0001 0.0005 0.0001 0.0038 NS 0.0161 0.0001 0.038 NS 0.0001 0.0397 NS 0.0001 0.0001 NS 0.0001 0.0088
NS NS NS NS NS NS NS 0.0001 NS NS NS 0.0012 NS NS 0.001 NS 0.01 NS NS 0.0001 0.0722 NS NS 0.0001 0.0132 NS 0.0016 NS 0.0958 NS NS 0.0105
0.0001 0.0001 0.0001 NS 0.0001 NS 0.0001 NS 0.0018 NS 0.0401 0.0099 NS NS NS NS NS 0.0156 NS NS NS NS NS NS NS NS NS NS NS 0.0098 NS NS
wood and wood-based materials. Keynote pages 409– 413 in Proc. 10th International Conference on NDE of Civil Structures & Materials, Boulder, CO. BEAUCHAMP, K. G., AND C. K. YUEN. 1979. Digital methods for signal analysis. George Allen & Unwin Ltd., Boston, MA. BENSON, H. 1991. University physics. John Wiley & Sons, New York, NY. pp. 663–672; 962 pp. BHARDWAJ, M. C. 1997. Innovation in non-contact ultrasonic analysis: Applications for hidden objects detection. Mat. Res. Innovation 1:188–196. , I. NEESON, AND G. STEAD. 2000. Introduction to contact-free ultrasonic characterization and analysis of consolidated materials. Technical report at the Application of Nondestructive Evaluation in Powder Metals Seminar. Iowa State Univ., Ames, IA. 13 pp.
WOOD AND FIBER SCIENCE Tuesday Jun 17 2003 06:16 PM Allen Press • DTPro System
396
wood 35_207 Mp_396 File # 07tq
WOOD AND FIBER SCIENCE, JULY 2003, V. 35(3)
CHEN, L-H., AND F. C. BEALL. 2000. Monitoring bond strength development in particleboard during pressing, using acousto-ultrasonics. Wood Fiber Sci. 32(4):466– 477. DICKENS, J. R., D. A. BENDER, AND D. E. BRAY. 1996. A critical-angle ultrasonic technique for inspection of wood parallel-to-grain. Wood Fiber Sci. 28(3):380–388. ERMOLOV, I. N. 1998. Major ultrasonic inspection problem. Russian J. Nondestructive Testing 34(1):35–37. Plenum Publishing, New York, NY. FURUNO, T., C-Y. HSE, AND W. A. COTE. 1983. Observation of microscopic factors affecting strength and dimensional properties of hardwood flakeboard. Pages 297– 312 in T. M. Maloney, ed. Proc. 17th Washington State University International Symposium on ParticleboardComposite Materials. Pullman, WA. GEIMER, R. L. 1979. Data basic to engineering design of reconstituted flakeboard. Pages 105–125 in T. M. Maloney, ed. Proc. 13th Washington State University International Symposium on Particleboard/Composite Materials. Pullman, WA. JEONG, H. 1997. Effects of voids on the mechanical strength and ultrasonics attenuation of laminated composites. J Composite Mater. 31(3):276–292. , and D. K. HSU. 1995. Experimental analysis of porosity-induced ultrasonic attenuation and velocity
change in carbon composites. Ultrasonics 33(3):195– 203. JUDD, N. C. W., AND W. W. WRIGHT. 1978. Voids and their effects on the mechanical properties of composites—An appraisal. SAMPE Journal, January/February: 10–14. LEE, N. J., AND Q. WU. 2002. In-plane dimensional stability of three-layer oriented strandboard. Wood Fiber Sci. 34(1):77–95. LENTH, C. A., AND F. A. KAMKE. 1996. Investigations of flakeboard mat consolidation. Part I. Characterization the cellular structure. Wood Fiber Sci. 28(2):153–167. SAS INSTITUTE INC. 2000. SAS User’s Guide version 8.0. SAS Institute Inc., Cary, NC. VUN, R. Y-H. 1998. Monitoring creep rupture in oriented strandboard using acoustic emission FPL rep. 36-01138, University of California Forest Product Laboratory, Richmond, CA. 87 pp. , Q. WU, M. C. BHARDWAJ, AND G. STEAD. 2000. Through-thickness ultrasonic transmission properties of oriented strandboard. Pages 77–86 in Ferenc Divos, ed. Proc. 12th University of Western Hungary International Symposium on Nondestructive Testing of Wood. Sopron, Hungary. WU, Q. 1999. In-plane dimensional stability of oriented strand panel: Effect of processing variables. Wood Fiber Sci. 31(1):28–40.