Journal of Cleaner Production xxx (2018) xxx-xxx
Contents lists available at ScienceDirect
F
Journal of Cleaner Production
OO
journal homepage: www.elsevier.com
Conceptualization, modeling and environmental impact assessment of a natural rubber techno-ecological system with nutrient, water and energy integration a b
PR
Elias Martinez-Hernandeza, J.E. Hernandez Ob, ∗
Department of Chemical Engineering, University of Bath, Bath, BA2 7AY, UK Chemical and Environmental Engineering Department, Bioinspired Engineering Research Group, The University of Nottingham, Malaysia
ABSTRACT
Article history: Received 3 June 2017 Received in revised form 26 February 2018 Accepted 27 February 2018 Available online xxx
Simultaneous consideration of ecological and technological processes could be a systematic approach to cleaner crop production systems that preserve ecosystem states and services. Herein, we conceptualized a techno-ecological integration between a rubber plantation and latex processing. We applied a two-component framework to describe and model the resulting techno-ecological interactions to analyze the potential benefits in latex productivity and carbon capture as ecosystem services. The ecological component includes: processes in the rubber plantation affecting carbon, nitrogen, water, biomass, and latex production. The technological component includes: latex concentration process; effluent treatment and anaerobic digestion (AD) to recover water, nutrients and energy. The main synergistic interaction was through the recycling of nutrients, which allowed maintaining nutrient availability for tree growth and increase latex yield. Water recovered was recycled within the technological component to save 85% of freshwater for latex processing. Water for irrigation came from external sources. The resulting system potentially enhances carbon capture and latex production by 16% and 62%, respectively, compared to a conventional plantation (no irrigation and fertilization only in the establishment stage). In addition, our LCA based environmental assessment showed that the major global warming (GWP), acidification (AP) and eutrophication potential (EP) impacts come from nitrogen emissions in the plantation and electricity used for water irrigation and latex processing. The conceptual techno-ecological integration reduced the impacts from fertilizer input, water for processing, water treatment and heat, by 78% of GWP, 64% of AP and 79% of EP, with respect to a non-integrated system. 11.7% of the total nitrogen required throughout the plantation cycle is supplied by chemical fertilizer during establishment stage, but the GWP, EP and AP impacts from this are offset by the 88.3% coming from recycling during the productive stage. Other production systems could benefit from the approach presented herein, showing explicit modeling of interactions, integration and assessment of a techno-ecological system.
1. Introduction
UN CO R
RE
Keywords: Techno-ecological system Sustainable design Natural rubber Ecosystems modeling
CT ED
ARTICLE INFO
Agricultural intensification increased yields that satisfy rising demands on food, energy and crop-based raw materials such as natural rubber (Matson et al., 1997), called hereafter rubber. Rubber is obtained after processing latex which is produced in plantations of Hevea brasiliensis - called hereafter rubber tree. Rubber is a raw material, used to manufacture a broad range of items ranging from tires to health products. Plantations are mainly located in tropical Southeast Asian countries, being Thailand, Indonesia and Malaysia -the major rubber producers (ANRCP, 2009). However, as demands increase, this industry continues to expand by introducing rubber plantations to new locations, jeopardizing their ecosystems capacities to produce resources. A recent study estimated that 4.3–8.5 million ha of additional rubber plantations are needed to meet projected in
∗
Corresponding author. Chemical and Environmental Engineering Department, Bioinspired Engineering Research Group, The University of Nottingham, Malaysia.
Email addresses:
[email protected] (E. Martinez-Hernandez);
[email protected] (J.E. Hernandez O) https://doi.org/10.1016/j.jclepro.2018.02.297 0959-6526/ © 2018.
© 2018.
dustrial demand by 2024 (Warren-Thomas et al., 2015), threatening forests worldwide. This is worsened by the expansion of palm oil delocalizing rubber plantations to sub-optimal agroclimatic conditions in India, Vietnam and China, where land use change would affect basin water balance, soil quality and carbon stocks (Fox et al., 2014). Even the use of marginal areas may damage high-biodiversity and risk economic failure because plantations are poorly adapted to local conditions (Ahrends et al., 2015). The disturbances would exacerbate if water effluents from latex processing end up polluting water bodies and the environment. Therefore, production systems providing environmental sustainability need to be engineered to improve the long-term viability of the rubber industry (Fox et al., 2014). Many studies have focused rubber plantations only, looking at the effects of agronomic and climatic conditions, such as the average daily temperature (Alam et al., 2003); the relationship between soil water stress and tree transpiration (Sopharat et al., 2014) and between tree growth and transpiration (APA Kobayashi et al., 2014), the effect of water irrigation under non-optimal climatic conditions (Vijayakumar et al., 1998) and the hydrological ecosystem service provided by rubber plantations (Jiang and Wang, 2003). More studies
Journal of Cleaner Production xxx (2018) xxx-xxx
OO
F
(Warren-Thomas et al., 2015; Ahrends et al., 2015). However, managed rubber plantations can capture carbon continuously and provide wood, e.g. for furniture and bioenergy (FAOKillmann, 2001). Technologically, the rubber industry produces effluents high in organic and nitrogen content likely affecting water bodies, paddy fields and human health (Mohammadi et al., 2013). H2S dissolved in rubber processing wastewater can make water non-potable for several hundred miles downstream from the production facilities (Rungruang and Babel, 2008). Clearly, the rubber industry directly interacts with ecosystem components (water bodies, soil and air), human activities (agriculture) and the society (population health). Understanding such interactions would help to create an integrated techno-ecological system in which is also possible to reuse water and nutrients, maintaining ecosystem states, mitigating negative impacts and ultimately enhancing the environmental sustainability. The natural rubber techno-ecological system was conceptualized with the help of a systematic characterization and modeling framework, which enabled the screening of synergistic interactions that enhance latex yield and carbon capture as ecosystem services. Nitrogen fertilization and irrigation have shown to be two of the most important factors influencing the growth, yield and quality of rubber (Mak et al., 2008). Therefore, the search for possible synergistic interactions was focused on looking for nitrogen and water interactions that can be beneficial for the system performance in terms of carbon capture and latex yield while reducing environmental impacts. As a result, such interactions included mainly the recycling of nutrients and water within the system, and therefore the dynamic modeling of the effect of irrigation and N-fertilization on rubber plantation is also an added value of our contribution. An environmental impact assessment following a life cycle assessment (LCA) approach was also carried out to assess the potential benefits resulting from the conceptualized techno-ecological system.
CT ED
dealing with water relationships of the tree were reviewed in (Carr and Review, 2012). The effects of fertilization and soil type have also been studied (Salisu et al., 2013), (Mak et al., 2008). Experimental studies exist for different locations, focusing on a small set of variables in short term experiments, thus making it difficult to analyze possible dynamic interactions. Models could help to analyze trends under different climatic and agronomic management conditions agronomic, such as the CENTURY model (Williams et al., 1989) or the EPIC model (Williams et al., 1989). These models have not been adapted to rubber plantations, require the specification of a large number of parameters and do not consider the integration with technological components. Models specific to rubber plantations range from simple growth dynamics [16] and carbon sequestration (Chantuma et al., 2004; Blagodatsky et al., 2016), to integrated modeling capturing the influence of water, nutrients and light, transpiration, and latex yield (Boithias et al., 2012). On the technological side, one study applied life cycle assessment to partially assess the environmental performance of concentrated latex production in Thailand (Jawjit et al., 2015), other studies focused on energy efficiency (DEDE Department of Alternative Energy Development and Efficiency, 2007) or options for wastewater treatment of latex processing (Jariyaboon et al., 2015; Mohammadi et al., 2013; Rungruang and Babel, 2008). The aforementioned studies set the basis for understanding rubber plantations and latex processing separately. However, there is a need for approaches analyzing interactions, performance and impacts of an integrated techno-ecological system where interactions can be clearly identified and analyzed. For instance, to maximize the productivity of agricultural systems and efficiently manage and conserve ecosystem services requires looking at soil nitrogen, carbon and water dynamics as affected by techno-ecological interactions (Martinez-Hernandez et al., 2015). Facilitating the development of ecologically based strategies can increase the sustainability of agricultural production while reducing off-site consequences (Matson et al., 1997). An example of this is the development of techno-ecological synergies that consider the role of ecosystem services in designing sustainable production systems (Urban and Bakshi, 2009). A multiscale assessment framework ensures that techno-ecological integration provides a balance between supply and demand of ecosystem services without shifting problems to other scales (Bakshi et al., 2015) (Hanes and Bakshi, 2015). A life cycle perspective which includes ecosystems within the boundaries is also important to evaluate techno-ecological systems (Schaubroeck et al., 2013), and to assess whether industrial activities can operate within the capacity of local ecosystems (Gopalakrishnan et al., 2016). The search for and implementation of solutions may need to start at the local scale to enable the direct management of local ecosystems (MEA Millennium Ecosystem Assessment, 2005). Existing frameworks have considered the local and larger scales within which several ecosystem service demands and sources can exist and be balanced (Bakshi et al., 2015; Gopalakrishnan et al., 2016), but not necessarily considering a direct linkage between the component demanding the service and the component supplying it. The dynamics of the ecosystem states that support the flows of ecosystem services also need to be explicitly considered. A modeling framework capturing such details would be a necessary starting point to explore the way to exploit beneficial synergies (Martinez-Hernandez et al., 2016). In this work, we conceptualized a techno-ecological design and integration between the plantation (the ecological component) and latex processing (the technological component). Ecologically, the rubber industry displaces plants, thus affecting ecosystem structure and functions and releases carbon stored in biomass and soil
PR
2
2. Methods
UN CO R
RE
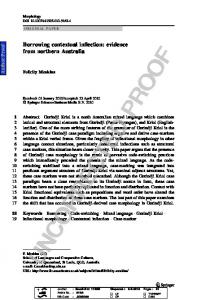
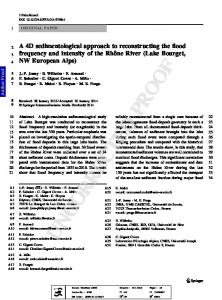
The conceptualized techno-ecological system for latex processing (technical component) and the rubber plantation (ecosystem component) is shown in Fig. 1. Its components, processes, states and flows in this rubber techno-ecological system are described throughout this section, followed by characterization and modeling as per the framework for local production systems with techno-ecological interactions presented in (Martinez-Hernandez et al., 2016). The framework is useful to conceptualize and model the dynamics of a techno-ecological system. It considers effects on ecosystem biomass, nitrogen and carbon states for a bioenergy production system based on heathland biomass. The framework involves two major stages: a conceptual characterization and a mathematical modeling. Also, it is adapted to the rubber techno-ecological system as explained in the following sections. An additional aspect presented in our work is the modeling of the water balance in plantations due to its importance in non-traditional cultivation regions. Furthermore, an environmental impact assessment not considered before in the original framework is added here. 2.1. Conceptual characterization of the rubber techno-ecological system According to the framework in (Martinez-Hernandez et al., 2016), the first stage involves conceptual characterization, i.e. specification of objectives, system boundaries, components (e.g. plantation, latex processing), states (carbon, nitrogen and water in soil) and processes (e.g. biomass growth, latex concentration, nutrient recovery). Its var
3
PR
OO
F
Journal of Cleaner Production xxx (2018) xxx-xxx
CT ED
Fig. 1. Rubber techno-ecological ecosystem.
ious steps are applied to the rubber techno-ecological system (Fig. 1) as follows:
UN CO R
RE
1. Define objectives, indicators, temporal and spatial scale. The objective is to analyze the potential benefit of linking latex processing with the natural plantations through water and nutrient recycling on an annual basis. A spatial scale of 1 ha or plantation is used as the basis for calculations. The ecosystem services of latex production and carbon capture were used to analyze the techno-ecological performance of the integrated system. The plantation cycle considered is 30 years. 2. Identify ecosystem and technological components. As shown in Fig. 1, the ecosystem component involves plantation, the technological components involve latex processing and effluent treatment with anaerobic digestion and steam produced in a biogas boiler. 3. Identify states and flows. Plantations in suboptimal conditions can affect or be affected by water and nitrogen states (or stocks) in soil, thus these states are analyzed together with carbon stock. The main flows of interest are the latex flow production (provisioning service), carbon capture rate (regulating service) by the rubber component, as well as nitrogen, water and energy recovered by the processing component. 4. Identify processes affecting the states and flows. The processes affecting the water state considered in this study are: evapotranspiration from soil, transpiration by rubber trees, precipitation and latex tapping. In the case of nitrogen state, the processes considered are: litter fall and mineralization, leaching, volatilization, nitrogen uptake and latex tapping. Nitrogen state in soil is only nitrogen available for growth. For carbon state in soil we included: litter fall, carbon loss or volatilization, uptake and latex tapping. 5. Identify opportunities for techno-ecological integration. The key to integration between techno-ecological components is the identification of possible synergetic interactions. To the best of our knowledge, these two-way interactions and techno-ecological integration have not been studied before using the rubber industry as a model. We explored the possibility of recycling water and nutrients after latex processing, with the intention of preserving these
states, ecosystem services (for latex production) and enhancing carbon capture. The identification of opportunities for techno-ecological integration is performed following a source-sink matching process and identifying any process needed in between. This involves identifying available flows that could be “sources” that could be used to satisfy demands or “sinks” of resources (e.g. water or nutrients). For example, the plantation is a nutrient sink as trees need nitrogen to grow, while wastewater from latex processing can be a source as it contains nutrients. Therefore, matching such flows is enabled by an anaerobic digestion process during wastewater treatment in the technological side, which can be synergistically integrated with the plantation through recycling of nutrients. 6. Environmental impact assessment. To assess the environmental benefits of the integrated system an assessment was performed following a life cycle assessment (LCA) approach to quantify global warming, acidification, and eutrophication potentials and compared to a non-integrated system. After defining the system and key variables, models are developed as shown in the next section. 2.2. Modeling of the rubber techno-ecological system To quantitatively assess a system, in terms of behavior and performance, mathematical characterization by means of modeling is required. Behavioral modeling (Section 2.2.1) comprises establishing conservation and constitutive equations for each relevant state, especially in the slowest processes which are generally those in the ecological component (Martinez-Hernandez et al., 2015, 2016). Performance modeling (Section 2.2.2) consists of developing indicator equations in terms of states or flows fed from the behavioral modeling, which determines the final techno-ecological system outputs and impact from its components interplay. All the model inputs and parameters for the models are presented in Appendix A. Table 2 shows the mapping of flows and states shown in Fig. 1 and the variables and equations used in the models.
4
Journal of Cleaner Production xxx (2018) xxx-xxx
Table 1 Model inputs for simulation of plantation.
(1) Units
Reference
Plantation area Plantation density Tapping starts when Tapping frequency Plantation life cycle Time step Initial conditions Initial tree girth size Initial biomass Initial N in soil Initial water in soil Initial carbon in soil
Ap dp G tf τ
1 571 50 2 30 1
ha trees ha−1 cm days years month
Basis (Sopharat et al., 2014) FAOKillmann, 2001) (Alam et al., 2003) (FAOKillmann, 2001) Basis
G0 B0 N0 W0 C0
15 4830 120 0.25 8000
cm kg ha−1 kg ha−1 fraction kg ha−1
Assumed Calculated from G0 Assumed Assumed Assumed
where is the net growth rate of the trees (i.e. generation minus losses by leaf fall). Fharv is the harvesting rate due to cutting trees for wood or biochar production (performed at the end of the trees economic life). Usually, net standing biomass stock correlates to tree girth size G (cm) (Chandrasekhar, 2012), a value that is used to calculate above-ground biomass BAG for a plantation area Ap (ha) of density dp (trees ha−1) as in (Chandrasekhar, 2012):
F
Value
OO
Symbol
where α1 and are correlation coefficients. The rate of tree girth growth can be used as a proxy for modeling biomass growth as in (Chandrasekhar, 2012), with the equation modified to capture the influence by nitrogen and water on net tree growth, as follows:
Symbol
Equation or reference
States Water in soil N in soil C in soil
W N
Eq. 5 Eq. 6 Eq. 10
–
–
– Flat Fcl – –
Eq. 1
Eq. 11 Eq. 12 Equal to Precipitation minus interception and minus run off Eq. 19 Eq. 7 (Martinez-Hernandez et al., 2015) Eq. 20 Eq. 9 (Martinez-Hernandez et al., 2015) Eq. 23 (Martinez-Hernandez et al., 2015) (Martinez-Hernandez et al., 2015) Eq. 21 Eq. 26 Calculated from Fcl (Eq. (26)) (MEA Millennium Ecosystem Assessment, 2005) (MEA Millennium Ecosystem Assessment, 2005) Eq. 24 Eq. 25
Heat
–
Timber Char
Mtimber Mchar
(3)
where Gm is the maximum girth size (cm) and kg is the growth constant (y−1), fN is the nitrogen influence factor and fW is the water influence factor on growth. Using experimental data in (Salisu et al., 2013), we developed a model to correlate the nitrogen influence factor fN to nitrogen state: (4)
where α2, , and δ2 are correlation coefficients. For illustrative purposes of this conceptual case study, water influence on girth growth fW (Eq. (3)) has been correlated to the water in soil as shown in the other constitutive equations section. Water stress may reduce tree transpiration and growth (Carr and Review, 2012), and so far, there is not a model correlating tree growth to water state or inputs for the specific case of natural rubber trees.
RE
Csoil BAG
UN CO R
Biomass Flows Soil Evaporation Transpiration Water uptake Rainfall reaching the soil Recycled water N Volatilization N uptake N recycle N leaching N in litter C capture C loss C in litter Latex Concentrated latex Low quality rubber Biogas
CT ED
Table 2 Mapping of states and flows in Fig. 1 to the variables and equations in the models. Name in Fig. 1
(2)
PR
Model input
2.2.1. Behavioral modeling We formulated conservation equations characterizing system behavior as rates of change of states (water, nitrogen and carbon in soil and biomass) along time (t) together with their constitutive equations (Martinez-Hernandez et al., 2016). This allows for tracking and capturing any effects of changes in states due to flows and processes, and it is formulated as follows. 2.2.1.1. Tree growth and biomass The rate of change of tree above-ground biomass (BAG in kg ha−1) in the plantation can be expressed as:
2.2.1.2. Soil water balance of the plantation This balance was developed using, as state variable, the water fraction over a layer of soil depth. Thus, we modeled the rate of change of water fraction as:
(5) where W is the water fraction in soil (dimensionless), is the rainfall (m) over time step τ, and fws is the fraction of water that enters the soil (after discounting interception and run off), is the irrigation (m) applied over time step τ,
Journal of Cleaner Production xxx (2018) xxx-xxx
2.2.1.3. Nitrogen balance of the plantation We modeled a nitrogen balance considering the rate of change of nitrogen in soil (N) available for growth:
(6)
F
2.2.1.5. Other constitutive equations This section shows the equations defining some factors and flows in the conservation equations shown previously. Soil evapotranspiration affects soil water balance (Eq. (5)), and it is commonly correlated to potential evapotranspiration with soil moisture functions or coefficients (Xu and Singh, 1998; Mintz and Walker, 1993). A function that relates evapotranspiration ( ) to potential evapotranspiration (ET0) and moisture level has been effectively used with monthly climate values (Xu and Singh, 1998). We followed a similar approach by using the ratio between the soil water state and the soil water filed capacity (Mintz and Walker, 1993):
OO
Several of these values can be calculated as explained in the section Other constitutive equations.
where is the rate of biomass mortality (litter production rate) (kg ha−1 y−1), and yC is the carbon mass fraction, is the carbon loss to the air (kg ha−1 y−1).
PR
is the water loss to air due to soil evapotranspiration (m) over time step τ, is the transpiration (m) over time step τ of the plantation trees, which drives water uptake from soil, Flat is the tapped latex (kg ha−1) over time step τ, and is the water content in latex; the factor 107 is a unit conversion factor. z is the soil depth (m).
where
UN CO R
(7)
(8)
where kNvol is the rate of nitrogen volatilization (y ) and nitrogen mass fraction in latex.
is the
2.2.1.4. Carbon capture in soil
We modeled the rate of change in carbon content in soil (Csoil in kg ha−1 y−1) as:
(10)
(13)
where wmin is the minimum water fraction in soil (a.k.a. wilting point). Then, fREW is determined depending on the values of REW and its critical value for trees to be under water stress (REWc) according to (Sopharat et al., 2014):
(9)
−1
(12)
In Eq. (12), reduction factors capturing the effect of changes in relative extractable water in soil (fREW) and in evapotranspiration (fET0) are applied to ET0. Relative extractable water (REW) by trees is calculated as (Sopharat et al., 2014):
RE
The units for the components of nitrogen balance are kg ha−1 applied over time step τ. is an input either by using chemical fertilizer or recycled nitrogen from the technological component. and have been modeled as a function of biomass state (i.e. biomass quantity) and growth rate as shown in (Martinez-Hernandez et al., 2015). Mineralization rate depends on the amount of litter in soil, the amount of litter depends on litter production while litter production depends on biomass quantity available. Thus, the mineralization term is a function of standing tree biomass and the nitrogen content in such biomass. The nitrogen uptake is a function of growth and nitrogen content in soil as captured by Eqs. (3) and (4). , and are modeled as shown in Eqs. (7)–(9):
(11)
where wf is the water fraction in soil at field capacity. ET0 is the reference evapotranspiration (mm) for trees under specific location and environmental conditions determined as in (Allen et al., 1998). Tree transpiration is modeled following a validated framework to analyze water constraints on seasonal transpiration (Sopharat et al., 2014), as shown in Equations (12)–(16):
CT ED
is the nitrogen fertilizer, is the nitrogen mineralization rate of the litter fall in soil, is the rate of nitrogen uptake by trees, is the nitrogen volatilization rate and is the nitrogen removed by latex tapping.
5
(14) where
captures the effect of canopy size by the ratio of leaf
area index (LAI) at time t and the maximum value when canopy is full (LAImax). Thus, when the trees are not under water stress, only the canopy size is affecting transpiration, otherwise the amount of water in soil becomes also important (Sopharat et al., 2014). The value of fET0 is determined by comparing ET0 against both a critical value ET0c and an empirical correlation (Sopharat et al.,
Journal of Cleaner Production xxx (2018) xxx-xxx
(15) Using the similar approach as in (Sopharat et al., 2014), the water influence factor on girth size growth (fW) in Eq. (3) is determined depending on the value of REW as:
(16)
2.2.2. Performance modeling In this section, we present the models used to estimate the capacity of the system to provide ecosystem services via the ecological component (e.g. latex and wood production) as well as to provide products and services (e.g. rubber, timber and energy) for consumption or further processing through the technological component.
F
2014):
2.2.2.1. Ecological component Latex production is an ecosystem service from the plantation and is one of the main indicators of performance reduced (latex yield) by water stress as it does with transpiration alike (Sopharat et al., 2014; APA Kobayashi et al., 2014; Carr and Review, 2012; Boithias et al., 2012). Thus, the influence of water stress on latex productivity has been considered through factor fws in Equation (21).
OO
6
(17)
(22)
Another ecosystem service of interest is carbon capture rate, and we modeled it by including carbon capture in soil and standing biomass (kg ha−1 y−1) as follows:
(23)
RE
2.2.1.6. Connectivity equations Connectivity equations represent the synergy between the ecosystem and the technological component. The first connectivity is through the flow of fresh latex going out from the plantation Fout (kg ha−1 y−1) to the latex processing facility (kg ha−1 y−1):
(21)
where l0 is a reference latex yield (kg per tree and per tapping), tf is the tapping frequency in days (e.g. for tapping every other day, tf = 2), θ is the number of days in the time step τ (e.g. 30 days in a month). fws is determined according to (Thomas and Lasminingsih, 1994):
CT ED
where G0 is the initial girth size (cm). By multiplying Equation (12) by fg, the transpiration rate will increase by a fraction given by the ratio between the current growth (G − G0) to the maximum possible growth (Gm − G0).
PR
As the girth size increase with age, an increase in transpiration rate would be expected and therefore we captured this by introducing factor :
(18)
UN CO R
After treatment of wastewater, the technological component may then recycle back water (for reuse) and nitrogen (for fertilization): (19)
(20)
where (kg ha−1 y−1) is the inlet water flow to the plantation which is equal to the outlet from the latex processing facility (kg ha−1 y−1). Similarly, (kg ha−1 y−1) is the nitrogen recycled entering the plantation, equal to the flow from going out of the latex processing facility (kg ha−1 y−1). Note that the flows in Eqs. (19) and (20) would be part of the irrigation ( and fertilizer ( ) flows in the water and nitrogen balance equation, respectively. Thus, if the water recycled is the only irrigation source . Similarly, if the nutrient recycled from the latex processing facility is the only fertilization source then .
where is the carbon mass fraction in latex. B (kg ha−1) is total biomass above (stem, branches and leaves) plus below ground (roots) and equal to BAG/fAG, where fAG is the fraction of above-ground biomass to total biomass. The potential annual amount of wood obtained at the end of the plantation economic life is estimated from a simulation throughout the plantation life. Thus, we estimated timber wood (Mtimber in kg ha−1) provided as ecosystem service from: (24) where ystem is the fraction of the stem in the above ground biomass, Ytimq is the yield of timber of required standard quality obtained from the total timber harvested. We also assumed that the residual biomass (branches plus low-quality wood timber) is used for charcoal production (Mchar in kg ha−1): (25) where Ychar is the yield of char per residual wood and yleaf is the leaves fraction in B.
Journal of Cleaner Production xxx (2018) xxx-xxx
2.2.3. Inputs to simulate natural rubber plantation The model is fed with parameters involving initial conditions and events through the plantation cycle. It is possible to specify the initial girth size, carbon, nitrogen, and water contents in soil, as well as girth size for which latex tapping starts. The model considers that tapping is suspended during wintering. Main model inputs are presented in Table 1. Model parameters are shown in Appendix A.
F
2.2.2.2. Technological components The amount of concentrated latex produced Fcl (kg ha−1 y−1) is calculated from the rubber content in fresh latex (1) and the concentration efficiency ηc:
logical component and the technological component provides a service to the agroecosystem by recovering and recycling back water and nutrients.
(26)
(27)
We carried out a techno-ecological integration using the rubber industry as a model, specifically dealing with a rubber plantation in Southeast Asia where agroclimatic conditions for rubber growth are sub-optimal and thus water and nutrient states in soil can be of importance for the economic viability and sustainability of the crop. We also considered conditions that are representative of sub-optimal environments for plantations (Priyadarshan et al., 2005), in particular, climatic conditions corresponding to northeast Thailand (Sopharat et al., 2014) while other assumptions are detailed in Appendix A. We first applied the model to a conventional plantation without techno-ecological integration to test the model in terms of realistic representation of expected trends. Then, the model is applied to quantify and analyze the performance in the conceptualized techno-ecological system. Simulations were performed for a 30-year plantation cycle and with a time step of 1 month.
CT ED
where the fwe is the amount of wastewater or effluent produced per amount of latex. This amount of wastewater goes to the wastewater treatment plant and includes the water initially contained in latex. Water irrigation ( ) was captured in the water balance (Eq. (5)) using the tree transpiration and we introduced a factor that can be varied to find the irrigation required to maintain the water level in soil:
3. Results and discussion
PR
There is an unrecovered amount during concentration, called serum, and is processed to produce low quality rubber. Latex processing is water intensive and generates large amounts of wastewater (Fww in kg ha−1 y−1), and we calculated it as follows:
OO
Using low-quality wood and residual biomass for char production would avoid indiscriminate fires and prevent air pollution, e.g. haze, a recurrent pollution problem in Southeast Asia presently witnessed by both authors in Malaysia.
7
(28)
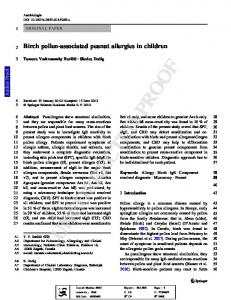
3.1. Conventional plantation A conventional plantation here is assumed to be a smallholder plantation where irrigation is not practiced and fertilization (from externally supplied artificial fertilizer) is applied at the establishment stage of the plantation only. Fig. 2 shows the results for each year after plantation for the various ecosystem states and their rates of change throughout the 30 years' simulation. Three periods can be distinguished:
RE
ft is a variable fraction (between 0 and 1) of transpiration water requirement by trees. The clean water recovered from water treatment could be recycled back to latex processing or used for irrigation and we calculated this by: (29)
UN CO R
Fcw is the clean water recovered (kg ha−1 y−1) and fcw is the water fraction recovery by the treatment process. The wastewater treatment also includes anaerobic digestion to recover nutrients and biogas, which is used for steam generation in a boiler. The amounts of biogas and heat produced were calculated as shown in (Martinez-Hernandez et al., 2016). It was assumed that up to 95% of the initial nitrogen entering the latex processing can be recovered in the residual stream after anaerobic digestion (also called digestate) and recycled as fertilizer ( in kg ha−1 y−1) to the plantation. This assumes 5% losses due to volatilization in biogas and during handling of the digestate (Smith et al., 2007). (30)
fNrec is the fraction of initial nitrogen in latex that is recovered for recycling (0.95), which together with irrigation water, reconnect nutrient and water loops. In this way, a symbiosis is established since the agroecosystem provides latex as ecosystem service to the techno
3.1.1. Establishment From year 0 up to the year where the required girth size for tapping (50 cm) is reached in about 6 years (Fig. 2a), which represents well the typical age for tapping (i.e. the action of collecting latex from rubber trees) to start between the 5th to 7th year after planting (FAOKillmann, 2001). Note that in this period the nitrogen in soil decreases (Fig. 2b) due to the uptake of rubber for growth that cannot be compensated by the nitrogen from tree litter mineralization. Thus, here is where fertilization is needed the most, and this is indeed the current practice (FAOKillmann, 2001; Salisu et al., 2013). The carbon capture rate (Fig. 2c) shows a slight depleting trend at the beginning, which can be because of the soil carbon volatilization being higher than the carbon replenished by litter; however, the carbon state (Fig. 2b) is rapidly compensated as the trees grow relatively fast (Samarappuli, 1996). The water level change (Fig. 2d) shows also a depleting trend, this could be due to a narrow canopy of young trees which cannot prevent water from evaporating from soil. Because of these depleting trends, intercropping during the establishment years can help to maintain balance in soil (Samarappuli, 1996; Jall, 2009; Sivanadyan et al., 1995). However, this was not considered in this study but this will create additional ecosystem services that would need to be evaluated.
Journal of Cleaner Production xxx (2018) xxx-xxx
CT ED
PR
OO
F
8
RE
Fig. 2. Simulation results for the conventional plantation: a) tree girth size and soil water content; b) Carbon (C) and nitrogen (N) state in soil; c) Carbon (C) capture rate, Nitrogen (N) accumulation rate and dry rubber yield, d) girth growth rate and water level change rate.
UN CO R
3.1.2. Continuous growth and tapping In Fig. 2b, nitrogen starts to accumulate after year 5 but the accumulation rate (Fig. 2c) declines slightly once tapping is triggered because of the nitrogen removed in latex. Note that the water depletion trend (negative change rate) is maintained throughout the plantation life time and this causes water fraction in soil to decrease steadily (Fig. 2a). This causes water stress and is reflected in low yields (Fig. 2c). The carbon capture and nitrogen accumulation rates reach a maximum (at year 14 and 18, respectively) and then both rates decline (Fig. 2c) mainly due to the decrease in tree growth rate as it approaches its mature stage (Fig. 2d). The carbon captured by a plantation in Northeastern Thailand was 215.39 Mg ha−1 at 20 years (Saengruksawong et al., 2012), which is similar to our estimate of 210 Mg ha−1. Fig. 2b shows that the carbon state continues increasing steadily while the nitrogen state in soil recovers to the initial state at about year 10 and then continues accumulation due to the mineralized nitrogen from leave fall during wintering periods. The maximum nitrogen accumulation rate in soil was 27.6 kg ha−1 y−1 (Fig. 2c), which is similar to the 22.4 kg ha−1 y−1 reported in (Murbach et al., 2003). 3.1.3. End of plantation cycle At about year 25, the carbon state tends to stabilize (Fig. 2b) as the girth size reaches its maximum (Fig. 2a), meaning that the trees are fully mature and thus the model also identifies the end of the plantation cycle. Note that the water level also starts to stabilize (Fig.
2a) but at a level where the trees may suffer water stress and may need to extract water from lower soil layers, which can potentially decrease water table in some regions (Guardiola-Claramonte et al., 2010). This means that some irrigation is necessary to keep the water balance in soil. The total carbon captured (in soil and biomass) of 237.3 t C ha−1 is close to values reported in the literature of 272.08 t C ha−1 (Cheng et al., 2007), and the annual carbon capture rates are within the range of 1.2–5.45 t C ha−1 y−1, as reported in (Maggiotto et al., 2014). Overall the model represented the development stages of trees as well as other trends expected in a typical plantation. The average annual rubber yield of 1053 kg ha−1 is rather low as yield potentials are of between 644 and 2187 kg ha−1 in suboptimal environments (Priyadarshan et al., 2005) and between 1394 and 2760 kg ha−1 for trees grown in their areas of origin (Priyadarshan, 2001). Thus, the productivity needs to be improved by timely management practices such as the application of irrigation and fertilization. In the conventional system, the fresh latex is collected from the plantations and stabilized using an anticoagulant so that it can be transported to latex processing facilities. The amount of coagulant to be added to latex depends on the distance from collection site to processing factory. Regarding wastewater treatment in the processing facilities, aerobic wastewater treatment system is the preferred choice in countries such as Thailand and this is mainly because ground or spring water is available at no cost; thus, there are no incentives to recover water, nutrients and biogas and treated water is discharged (Jawjit et al., 2015).
Journal of Cleaner Production xxx (2018) xxx-xxx
F
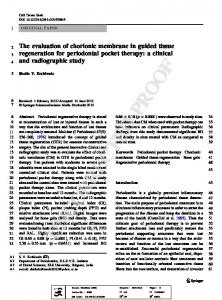
Fig. 3 shows the results for the plantation in the techno-ecological system. Fig. 3c shows that the conceptualized system can improve rubber yield and would allow tapping earlier than in the conventional plantation. This is because due to fertilization and irrigation, trees can grow faster (Fig. 3d) thus reaching adequate girth size for tapping
UN CO R
RE
CT ED
i. Results from conventional plantation showed that the establishment stage is nitrogen intensive mainly due to the rapid
OO
Our results from section 3.1 allowed getting insight as to how much and when to provide nitrogen and water inputs for keeping the ecosystem states balanced by techno-ecological system integration, aiming at enhanced productivity. The model developed for the conceptualized natural rubber techno-ecological system was then used to determine how the integration can improve the performance in respect to a conventional plantation. More than simply modeling the effects of fertilization and irrigation, our integrated modeling approach is such that it allows tracking the dynamics of relevant states and determines the timing and amounts of interacting flows that can be recycled within the ecological and technological limits of the system. The model determines the rates of nitrogen fertilization and irrigation as follows:
growth of trees. Thus, the amount of nitrogen fertilization was set at 1.5 kg N ha−1 month−1, according to the initial maximum depletion rate (see Fig. 2a). This fertilization is applied until tapping starts. ii. After tapping starts, the fertilization is set equal to the amount of nitrogen recovered from latex processing, assuming 95% recovery. iii. The water irrigation is set with the following condition: (Eq. (28)) if REW < REWc and if otherwise; this allowed tuning irrigation to the time where REW goes below the critical value REWc which indicates water stress. ft was varied between 0 and 1.
PR
3.2. Rubber techno-ecological system
9
Fig. 3. Simulation results for natural rubber techno-ecological system: a) tree girth size and soil water content; b) Carbon (C) and nitrogen (N) state in soil; c) Carbon (C) capture rate, Nitrogen (N) accumulation rate and dry rubber yield, d) girth growth rate and water level change rate.
Journal of Cleaner Production xxx (2018) xxx-xxx Table 3 Performance results of the conventional and techno-ecological system.
Annual average yield (dry rubber basis) Cumulative yield (dry rubber basis) C capture by plantation (soil + biomass) Average C capture rate Maximum C capture rate Annual fertilization by recycling (as N) Average annual water irrigation requirement Annual concentrated latex production (60% rubber content) Low quality dry rubber production Water recovered from latex processing Steam heat production from biogas Above ground biomass at end of plantation Wood production Timber Residual biomass Char production
1708
kg ha−1
28444 237
46107 274
kg ha−1 t ha−1
4.1 6.5 –
4.8 8.1 16.2
t ha−1 y−1 t ha−1 y−1 kg ha−1
–
432.7
m3 ha−1
1376
2231
kg ha−1
104 –
162 13
kg ha−1 m3 ha−1
–
0.082
394
393
MJ kg−1 conc. latex t ha−1
148 37 123 37
148 37 123 37
t ha−1 t ha−1 t ha−1 t ha−1
residual biomass (i.e. non-timber stem wood and branches) is assumed to be converted into char. Anaerobic digestion, Fig. 1 (section 2.1), would produce biogas, which is combusted in a boiler to generate steam. The steam generated (0.082 MJ kg−1 concentrated latex) covers about 35% of the heat required by the latex processing plant. Therefore, integration within the technological component is also making the process less dependent on fossil energy and avoids the respective CO2 emissions. A more detail assessment of environmental impact benefits from the techno-ecological integration is presented in the next section.
RE
UN CO R
Units
1053
OO
Description
F
Technoecological Conventional system
CT ED
earlier as shown in Fig. 3a, when comparing year 4 to year 6 in the conventional plantation. Different fractions of the total water requirement for transpiration were used until the water level was stabilized near the initial condition. It was found that providing water at 40% of transpiration rate when REW < REWc (e.g. during the water stress months) allows maintaining the water balance. Other researchers found that only 50% of transpiration water was needed to maintain crop performance in real plantations under similar conditions (Vijayakumar et al., 1998). The average annual irrigation requirement was found to be 432.7 m3 ha−1. As it can be observed in Fig. 3c, the rubber yield increases to an average of 1708 kg ha−1, from 1053 kg ha−1 in the conventional plantation (a 62% increase). Fig. 3a shows that the water fraction in soil initially increases until reaching a water balance maintained at around 0.27 (m3 m−3) while providing higher rubber yield. Fig. 3d shows that this is possible because the water level change rate remains constant after tapping starts, mainly due to the timely irrigation applied. Fig. 3c also shows how the nitrogen accumulation remains positive and increasing during the establishment stage with a sharp decrease indicating the start of tapping. This is because of the nitrogen fertilizer applied. Note that fertilizer would need to be imported to the system during establishment stage (the same as in the conventional system). Afterwards, fertilization by recycling nitrogen removed by tapping and reused from latex processing helps to keep a positive nitrogen accumulation rate. This is also reflected in the nitrogen in soil available for growth, which keeps increasing (Fig. 3b) while driving a faster tree growth. This ensures that the plantation ecosystem is self-sufficient in nitrogen, as suggested in (Sivanadyan et al., 1995). The total nitrogen requirement for the whole plantation cycle is of 539.5 kg ha−1, of which only 11.7% is from external chemical fertilizer used during establishment and 88.3% comes from nitrogen recycling. It is important to note that both timely irrigation and fertilization are essential to achieve these results due to the dynamics of the synergy. The modeling results showed that it was critical to continuously recycle the nitrogen removed and to apply irrigation during the water stress periods (mainly in the months with lower rainfall) if tapping was carried out. Storage of the digestate is possible but requires careful handling to reduce nitrogen volatilization. However, storage is avoided if the system operates continuously. Fig. 3b shows that the carbon stock (soil + biomass) at the end of the plantation life cycle (274 t ha−1) is about 16% more than that of the conventional plantation (237 t ha−1), thus the integrated techno-ecological system potentially enhances the carbon capture rate. However, it is important to note that the life cycle net gain or loss of C in ecosystems will strongly depend on the previous land use type, the original soil properties at the specific plantation conditions, which could make the carbon balances change from positive to negative (Blagodatsky et al., 2016). Also, note that climatological conditions were kept constant in the simulation, thus estimate from this work should be refined by running a simulation with forecasted climatological conditions, but this was out of the scope of this illustrative study. The performance of the integrated rubber techno-ecological system is summarized in Table 3. According to these results, only about 13 m3 ha−1 of water is recovered as treated water (assuming 85% recovery), which is just 3% of the annual irrigation requirements. Thus, water is recycled back into the latex processing to save 85% of freshwater and water discharge. In terms of the technological component, Table 3 shows the amounts of low quality rubber produced and timber recovered at the end of plantation cycle. The
PR
10
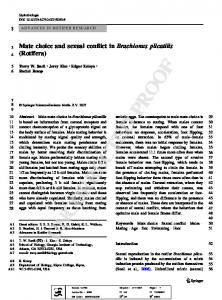
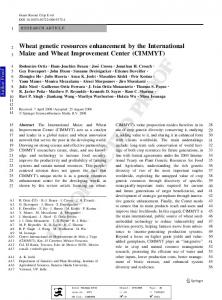
3.3. Environmental impact of rubber techno-ecological system Employing a life cycle approach, the environmental impact was estimated for the techno-ecological integration. The boundaries were from natural rubber cultivation to the latex processing facility gate. The temporality of the study is for the 30 years of plantation cycle and thus the impacts were calculated for a functional unit of amount of concentrated latex produced in 1 ha during one plantation cycle, and reported per ton of concentrated latex. Fig. 4 shows the system boundary considered for the impact assessment. The impacts assessed were global warming potential (GWP, 100-year horizon), acidification potential (AP) and eutrophication potential (EP). These impacts are considered relevant because of the greenhouse gas emissions from agriculture due to fertilization and from energy sources. At the same time, the main problem on latex processing is the treatment of an effluent containing ammonia, acids and other compounds causing acidification and eutrophication. These categories are more directly affected by the techno-ecological integration due to the nitrogen, water and energy recovery. Other impact categories of interest are the toxicity potential and photochemical oxidation as studied by Jawjit et al. (2015) for latex processing stage only, but these categories were not considered herein due to a lack of data for rubber cultivation for our study. The input inventories and their corresponding impact factors were obtained from published literature for the case of Thailand, or other sources when data was not available.
11
CT ED
PR
OO
F
Journal of Cleaner Production xxx (2018) xxx-xxx
Fig. 4. System boundary for the impact assessment of the rubber techno-ecological system for concentrated latex production. The dashed lines indicate the interconnections not present in the non-integrated system used for comparison.
the interconnections not present in the non-integrated system. The non-integrated system considers the same amount of inputs, including water irrigation, all the N input from synthetic fertilizer, and the wastewater is treated without water, biogas nor nutrient recovery. The non-integrated system gives the same concentrated latex yields and emissions from cultivation. It should be noted that the effects resulting from applying chemical fertilizer or digestate could be different (Schaubroeck et al., 2015). However, the positive, neutral or negative effects of digestate is still under debate as reviewed by (Nkoa, 2014). Given such uncertainty, and the lack of studies of digestate effects on natural rubber trees, we have assumed equal effects between chemical and organic fertilizer sources. Considering this, the detailed impacts for the non-integrated system can be calculated from Table A.6 and the differences in Fig. 5b. Therefore, the main elements of comparison were fertilizer input for establishment and productive stages, freshwater for irrigation and processing, wastewater treatment process, wastewater discharged and the heat source. Fig. 5b shows the comparisons of the environmental impacts from the sources relevant for comparison. It can be seen that the synergistically integrated system (SI) provides environmental benefits due to the recycled N and water flows and recovered energy. Considering only the impacts from the aforementioned sources, the GWP is reduced by 78%, the AP is reduced by 64% and the EP is reduced by 79% in the SI compared to the non-integrated system (NI). Note that 11.7% of the total nitrogen required throughout the plantation cycle is supplied by chemical fertilizer during establishment stage, but the impacts from this are offset by the 88.3% coming from recycling during the productive stage. Considering the 0.5 million ha of land with potential for rubber plantations in Northeast and East of Thailand (Pratummintra, 2005), the techno-ecological system integration approach presented in our work could potentially help recovering (and saving fertilizer) 8100 tonnes of nitrogen for recycling to plantations, 6.5 million m3 of water in latex and 88 million MJ of fossil-based heat for processing
UN CO R
RE
This information is presented in Table A5. For the case of GWP, the biogenic uptake and emissions are not considered as the resulting high net carbon capture (as discussed in previous section) would result in negative impact and overshadow the impacts from sources relevant to the techno-ecological integration. Impact factors for emissions from IPCC 5th Assessment Report were used, considering the corresponding value for bio-genic methane. Fig. 5a shows the environmental impact results for the integrated rubber techno-ecological system. It can be seen that the major contributors to the GWP are the cultivation processes, mainly the N volatilization as N2O, calculated from the model, with 84.5% of the total, followed by the water irrigation (7.5%) mainly due to electricity for pumping. Electricity, ammonia and chemicals used in the technological component make up the rest. Regarding AP, this is mainly contributed by the water irrigation (53.9%) for rubber plantation (due to electricity for pumping) and the electricity (33%) used in processing. These are followed by ammonia (3.9%) and DAP (3.5%) used in processing. In respect to EP, this is highly dominated by the nitrogen leaching calculated from the model (more than 99%), due to the high nitrogen accumulation in the plantation soil, as shown in the previous section. A more detailed summary of the environmental impact results is reported in Table A.6. The environmental impacts of concentrated latex are GWP: 1.83 kg CO2-eq kg−1, AP: 2.93 g SO2-eq kg−1 and EP: 34.25 g PO43- kg−1, without considering credits for wood and char and low quality rubber production. Note that the contribution from heat for processing is relatively low due to the use of the biogas as a fuel for heating, which supplies about 35% of total requirement. The impacts for such biogas come from the AD plant emissions, which has a low contribution. Due to the replacement of synthetic N fertilizer by the recycled N, the contribution from fertilizer input is also low. To further highlight the benefit of the synergistic integration, the major flows affected by the techno-ecological integration were used to compare the integrated system to a non-integrated system. In Fig. 4, the dashed lines indicate
Journal of Cleaner Production xxx (2018) xxx-xxx
UN CO R
RE
CT ED
PR
OO
F
12
Fig. 5. a) Environmental impact assessment of the integrated rubber techno-ecological system (SI) per kg of concentrated latex, and b) comparison between integrated (SI) and a non-integrated system (NI) producing the same functional unit and using the same amount of N fertilizer, freshwater and heat. Units: GWP in kg CO2-eq kg−1, AP in g SO2-eq kg−1, EP in g PO43- kg−1.
per year, while producing 1.1 million tonnes of concentrated latex. Furthermore, 18.5 million tonnes of timber and 18.4 million tonnes of char can be produced at end of plantation life cycle. If marginal land is used rather than forest, emissions from land use change are likely to be neglected. Therefore, the potential carbon capture would be 137 million tonnes over the 30 years of plantation life cycle, plus the carbon emissions avoided by substituting synthetic fertilizer and fossil fuels. Furthermore, if char is used as fuel replacing natural gas, another 736 GJ ha−1 of energy can be produced (assuming a heating value of 25 MJ kg−1 and 80% efficiency), avoiding 41.2 kg CO2-eq ha−1 at the end of the plantation cycle. It is worth nothing that adoption of irrigation needs to consider current water extraction limits from local aquifers or from other regions, which may impact water
availability for other purposes. This would involve considering other ecological components in the techno-ecological system and in the modeling, but was out of the scope of this work. A full environmental impact assessment of integrated human/industrial-natural system considering other details of background and auxiliary and storage inventories as well as a more complete set of impact categories can be performed using the comprehensive framework in (Schaubroeck et al., 2013). 4. Conclusions We conceptualized a techno-ecological system by synergistically integrating plantation and latex processing, i.e. ecological and tech
Journal of Cleaner Production xxx (2018) xxx-xxx
Acknowledgements
UN CO R
Appendix A.
Table A.1 Model parameters for the natural rubber techno-ecological system Value 0.0082
β1
2.5623
kg
0.09
Gm
84.37
α2
0.58162186
β2
2.7510602
Eq. 4
This work
δ2
137.41495
Eq. 4
This work
z fws
0.65 1 0.65
m
Eq. 5 Eq. 5 Eq. 5
kNvol
0.018
y−1
Eq. 7
OO
Eq. 8
Units
Equation Eq. 2 Eq. 2
y−1
Eq. 3 Eq. 3 Eq. 4
Eq. 4
Reference (Boithias et al., 2012) (Boithias et al., 2012) (Chandrasekhar, 2012) (Chandrasekhar, 2012) This work
This work
Notes
Average
Derived from data in (Salisu et al., 2013) Derived from data in (Salisu et al., 2013)
Average Assumed After (Jiang and Wang, 2003) After (Zhou et al., 2016) After (Samarappuli, 1996) Assumed Assumed (Sopharat et al., 2014) (Sopharat et al., 2014) (Sopharat et al., 2014) (Sopharat et al., 2014) (Sopharat et al., 2014) (Sopharat et al., 2014) within the range in Latex (Priyadarshan et al., yield in2005) cluding water (Kunioka et al., 2014) Average from (Saengruksawong et al., 2012) Average from (Saengruksawong et al., 2012) Assumed average Average from (Saengruksawong et al., 2012) Assumed Assumed (Jariyaboon et al., 2015) Assumed Assumed After (Online et al., 2013)
kNleach yC wf
0.1 0.45 0.21
wmin
0.07
LAImax
3.9
PR
0.0035
REWc
0.4
Eq. 14
α3
−0.585
Eq. 15
β3
1.2492
y−1
Eq. 9 Eq. 10 Eq. 11 Eq. 13 Eq. 14
l0
20
−1
g tree tapping−1
Eq. 15 Eq. 21
Derived from data in (Salisu et al., 2013) Derived from data in (Salisu et al., 2013)
F
266.96502
0.381
Eq. 23
fAG
0.7424
Eq. 23
ystem
0.279
Eq. 24
Ytimq yleaf
0.25 0.195
Eq. 24 Eq. 25
Ychar ηc fwe
0.3 0.95 5.9
Eq. 25 Eq. 26 Eq. 27
fcw fNrec Mortality or litter production constant Soil carbon loss constant Litter mineralization constant
0.85 0.95 0.057
y−1
Eq. 29 Eq. 30 See (MartinezHernandez et al., 2015)
0.075
y−1
See (MartinezHernandez et al., 2015)
(MartinezHernandez et al., 2015)
0.1
y−1
See (MartinezHernandez et al., 2015)
(Online et al., 2013)
RE
EMH is grateful to the Interdisciplinary Centre for Tropical Environmental Studies (MINDSET) of the University of Nebraska Medical Center for the funding provided through the Mindset Visiting Scholar scheme under the supervision of Assoc. Prof. Ernesto Hernandez at BIERG.
Parameter α1
γ2
CT ED
nological components, respectively. It was synthesized and analyzed by applying characterization and modeling, to track ecosystem dynamics and services and the effects of techno-ecological interactions. Modeling considered water, nitrogen and carbon balances and their effects on ecosystem services such as latex yield and carbon capture. The model represented the plantation-cycle stages and the effects of fertilization and irrigation, and allowed to assess the benefit of designing a techno-ecological system. It showed enhanced performance with respect to a conventional plantation used as a benchmark. This was achieved through irrigation and the exchange of nitrogen recovered from latex processing to the plantation, thus establishing a synergistic techno-ecological interaction. The environmental benefits of the integration were also demonstrated following a life cycle approach. The framework applied demonstrated how systematic modeling supports the conceptualization of integrated techno-ecological designs, reconnecting resource cycles in a more informed manner by analyzing dynamic effects and impacts on ecosystem states and services. Ecosystems dynamics for the crop-based industries has been largely ignored leading to economic failure of plantations and environmental problems such as deforestation, water stress, and air and water pollution. Our techno-ecological system integration appreciates ecological processes and constraints during the conceptualization and design of a crop-based production system; at the same time, it highlights the importance of an engineering design approach for preservation of ecosystem services and states. Therefore, our study encourages a wider perspective considering the potential benefits of two-way interactions during rubber upstream activities, especially to improve its viability in stablished and foreseen ventures in sub-optimal conditions. Our techno-ecological integration approach could be applied to conceptualize others crop-based production systems safeguarding their supplying ecosystems.
13
Journal of Cleaner Production xxx (2018) xxx-xxx Urea fertilizer (for establishment) Water for irrigation Pesticide (paraquat) Diesel for tillage Diesel for 60 km transportation
(Shorrocks, 1939)
Table A.2 Other parameters used in the models Parameter Methane yield
Value 29
Units mL kg−1 VS L L−1
Methane content in biogas
0.55
Nitrogen recovery
0.95
Heating value of methane Biogas boiler efficiency Electricity for groundwater pumping Methane leakage
50 0.85 0.905
MJ kg−1 MJ MJ−1 kWh m−3
Reference (Jariyaboon et al., 2015) (Jariyaboon et al., 2015) (Jariyaboon et al., 2015) Assumed average Assumed average (Wakeel et al., 2016)
0.02
kg kg−1
(Liebetrau et al., 2017)
Tree biomass allocation Stem Branch Leaf Roots Stem + branches Above ground Below ground
% 27.91% 26.81% 19.52% 25.76% 40.62% 74.24% 25.76%
187.7, from model 0.4 (Seng et al., 2010) 0.78 (Jawjit et al., 2010) 2.5 (Jawjit et al., 2010)
m3
Calculated from electricity for water pumping (see Table A.2) 19.2 119.95 1.1888
Cumulative for one cycle Inventory (30 y) Synthetic N fertil- 63.21 izer Recycled N 476.24
kg L ha−1 y−1 L ton−1
2.071
0.0239
See factors for “Diesel for heat in processing”
GWP kg CO2-eq ton−1 2.7
Units kg N ha−1 kg N 0.012448 ha−1 m3 ha−1 137.5 L ha−1 3.7
Water irrigation Diesel (tillage + transport) N volatilization
12981 353
N leaching
5603
Pesticides Ammonia Diesel for heat Electricity
27 1176 450 7262
DAP Other chemicals
159 ZnO, lauric and sulfuric acids 35 m3 ha−1 35 m3 ha−1 2.66 kg ha−1
RE kg kg kg kg kg
UN CO R
1.33 4.55 1.27 0.063 5.9
2.938
Table A.6 Environmental impact summary of the natural rubber techno-ecological system for concentrated latex production
Table A.4 Water input, effluent and other flows from latex processing (per kg of concentrated latex at 60% rubber content) Serum Water for processing Water in serum Recovered low grade rubber Effluent
kg N
CT ED
Table A.3 Biomass allocation (Saengruksawong et al., 2012)
0.91, from model
F
See (MartinezHernandez et al., 2015)
OO
Nitrogen 0.0279 content in litter biomass
PR
14
358
kg N2O ha−1 kg NO3− ha−1 kg ha−1 kg ha−1 L ha−1 kWh ha−1 kg ha−1
Freshwater Wastewater Emissions from AD plant Totals (per ton of concentrated latex) Totals (per kg of concentrated latex) Total concentrated latex produced in one cycle
AP g SO2- EP g PO43-eq ton−1 eq ton−1 1.9 0.0 0.158907
0.034429784
1580.5 47.1
40.4 10.2
1542.4
0.0
0.0
0.0
0.0
34027.3
7.6 36.0 3.1 85.0
47.6 113.0 39.1 977.0
0.5 9.0 8.5 25.0
3.7 2.2
103.0 15.5
123.0 4.3
0.4 0.2 1.0
4.2 0.7 0.8
0.1 4.3 0.1
1825 2930 1.83 2.93 −1 69161 kg ha
34253 34.25
Table A5 Inventories per 1 ton of concentrated latex and their embodied impact factors per unit
Input Total water for processing Electricity for processing Ammonia ZnO DAP Lauric acid Sulfuric acid Diesel for heat in processing
Amount input and reference 5.6, from model 105 (Jawjit et al., 2015) 17 (Jawjit et al., 2015) 0.6 (Jawjit et al., 2015) 2.3 (Jawjit et al., 2015) 0.5 (Jawjit et al., 2015) 13.4 (Jawjit et al., 2015) 6.5 (Jawjit et al., 2015)
Uncited reference
Unit m3
GWP kg CO2-eq 0.371
AP g SO2-eq 1.429
EP g PO43--eq 8.571
kWh
0.810
9.305
0.238
References
kg
2.118
6.647
0.529
kg
3.167
4.000
0.333
kg
1.609
44.783
53.478
kg
0.4
10.2
8
kg
0.134
15.970
0.149
litre
0.723
9.231
2.000
Ahrends, A., Hollingsworth, P.M., Ziegler, A.D., Fox, J.M., Chen, H., Su, Y., Xu, J., 2015. Current trends of rubber plantation expansion may threaten biodiversity and livelihoods. Global Environ. Change 34, 48–58 http://doi.org/10.1016/j.gloenvcha. 2015.06.002. Alam, B., Das, G., Raj, S., Roy, S., Pal, T.K., Dey, S.K., 2003. Studies on yield and biochemical sub-components of latex of rubber trees (Hevea brasiliensis) with a special reference to the impact of low temperature in a non-optimal environment. J. Rubber Res. 6 (4), 241. Allen, R.G., Pereira, L.S., Raes, D., Smith, M., 1998. Crop evapotranspiration guidelines for computing crop water requirements. In: FAO Irrigation and Drainage Paper 56. FAO, Rome.
Chantuma et al., 2004; Corpuz et al., 2014; Parton, 1996.
Journal of Cleaner Production xxx (2018) xxx-xxx
PR
OO
F
Martinez-Hernandez, E., Leung Pah Hang, M.Y., Leach, M., Yang, A., 2016. A framework for modeling local production systems with techno-ecological interactions. J. Ind. Ecol. https://doi.org/10.1111/jiec.12481. Matson, P. a., Parton, W.J., Power, A.G., Swift, M.J., 1997. Agricultural intensification and ecosystem properties. Science 277 (5325), 504–509 http://doi.org/10.1126/ science.277.5325.504. MEA Millennium Ecosystem Assessment, 2005. Ecosystems and Human Wellbeing: Synthesis. Island Press, Washington DC. Mintz, Y., Walker, G.K., 1993. Global fields of soil moisture and land surface evapotranspiration derived from observed precipitation and surface air temperature. J. Appl. Meteorol. 32, 1305–1334. Mohammadi, M., Man, H.C., Hassan, M.A., Yee, P.L., 2013. Treatment of wastewater from rubber industry in Malaysia. Afr. J. Biotechnol. 9 (38), 6233–6243. Murbach, M.R., Boaretto, A.E., Muraoka, T., Caxambu, E., De Souza, A., 2003. Nutrient cycling in a rrim 600 clone rubber plantation do clone RRIM 600. Scientia 353–357. Nkoa, R., 2014. Agricultural benefits and environmental risks of soil fertilization with anaerobic digestates: a review. Agron. Sustain. Dev. 34 (2), 473–492. Online, I.P., Podong, C., Poolsiri, R., Bio, 2013. Above ground biomass and litter productivity in relation with carbon and nitrogen content in various land use small. J. Biodivers. Environ. Sci. (JBES) 3 (8), 121–132. Parton, W.J., 1996. The century model. In: Evaluation of Soil Organic Matter Models. Springer, Berlin, Heidelberg, pp. 283–291. Pratummintra, S., 2005. Rubber research for rubber small holder system: current issue in Thailand. In: A Paper Presented in “Rubber: Wood, Cropping and Research” Work Shop. May 25.-27.2005, Kasetsart University, Bangkok. p. 7. Priyadarshan, P.M., 2001. Breeding Hevea brasiliensis for environmental constraints. Adv. Agron. 79, 351–400 http://doi.org/10.1016/S0065-2113(02)79007-X. Priyadarshan, P.M., Hoa, T.T.T., Huasun, H., Street, T., Chi, H., City, M., Postal, C., 2005. Yielding potential of rubber (hevea brasiliensis) in sub-optimal environments. J. Crop Improv. 14 (1–2), 221–247 http://doi.org/10.1300/J411v14n01. Rungruang, N., Babel, S., 2008. Treatment of natural rubber processing wastewater by combination of ozonation and activated sludge process. In: International Conference on Environmental Research and Technology (ICERT 2008), Parkroyal Penang, Malaysia. pp. 259–263. Saengruksawong, C., Khmayong, S., Anongrak, N., Pinthong, J., 2012. Growths and carbon stocks in rubber plantations on chakkarat soil series, Northeastern Thailand. J. Sci. Technol. 19 (4), 271–278. Salisu, M., Daud, N., Ahmad, I., 2013. Influence of fertilizer rates and soil series on growth performance of natural rubber ( Hevea brasiliensis ) latex timber clones. Aust. J. Crop. Sci. 7 (13), 1998–2004. Samarappuli, L., 1996. The Contribution of Rubber Plantations towards a Better Environment. 45–54, Retrieved from http://dl.nsf.ac.lk/handle/1/9269. Schaubroeck, T., Alvarenga, R.A., Verheyen, K., Muys, B., Dewulf, J., 2013. Quantifying the environmental impact of an integrated human/industrial-natural system using life cycle assessment; a case study on a forest and wood processing chain. Environ. Sci. Technol. 47 (23), 13578–13586. Schaubroeck, T., De Clippeleir, H., Weissenbacher, N., Dewulf, J., Boeckx, P., Vlaeminck, S.E., Wett, B., 2015. Environmental sustainability of an energy self-sufficient sewage treatment plant: improvements through DEMON and co-digestion. Water Res. 74, 166–179. Seng, C.T., Van Lun, L., San, C.T., Sahid, I.B., 2010. Initial report of glufosinate and paraquat multiple resistance that evolved in a biotype of goosegrass (Eleusine indica) in Malaysia. Weed Biol. Manag. 10 (4), 229–233. Shorrocks, V.M., 1939. Mineral Nutrition, Growth and Nutrient Cycle of Hevea Brasiliensis I. Growth and Nutrient Content. 19. Sivanadyan, K., Ghandimathi, H., Haridas, G., 1995. Rubber, a Unique Crop: the Mature Hevea Stand as a Nutritionally Self-sustaining Ecosystem. 54, (January). Smith, K., Grylls, J., Metcalfe, P., Jeffrey, B., Sinclair, A., 2007. Nutrient Value of Digestate from Farm-based Biogas Plants in Scotland. Report for Scottish Executive Environment and Rural Affairs Department - ADA/009/06, Available at: http:// www.gov.scot/resource/doc/1057/0053041.pdf. Sopharat, J., Gay, F., Thaler, P., Sdoodee, S., Isarangkool Na Ayutthaya, S., Tanavud, C., … Do, F.C., 2014. A simple framework to analyze water constraints on seasonal transpiration in rubber tree (Hevea brasiliensis) plantations. Front. Plant Sci. 5 (753) http://doi.org/10.3389/fpls.2014.00753. Thomas, Lasminingsih, M., 1994. Respon beberapa klon karet terhadap kekeringan. Bulletin Perkaretan 12, 1–4. Urban, R.A., Bakshi, B.R., 2009. Technological-ecological networks for sustainable process design. In: 2009 IEEE International Symposium on Sustainable Systems and Technology, ISSST ’09 in Cooperation with 2009 IEEE International Symposium on Technology and Society, ISTAS. pp. 1–6 http://doi.org/10.1109/ISSST. 2009.5156735. Vijayakumar, K.R., Dey, S.K., Chandrasekhar, T.R., Devakumar, A.S., Mohankrishna, T., Rao, P.S., Sethuraj, M.R., 1998. Irrigation requirement of rubber trees (Heveabrasiliensis) in the subhumid tropics. Agric. Water Manag. 35 (3), 245–259.
UN CO R
RE
CT ED
ANRCP, 2009. Quarterly Natural Rubber Market Review. Association of Natural Rubber Producing Countries, Malaysia http://www.anrpc.org/index.aspx. APA Kobayashi, N., Kumagai, T.O., Miyazawa, Y., Matsumoto, K., Tateishi, M., Lim, T.K., … Yin, S., 2014. Transpiration characteristics of a rubber plantation in central Cambodia. Tree Physiol. 34 (3), 285–301. Bakshi, B.R., Ziv, G., Lepech, M.D., 2015. Techno-ecological synergy: a framework for sustainable engineering. Environ. Sci. Technol. 49 (3), 1752–1760 http://doi. org/10.1021/es5041442. Blagodatsky, S., Xu, J., Cadisch, G., 2016. Carbon balance of rubber (Hevea brasiliensis) plantations: a review of uncertainties at plot, landscape and production level. Agric. Ecosyst. Environ. 221, 8–19. Boithias, L., Do, F.C., Ayutthaya, S.I.N., Junjittakarn, J., Siltecho, S., Hammecker, C., 2012. Transpiration, growth and latex production of a Hevea brasiliensis stand facing drought in Northeast Thailand: the use of the WaNuLCAS model as an exploratory tool. Exp. Agric. 48 (01), 49–63. Carr, M.K.V., Review, H.B.A., 2012. The water relations of rubber ( hevea brasiliensis ): a review. Exp. Agric. 48 (2), 176–193 http://doi.org/10.1017/ S0014479711000901. Chandrasekhar, T.R., 2012. Evaluation of unconstrained and constrained mathematical functions to model girth growth of rubber trees (Hevea brasiliensis) using young age measurements. J. For. Res. 23 (3), 365–375. Chantuma, A., Chantuma, P., Rhutherman, S., Tsongpanich, P., Bunnuam, W., Kongsilp, J., Kesawapitak, P., 2004. Carbon sequestration: direct rubber biomass measurement and visual wood weight. In: IRRDBMeeting Report, Kunming, China, September 5–14. Kuala Lumpur, Malaysia. International Rubber Research and Development Board. Cheng, C.-M., Wang, R.-S., Jiang, J.-S., 2007. Variation of soil fertility and carbon sequestration by planting Hevea brasiliensis in Hainan Island, China. J. Environ. Sci. (China) 19, 348–352 http://doi.org/10.1016/S1001-0742(07)60057-6. Corpuz, O.S., Abas, E.L., Salibio, F.C., 2014. Potential carbon storage of rubber plantations. Indian J.Pharm.Biol.Res. 2 (2), 73–82, 2014. DEDE Department of Alternative Energy Development and Efficiency, 2007. Energy Efficiency Index in Rubber Industry. Ministry of Energy, Thailand http://www2. dede.go.th/kmberc/datacenter/factory/rubber/RubberEng.pdf. FAO, 2001. The rubber tree. In: Killmann, W. (Ed.), Working Paper FP/6 Non-Forest Tree Plantations, Chapter 2 Non-Forest Tree Plantations. Fox, J.M., Castella, J.C., Ziegler, A.D., Westley, S.B., 2014. Rubber Plantations Expand in Mountainous Southeast Asia: what Are the Consequences for the Environment?. Asia Pacific Issues 114 East-West Center, US. Gopalakrishnan, V., Bakshi, B.R., Ziv, G., 2016. Assessing the capacity of local ecosystems to meet industrial demand for ecosystem services. AIChE J. 62 (9), 3319–3333. Guardiola-Claramonte, M., Troch, P.A., Ziegler, A.D., Giambelluca, T.W., Durcik, M., Vogler, J.B., Nullet, M.A., 2010. Hydrologic effects of the expansion of rubber (Hevea brasiliensis) in a tropical catchment. Ecohydrology 3 (3), 306–314. Hanes, R.J., Bakshi, B.R., 2015. Sustainable process design by the process to planet framework. AIChE J. 61, 3320–3331. https://doi.org/10.1002/aic.14918. Jall, Boyie, 2009. A simulation model estimates of the intercropping advantage of an immature-rubber, banana and pineapple system. Am. J. Agric. Biol. Sci. 4 (3), 249–254 http://doi.org/10.3844/ajabssp.2009.249.254. Jariyaboon, R., Sompong, O., Kongjan, P., 2015. Bio-hydrogen and bio-methane potentials of skim latex serum in batch thermophilic two-stage anaerobic digestion. Bioresour. Technol. 198, 198–206. Jawjit, W., Kroeze, C., Rattanapan, S., 2010. Greenhouse gas emissions from rubber industry in Thailand. J. Clean. Prod. 18 (5), 403–411. Jawjit, W., Pavasant, P., Kroeze, C., 2015. Evaluating environmental performance of concentrated latex production in Thailand. J. Clean. Prod. 98, 84–91. Jiang, J.-S.J.S., Wang, R.-S.R.S., 2003. Hydrological eco-service of rubber plantations in Hainan Island and its effect on local economic development. J. Environ. Sci.Retrieved from http://eutils.ncbi.nlm.nih.gov/entrez/eutils/elink. fcgi?dbfrom=pubmed&id=14562935&retmode=ref&cmd=prlinks\npapers3:// publication/uuid/E1998642-A935-495D-BEA7-E1AF9280CBA8. Kunioka, M., Taguchi, K., Ninomiya, F., Nakajima, M., Saito, A., Araki, S., 2014. Biobased contents of natural rubber model compound and its separated constituents. Polymers 6 (1), 423–442 http://doi.org/10.3390/polym6020423. Liebetrau, J., Reinelt, T., Agostini, A., Linke, B., 2017. Methane Emissions from Biogas Plants. IEA Bioenergy Task 37, Paris. Maggiotto, S.R., de Oliveira, D., Jamil Marur, C., Soares Stivari, S.M., Leclerc, M., Wagner-Riddle, C., 2014. Potencial de sequestro de carbono em seringais no noroeste do Paran??. Brasil. Acta Sci. Agron. 36 (2), 239–245 http://doi.org/10. 4025/actasciagron.v36i2.17404. Mak, S., Chinsathit, S., Pookpakdi, A., Kasemsap, P., 2008. The effect of fertilizer and irrigation on yield and quality of rubber (Hevea brasiliensis) grown in Chanthaburi Province of Thailand. Kasetsart,. J. Nat. Sci. 42, 226–237. Martinez-Hernandez, E., Leach, M., Yang, A., 2015. Impact of bioenergy production on ecosystem dynamics and services-a case study on U.K. heathlands. Environ. Sci. Technol. 49 (9), 5805–5812 http://doi.org/10.1021/es505702j.
15
Journal of Cleaner Production xxx (2018) xxx-xxx
Nomenclature
: nitrogen removed by latex tapping (kg ha−1 y−1) : nitrogen mineralization rate of the litter (kg ha−1 y−1) : nitrogen uptake rate by trees (kg ha−1 y−1) : nitrogen volatilisation rate (kg ha−1 y−1) : soil evapotranspiration over time step τ (e.g. mm month−1, −1 my ) : tree transpiration over time step τ (e.g. mm month−1, m y−1) : irrigation applied over time step τ (e.g. mm month−1, m y−1) : rainfall over time step τ (e.g. mm month−1, m y−1) Fcl : concentrated latex produced kg ha−1 y−1
F
Wakeel, M., Chen, B., Hayat, T., Alsaedi, A., Ahmad, B., 2016. Energy consumption for water use cycles in different countries: a review. Appl. Energy 178, 868–885. Warren-Thomas, E., Dolman, P.M., Edwards, D.P., 2015. Increasing demand for natural rubber necessitates a robust sustainability initiative to mitigate impacts on tropical biodiversity. Conservat. Lett. 8 (4), 230–241. Williams, J.R., Jones, C.A., Kiniry, J.R., Spanel, D.A., 1989. The EPIC crop growth model. Trans. ASAE 32 (2), 497–0511. Xu, C., Singh, V.P., 1998. A review on monthly water balance models for water resources investigations. Water Resour. Manag. 12, 20. https://doi.org/10.1023/A: 1007916816469. Zhou, W.-J., Ji, H., Zhu, J., Zhang, Y.-P., Sha, L.-Q., Liu, Y.-T., … Zheng, X.-H., 2016. The effects of nitrogen fertilization on N2O emissions from a rubber plantation. Sci. Rep. 6, 28230 http://doi.org/10.1038/srep28230.
OO
16
Fcw : water recovered (kg ha−1 y−1)
BAG : tree above-ground biomass (kg ha−1)
: net growth rate of the trees (kg ha−1 y−1) Flat : tapped latex over time step τ (kg ha−1 month−1)
B : total biomass above plus below ground (kg ha−1)
Fww : wastewater produced from latex processing (kg ha−1 y−1),
csoil : carbon content in soil (kg ha−1) dp : plantation density (trees ha−1)
G0 : initial girth size (cm).
ET0 : reference evapotranspiration (mm)
G : tree girth size (cm) kNvol : nitrogen volatilization rate constant (y−1)
PR
Ap : plantation area (ha)
Gm : maximum tree girth size (cm)
fET0 : reduction factor for evapotranspiration (dimensionless) fREW : reduction factor for relative extractable water in soil (dimensionless) fAG : fraction of above-ground biomass to total biomass (dimensionless) fN : nitrogen influence factor (dimensionless) fw : water influence factor on growth (dimensionless)
LAI : leaf area index (dimensionless) LAImax : maximum value when canopy is full Mchar : charcoal production from residual biomass (kg ha−1) REW : relative extractable water (dimensionless) REWc : REW critical value for trees to be under water stress (dimensionless) tf : tapping frequency in days (e.g. for tapping every other day, tf = 2 days) wmin : minimum water fraction in soil (a.k.a. wilting point,
RE
fcw : water fraction recovery by the treatment process
(dimensionless) fwe : wastewater or effluent produced per amount of latex (dimensionless) fws : fraction of water that enters the soil (dimensionless)
UN CO R
fws : water stress influence factor on latex productivity
l0 : reference latex yield (kg tree−1 tapping−1)
Mtimber : timber wood at end of plantation cycle (kg ha−1)
fNrec : recovery fraction of initial nitrogen in latex (dimensionless)
(dimensionless) ft : fraction of transpiration water requirement by trees
kg : growth constant (y−1)
CT ED
ET0c : critical value for reference evapotranspiration (mm)
(dimensionless) : flow of fresh latex going to processing facility (kg ha−1 y−1) : nitrogen recycled entering the plantation (kg ha−1 y−1)
: inlet water flow to the plantation (kg ha−1 y−1) : nitrogen flow going out of the latex processing facility (kg ha−1 y−1) : outlet from the latex processing facility (kg ha−1 y−1) : flow of fresh latex going out from the plantation (kg ha−1 −1 y ) Fharv : harvesting rate (kg ha−1 y−1)
: biomass mortality rate or litter production rate (kg ha−1 y−1) : carbon loss to the air (kg ha−1 y−1) : carbon capture in soil and standing biomass (kg ha−1 y−1) : nitrogen fertilization rate (kg ha−1 y−1)
dimensionless) wf : water fraction in soil at field capacity (dimensionless) W : water fraction in soil (dimensionless) : carbon mass fraction in latex (dimensionless) : nitrogen mass fraction in latex (dimensionless) : the water content in latex (dimensionless) yC : carbon mass fraction (dimensionless) yleaf : leaves fraction in total biomass (dimensionless) ystem : fraction of the stem in the above ground biomass (dimensionless) Ychar : yield of char per residual wood (dimensionless) Ytimq : is the yield of timber of required standard quality (dimensionless) z : soil depth (m) θ : number of days in the time step τ (e.g. 30 days in a month) ηc : latex concentration efficiency (dimensionless) τ : time step (e.g. month, y)