Understanding the learned behavior of customized convolutional neural networks toward malaria parasite detection in thin blood smear images Sivaramakrishnan Rajaraman Kamolrat Silamut Md. A. Hossain I. Ersoy Richard J. Maude Stefan Jaeger George R. Thoma Sameer K. Antani
Sivaramakrishnan Rajaraman, Kamolrat Silamut, Md. A. Hossain, I. Ersoy, Richard J. Maude, Stefan Jaeger, George R. Thoma, Sameer K. Antani, “Understanding the learned behavior of customized convolutional neural networks toward malaria parasite detection in thin blood smear images,” J. Med. Imag. 5(3), 034501 (2018), doi: 10.1117/1.JMI.5.3.034501.
Journal of Medical Imaging 5(3), 034501 (Jul–Sep 2018)
Understanding the learned behavior of customized convolutional neural networks toward malaria parasite detection in thin blood smear images Sivaramakrishnan Rajaraman,a,* Kamolrat Silamut,b Md. A. Hossain,c I. Ersoy,d Richard J. Maude,b,e Stefan Jaeger,a George R. Thoma,a and Sameer K. Antania a
Lister Hill National Center for Biomedical Communications, National Library of Medicine, Bethesda, Maryland, United States Mahidol University, Mahidol Oxford Tropical Medicine Research Unit, Bangkok, Thailand c Chittagong Medical Hospital, Department of Medicine, Chittagong, Bangladesh d University of Missouri, MU Informatics Institute, Department of Pathology and Anatomical Science, Columbia, Missouri, United States e University of Oxford, Centre for Tropical Medicine and Global Health, Nuffield Department of Medicine, Oxford, United Kingdom b
Abstract. Convolutional neural networks (CNNs) have become the architecture of choice for visual recognition tasks. However, these models are perceived as black boxes since there is a lack of understanding of the learned behavior from the underlying task of interest. This lack of transparency is a serious drawback, particularly in applications involving medical screening and diagnosis since poorly understood model behavior could adversely impact subsequent clinical decision-making. Recently, researchers have begun working on this issue and several methods have been proposed to visualize and understand the behavior of these models. We highlight the advantages offered through visualizing and understanding the weights, saliencies, class activation maps, and region of interest localizations in customized CNNs applied to the challenge of classifying parasitized and uninfected cells to aid in malaria screening. We provide an explanation for the models’ classification decisions. We characterize, evaluate, and statistically validate the performance of different customized CNNs keeping every training subject’s data separate from the validation set. © 2018 Society of Photo-Optical Instrumentation Engineers (SPIE) [DOI: 10 .1117/1.JMI.5.3.034501]
Keywords: convolutional neural networks; visualization; deep learning; blood smears; classification; computer-aided diagnosis. Paper 18042R received Mar. 7, 2018; accepted for publication Jun. 25, 2018; published online Jul. 18, 2018.
1
Introduction
Computer-aided diagnosis tools offer the ability to reduce human burden in population screening and diagnosis, particularly in resource-constrained settings.1 A majority of these tools are based on machine learning (ML) techniques applied to relevant images and often employ handcrafted features for decision-making.2,3 However, the process demands expertise in analyzing variability in size, background, angle, and position of the region of interest (ROI) on the images and can be adversely impacted by the inter- and intraobserver variability and limited visibility to the variability in datasets acquired in large-scale, disease-endemic regions.4 To overcome these challenges, data-driven techniques, such as deep learning (DL) also known as deep hierarchical learning, have gained prominence.5 DL models self-discover hierarchical feature representations from the underlying data. Higher-level features are abstracted from lower-level features to learn complex, nonlinear decision-making functions, resulting in end-to-end feature extraction and classification.6 Unlike kernel-based algorithms, such as support vector machines (SVMs), the performance of DL models has been shown to scale with data and computational resources.7 For visual recognition, an important source of information lies in the spatial local correlation among the neighboring
*Address all correspondence to: Sivaramakrishnan Rajaraman, E-mail:
[email protected]
Journal of Medical Imaging
pixels/voxels. Convolutional neural networks (CNNs) are designed to exploit this spatial information through the mechanisms of local receptive fields, shared weights, and pooling.8 CNNs are delivering promising results in complex recognition tasks, including speech, text, handwriting, and natural images.9–14 State-of-the-art studies reveal that in addition to delivering promising results on image recognition tasks, CNNs are remarkable in localizing objects to enumerate the significance of individual pixels with respect to the decision-making process and allow visualization in terms of heat maps in the pixel space.15 Despite the encouraging results, there is still a lack of transparency on the behavior and internal operation of these models.16 There is no qualitative understanding of their performance or how they might be improved. This may not be acceptable in applications involving medical screening/diagnosis since a poorly understood model behavior could adversely impact the process of decision-making.17 An insight into the functioning of the model layers and the operation of the classifier would lead to an effective interpretation of network predictions and visualization of image areas that stand indicative of the disease/abnormality. Of late, this topic is receiving attention from the researchers, and several methods have been developed to visualize, understand, and interpret the reasoning embodied in these predictive models.18 2329-4302/2018/$25.00 © 2018 SPIE
034501-1
Jul–Sep 2018
•
Vol. 5(3)
Rajaraman et al.: Understanding the learned behavior of customized convolutional neural networks toward malaria parasite detection. . .
Recently, researchers across the world have begun to apply DL tools and obtain promising results in a wide variety of medical image analyses/understanding tasks.19–21 Several studies were performed in applying DL methods to the task of malaria parasite detection in thin blood smear images. Liang et al.22 proposed a custom 16-layer CNN toward classifying the uninfected and parasitized cells. Features were extracted using a pretrained AlexNet8 and an SVM classifier was trained on the extracted features. The performance of Liang et al.’s model was compared to that of the pretrained CNN, and they found that the custom model was more accurate, sensitive, and specific than the pretrained model. In another study, Dong et al.23 compared the performance of SVM and pretrained DL models, including LeNet,24 AlexNet, and GoogLeNet,10 in classifying parasitized and uninfected cells. In this study, red blood cells (RBCs) were segmented from thin blood smear images and randomly split into train/test sets. Twenty-five percent of the training images were randomly selected to validate the models. The authors found that deep CNNs achieved 95% classification accuracy as compared to 92% with an SVM classifier. Gopakumar et al.25 employed a customized CNN model for analyzing videos containing a focus stack of the field of views of Leishmanstained slide images toward the process of automated parasite detection. The authors used a customized portable slide scanner and off-the-shelf components for data acquisition and demonstrated sensitivity and specificity of 97.06% and 98.50%, respectively. Bibin et al.26 proposed a six-layer deep belief network toward malaria parasite detection in peripheral blood smear images. The authors reported 96.4% accuracy in the classification task with randomized train/test splits. While each study elucidates specific methods of detection, none of them provided an insight into the behavior and operation of the trained models or justify how the performance metrics were achieved. Also, these studies were not evaluated on a largescale clinical dataset. Although the reported outcomes are promising, existing approaches need to substantiate their robustness on a larger set of images with cross-validation studies (at the patient level) where no RBCs from patients in the training set are reused in the validation/test set to support optimal model selection and reduce generalization errors. Evaluation on the patient level provides a more realistic performance evaluation of the predictive models as the images in the validation/test set represent truly unseen images for the training process, with no information about staining variations or other artifacts leaking into the training data. Tests for statistically significant differences in performance would further assist in the process of optimal model selection prior to deployment. It is reasonable to mention that the state-of-the art still leaves much room for progress in this regard. In summary, the unresolved issue of understanding the learned behavior of CNNs toward malaria parasite detection in thin blood smear images has become principally relevant and is the subject of this paper. In this work, we visualized the weights, saliencies, class activation maps, and ROI localization in the customized CNNs applied to the challenge of classifying parasitized and uninfected cells to aid in malaria screening and provided an explanation on what made these models arrive at the classification decision. We demonstrated that in the process of using the optimal architecture for the underlying task, we identified exactly which regions of an image were used for class discrimination. We evaluated the performance of six customized DL models, including a simple, sequential CNN, and untrained Journal of Medical Imaging
architectural frameworks of the state-of-the-art CNNs, including VGG-16,9 ResNet-50,11 Xception,13 Inception-V3,12 and DenseNet-121,14 customized for the underlying task. We cross-validated the performance of the predictive models at the patient level to reduce bias and generalization errors and tested for the presence/absence of a statistically significant difference in the performance of the models under study. This paper is organized as follows: Sec. 2 elaborates on the materials and methods, Sec. 3 discusses the results, and Sec. 4 concludes the paper.
2
Materials and Methods
2.1
Preprocessing
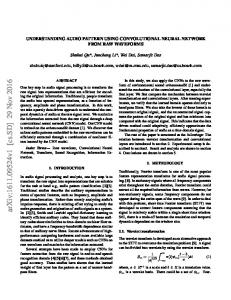
To reduce the burden for microscopists in resource-constrained regions and improve diagnostic accuracy, researchers at the Lister Hill National Center for Biomedical Communications (LHNCBC), part of National Library of Medicine (NLM), developed a mobile application that runs on a standard Android® smartphone attached to a conventional light microscope.1 Giemsa-stained thin blood smear slides from 150 P. falciparum infected and 50 healthy patients were collected and photographed at Chittagong Medical College Hospital, Bangladesh. The smartphone’s built-in camera acquired images of slides for the different microscopic field of views. The images were manually annotated by an expert slide reader at the Mahidol Oxford Tropical Medicine Research Unit (MORU), Bangkok, Thailand. The deidentified images and annotations were archived at NLM (IRB#12972). An algorithm based on iterative voting and level sets was applied to thin blood smear images to detect and segment individual cells.1 The dataset consisted of 27,558 cell images with equal instances of parasitized and uninfected cells. Positive samples contained the Plasmodium and negative samples contained no Plasmodium but other types of objects, including staining artifacts/impurities. We evaluated the predictive models through fivefold cross-validation at the patient level to avoid biasing and generalization errors. Table 1 shows the distribution of cells across the different folds. The images were resampled to 100 × 100 and 224 × 224 pixel resolutions to suit the input requirements of the customized CNNs and normalized to assist in faster convergence. Figure 1 shows instances of a microscopic field of view, parasitized, and uninfected cell images. The models were trained and tested on a Windows® system with Intel® Xeon® CPU E5-2640v3 2.60-GHz processor, 16-GB
Table 1 Distribution of cells at the patient level across different folds.
Folds
Parasitized
Uninfected
1
2756
2757
2
2758
2758
3
2776
2762
4
2832
2760
5
2657
2742
13,779
13,779
Total
034501-2
Jul–Sep 2018
•
Vol. 5(3)
Rajaraman et al.: Understanding the learned behavior of customized convolutional neural networks toward malaria parasite detection. . .
Fig. 1 Visualizing cell images: (a) field of view image, (b) parasitized cells, and (c) uninfected cells.
RAM, a CUDA-enabled Nvidia® GTX 1080 Ti 11GB graphical processing unit (GPU), MATLAB® R2017b, Python® 3.6.3, Keras® 2.1.1 with Tensorflow® 1.4.0 backend, and CUDA 8.0/cuDNN 5.1 dependencies for GPU acceleration.
2.2
Model Configurations
We evaluated the performance of six customized CNNs in the task of classifying parasitized and uninfected cells to aid in disease screening. In the process, we proposed a simple, sequential CNN (Fig. 2), similar to the architecture that LeCun and Bengio27 used for image classification. The proposed CNN had three convolutional layers and two fully connected layers. The input to the model constituted segmented RBCs of 100 × 100 × 3 pixel resolution. The convolutional layers used 3 × 3 filters with 2 pixel strides. The first and second convolutional layers had 32 filters and the third convolutional layer had 64 filters. The sandwich design of convolutional/rectified linear units (ReLU) and proper weight initializations enhanced the learning process.11,28 Max-pooling layers with a pooling window of 2 × 2 and 2 pixel strides followed the convolutional layers. The pooled output of the third convolutional layer was fed to the first fully connected layer that had 64 neurons, and the second fully connected layer fed into the Softmax classifier.8 Dropout regularization7 with a dropout ratio of 0.5 was applied to outputs of the first fully connected layer. The model was trained by optimizing the multinomial logistic regression objective using stochastic gradient descent (SGD)5 and Nesterov’s momentum.29 The models were optimized for hyperparameters by a randomized grid search method.30 The variables to be optimized were chosen and search ranges were specified. These ranges included [1 × 10⁻⁷ 5 × 10⁻² ], [0.8 0.99], and [1 × 10⁻¹⁰ 1 × 10⁻² ] for the learning Journal of Medical Imaging
rate, SGD momentum, and L2-regularization parameters, respectively. We also evaluated the performance of untrained architectural frameworks of state-of-the-art DL models, including VGG-16, ResNet-50, Xception, Inception-V3, and DenseNet-121, customized for the underlying task. The model architecture for these CNNs was downloaded from the GitHub repository.31,32 We used the trainable and nontrainable layers of these models, everything up to the fully connected layers. We added a global average pooling (GAP) layer, followed by a dense fully connected, dropout, and logistic layer. The untrained models were in the process, customized for the classification task of our interest. The models were optimized for hyperparameters by the randomized grid search method. We initialized search ranges to be [1 × 10⁻³ 5 × 10⁻² ], [0.8 0.99], and [1 × 10⁻¹⁰ 1 × 10⁻² ] for the learning rate, Nesterov’s momentum, and L2-regularization parameters, respectively. The performance of the customized CNNs was evaluated in terms of accuracy, the area under receiver operating characteristic curve (AUC), sensitivity, specificity, F1-score,33 and Matthews correlation coefficient (MCC).34
2.3
Visualizing the Weights and Activations
Visualizing the weights in a trained model is a common strategy to understand its behavior and gain a comprehensive understanding of the input patterns that activate the filters.15 These weights are usually highly interpretable on the earlier layers than in the deeper convolutional layers. Visualizing the weights is extremely useful because a well-trained model displays smooth, noiseless filters. Noisy filters indicate that the model has not been optimally trained or is overfitted due to lack of regularization. We visualized the weights and compared the
034501-3
Jul–Sep 2018
•
Vol. 5(3)
Rajaraman et al.: Understanding the learned behavior of customized convolutional neural networks toward malaria parasite detection. . .
positive activations were observed as white pixels and negative activations as black pixels.
2.4
Occlusion Sensitivity Measurements
Training metrics are not always reliable, and a standard visualization technique, such as partial occlusion, helps in providing a sanity check on the learning strategy.15 Partial occlusion studies help in evaluating the sensitivity of the trained model to occlusion. For a given image, different regions are masked, and for each location of the occlusion mask, the prediction score of the expected class is recorded. The process helps in identifying whether the trained model is actually classifying based on the task-specific features and not the surrounding context and gaining a clear understanding of the learned behavior of the model for the underlying task. In this study, we evaluated the performance of the trained model by performing occlusion sensitivity measurements, to gain further insight into its operation.
2.5
Visual Explanation through Saliency Maps and Gradient-Based Localization
Saliency maps compute the derivative of the input image via backpropagation with respect to classification.18 A high value at a given pixel location infers that changing this pixel would dramatically affect classification. Saliency maps provide intuition of attention and help to analyze the most influential features. Class activation mapping (CAM) helps to visualize discriminative image regions used by the trained model to identify an image category.18 An image was fed into the trained model and the feature maps from the deepest convolutional layer were extracted. Let gp represent the p’th feature map and W r;p the weight in the final classification layer for the feature map p leading to a given class r. A map Mr of the most salient features used in classifying the image as belonging to the class r was obtained by taking the weighted sum of the feature maps using their associated weights given by Fig. 2 Architecture of the simple sequential CNN. EQ-TARGET;temp:intralink-;e001;326;351
network layer activations of the optimal trained model with that of the input image to discover the learned features toward classifying the parasitized and uninfected cells. Parasitized and uninfected cell images were fed to the trained model, and the activations of the filters were observed and compared with the corresponding pixel locations in the input image. Strong
Mr ¼
X
W r;p gp
(1)
p
The most significant features used by the trained model in its prediction of the class r were identified by upscaling the map Mr to the image dimensions and overlaying the image. However, for constructing CAM, a GAP layer and a linear dense layer need to necessarily follow the deepest convolutional layer. The
Table 2 Performance metrics for the customized models.
Models
Accuracy
AUC
Sensitivity
Specificity
F 1-score
MCC
VGG-16
0.951 ± 0.007
0.985 ± 0.005
0.946 ± 0.022
0.957 ± 0.027
0.952 ± 0.006
0.901 ± 0.014
ResNet-50
0.947 ± 0.008
0.982 ± 0.004
0.931 ± 0.017
0.963 ± 0.020
0.947 ± 0.008
0.893 ± 0.016
Xception
0.934 ± 0.013
0.979 ± 0.007
0.926 ± 0.022
0.942 ± 0.037
0.934 ± 0.013
0.867 ± 0.026
Inception-V3
0.946 ± 0.010
0.982 ± 0.006
0.926 ± 0.027
0.967 ± 0.015
0.946 ± 0.011
0.892 ± 0.019
DenseNet-121
0.919 ± 0.032
0.960 ± 0.028
0.868 ± 0.055
0.972 ± 0.026
0.915 ± 0.036
0.842 ± 0.062
Simple CNN
0.940 ± 0.010
0.979 ± 0.009
0.931 ± 0.026
0.951 ± 0.030
0.941 ± 0.010
0.880 ± 0.020
Note: Bold fonts refer to the highest values.
Journal of Medical Imaging
034501-4
Jul–Sep 2018
•
Vol. 5(3)
Rajaraman et al.: Understanding the learned behavior of customized convolutional neural networks toward malaria parasite detection. . .
technique cannot be used by models that violate these requirements. Gradient-weighted CAM (grad-CAM), a strict generalization of CAM, offers gradient-based, class-specific localization to be applied to all existing CNN models.35
2.6
Statistical Analyses
Table 3 Consolidated results of Kruskal–Wallis H and post-hoc tests on the performance metrics.
Metric
Shapiro– Wilk
Kruskal–Wallis summary
Accuracy
p ¼ 0.000
χ 2 ð5Þ ¼ 8.423, p ¼ 0.134
We performed statistical analyses to choose the best model for deployment. Statistical methods, such as one-way analysis of variance (ANOVA), are used to determine the presence/absence of a statistically significant difference between the means of three or more unrelated groups.36 One-way ANOVA tests the null hypothesis (H0) given by
H0∶μ1 ¼ μ2 ¼ μ3 ¼ μk
EQ-TARGET;temp:intralink-;e002;63;612
(2)
where μ is the mean of parameters for the individual groups and k is the total number of groups. If a statistically significant result is returned by the test, H0 is rejected and the alternative hypothesis (H1) is accepted to infer that a statistically significant difference exists between the means of at least two groups under study. However, it would be appropriate to use this parametric test only when the underlying data satisfy the assumptions of independence of observations, absence of significant outliers, normality of data, and homogeneity of variances.37 When any of these conditions are violated, a nonparametric alternative, such as Kruskal–Wallis H test (also called the one-way ANOVA on ranks), should be used to determine the presence/absence of a statistically significant difference between the groups.38 A post-hoc analysis is needed to identify the groups that demonstrate statistically significant differences.39 We performed Shapiro–Wilk test40 to check for data normality and Levene’s statistic test41 to study the homogeneity of variances for the performance metrics for the different models under study. Statistical analyses were performed using IBM® SPSS® statistical package.42
3 3.1
Mean ranks
AUC
Sensitivity
Specificity
p ¼ 0.000
p ¼ 0.001
p ¼ 0.009
χ 2 ð5Þ ¼ 6.061, p ¼ 0.300
2
χ ð5Þ ¼ 9.282, p ¼ 0.098
2
χ ð5Þ ¼ 4.480, p ¼ 0.483
Results and Discussions Metrics Evaluation and Statistical Analyses
We stopped training the customized models after 15 K iterations (≈24 h) when the validation accuracy ceased to improve. For the learning rate, we found the optimal value to be 1 × 10⁻⁵ for the simple, sequential model and 1 × 10⁻⁶ for the other customized CNNs under study. For the Nesterov’s momentum and L2-regularization, we found the optimal values to be 0.9 and 1 × 10⁻⁶ across the models, respectively. The customized models converged to an optimal solution due to hyperparameter optimization, implicit regularization imposed by smaller convolutional filter sizes, usage of L2-regularization, and aggressive dropouts in the fully connected layers. It was observed from the cross-validation studies that the customized VGG-16 was highly accurate, sensitive, with the most significant AUC, F1-score, and MCC values as shown in Table 2. However, the customized DenseNet-121 was highly specific. While performing statistical analyses, we found that the results of Shapiro–Wilk test were statistically significant (p < 0.05) across the performance metrics to signify that the normality of data has been violated. For this reason, we performed analyses with the nonparametric Kruskal–Wallis H test. The consolidated results of Kruskal–Wallis H and posthoc analyses are given in Table 3. We observed that, in terms Journal of Medical Imaging
VGG-16
22.70
ResNet-50
18.60
Xception
10.60
Inception-V3
17.80
DenseNet-121
9.40
Simple CNN
13.90
VGG-16
22.20
ResNet-50
15.90
Xception
13.80
Inception-V3
16.50
DenseNet-121
8.80
Simple CNN
15.80
VGG-16
22.50
ResNet-50
16.70
Xception
15.40
Inception-V3
15.20
DenseNet-121
6.00
Simple CNN
17.20
VGG-16
14.40
ResNet-50
16.00
Xception
11.00
Inception-V3
17.60
DenseNet-121 21.40
F 1-score
MCC
p ¼ 0.000
p ¼ 0.000
χ 2 ð5Þ ¼ 9.399, p ¼ 0.094
χ 2 ð5Þ ¼ 8.240, p ¼ 0.143
Simple CNN
12.60
VGG-16
23.40
ResNet-50
18.50
Xception
9.90
Inception-V3
17.50
DenseNet-121
9.40
Simple CNN
14.30
VGG-16
22.60
ResNet-50
18.40
Xception
10.60
Inception-V3
18.00
DenseNet-121
9.50
Simple CNN
13.90
Note: Bold fonts refer to the highest values.
034501-5
Jul–Sep 2018
•
Vol. 5(3)
Rajaraman et al.: Understanding the learned behavior of customized convolutional neural networks toward malaria parasite detection. . .
of accuracy, no statistically significant difference in performance existed between the different customized CNNs [χ 2 ð5Þ ¼ 8.423, p ¼ 0.134]. We observed similar results for AUC [χ2ð5Þ ¼ 6.061, p ¼ 0.300], sensitivity [χ 2 ð5Þ ¼ 9.282, p ¼ 0.098], specificity [χ 2 ð5Þ ¼ 4.480, p ¼ 0.483], F1-score [χ 2 ð5Þ ¼ 9.399, p ¼ 0.094], and MCC [χ 2 ð5Þ ¼ 8.240, p ¼ 0.143]. In terms of mean ranks, the customized VGG-16 outperformed the
other models except for specificity where the customized DenseNet-121 demonstrated a higher mean rank value. This may be acceptable considering that our study is focused on disease screening where the sensitivity metric carries high significance. If we were to select a model based on the balance between recall and precision as demonstrated by the F1-score, the customized VGG-16 outperformed the other models under study.
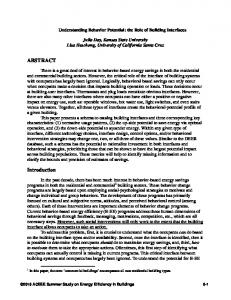
Fig. 3 Misclassified instances: (a)–(c) ground truth parasitized cells and (d) ground truth uninfected cell.
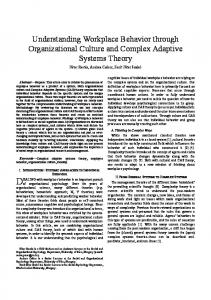
Fig. 4 Visualizing the learned filters in the custom-trained VGG-16 model: (a) block1-conv1, (b) block2conv2, (c) block3-conv3, (d) block4-conv3, (e) block5-conv3, (f) first fully connected layer, (g) second fully connected layer, and (h) third fully connected layer.
Journal of Medical Imaging
034501-6
Jul–Sep 2018
•
Vol. 5(3)
Rajaraman et al.: Understanding the learned behavior of customized convolutional neural networks toward malaria parasite detection. . .
Literature studies revealed that MCC is an informative single score to evaluate the performance of a binary classifier in a confusion matrix context.43 In this regard, the customized VGG-16 demonstrated higher mean rank value for MCC as compared to other models. The consolidated results demonstrated that the customized VGG-16 model outperformed the other models under study toward classifying the parasitized and uninfected cells to aid in disease screening. Due to segmentation issues, there were instances when the trained model failed to classify the underlying data (Fig. 3). Figures 3(a)–3(c) were parasitized cells by ground truth. Due to suboptimal segmentation, the model failed to capture the discriminative features to correctly classify them to belong to the parasitized class. Figure 3(d) shows an instance of a normal cell by ground truth. Due to improper segmentation, it extended into the neighboring parasitized cell. The model classified this cell image as a parasitized cell.
3.2
Visualizations
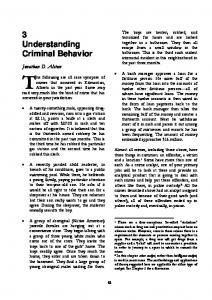
We performed visualization studies with the optimal, customtrained VGG-16 model for the task under study. We visualized a random selection of filters in the first convolutional layer of the model and observed that the filters learned features pertaining to colors indicating cell staining variations, thus serving as color detection filters (Fig. 4). The low-level features were abstracted to construct complex, high-level features in the deeper convolutional layers. We observed the learned filters in the last convolutional layer of each block of the trained VGG-16 model. We also visualized the dense, fully connected layers and observed that the learned weights loosely resembled the uninfected and parasitized classes, respectively. The trained model decomposed the visual input space as a hierarchical-modular framework of filters and learned a probabilistic mapping between the learned filters and image labels. The learned weights may not be similar to human visual perception for the reason that the human visual cortex is not merely convolutional but structured into functionally dynamic cortical columns and involves complex motor control for information processing and cognition.44 We also visualized and compared the areas of model layer activations with that of the input image in the process of discovering the learned features. A parasitemic cell image was fed to the model, and the activations of the filters in the deepest convolutional layer (block5-conv3) were observed and compared with the corresponding pixel locations in the input image (Fig. 5). Strong positive activations were observed as white pixels and negative activations as black pixels. We observed that the 69th filter showed the highest activation in the montage of activations. The highest filter activation identified by white pixels corresponded to the location of the parasites in the input image. We investigated only the positive activations by visualizing the ReLU layer that followed this convolutional layer. The activations clearly demonstrated the areas showing parasites. We observed the activations of this ReLU layer for different input images. Both parasitized and uninfected cells were fed and the activations were investigated. A pseudocolor image was generated using the “jet” colormap and a threshold was selected to match the activation range for achieving an appealing visualization effect. Activations higher than the threshold appeared bright red with distinct color transitions for varying ranges. The generated heat maps were overlaid onto the input image. We observed from these heat maps that the model precisely activated on the parasitized locations. We observed strong positive Journal of Medical Imaging
Fig. 5 Visualizing activations: (a) filter activations at block5-conv3, (b) original images, (c) highest channel activations, and (d) heat maps.
activations only on the location of the parasites but not on the uninfected cell. The trained model learned discriminative, taskspecific features that helped to distinguish between parasitized and uninfected cells. We visualized the occlusion sensitivity of the custom-trained VGG-16 model for the parasitized cell images (Fig. 6). The probability was visualized as a two-dimensional heat map. Bright parts of the image corresponded to a higher probability of being classified into the expected class. The darkest regions indicated the locations where occlusion had the biggest effect on the probability score. The parasitized regions were darker because, without them, it was hard for the trained model to understand if the image belonged to the parasitized cell class. Thus, we observed that the trained VGG-16 model precisely localized the parasites within the scene, as the probability of the parasitized cell class dropped significantly when the parasites were occluded. The grad-CAM output of the custom-trained VGG-16 model with respect to the parasitized cell class is shown in Fig. 7. The customized CNNs had a CAM-compatible structure where we switched the Softmax activation to linear for gradient computations. We performed guided backpropagation, in which the backpropagation was modified to only propagate positive
034501-7
Jul–Sep 2018
•
Vol. 5(3)
Rajaraman et al.: Understanding the learned behavior of customized convolutional neural networks toward malaria parasite detection. . .
Fig. 6 Occlusion sensitivity measurements: (a) input image and (b) occluded regions where the class probability decreased for the expected class.
gradients for positive activations.35 We observed that the trained model precisely localized the parasites in the input images, signifying that the model learned task-specific features and not the surrounding context. We also performed cross-validation studies at the cell level by mixing the RBCs across patients and compared with the state of the art (Table 4). We observed that the customized VGG-16 model outperformed the state-of-the-art in all performance metrics. The decrease in performance at the patient level may be attributed to the staining variations between patients. We observed that it was harder for the classifier to learn different stains, which indicates that we may need to acquire more images with different staining colors for training or apply color normalization techniques. However, by validating the predictive models at the patient level, which we believe simulate real-world conditions, we ensured getting rid of bias, reduced overfitting, and generalization errors toward optimal model deployment. Journal of Medical Imaging
4
Conclusion
In this study, we performed various experiments to visualize the weights, saliencies, class activation maps, and ROI localization toward understanding the learned behavior of the customized CNN applied to the challenge of classifying parasitized and uninfected cells to aid in malaria screening. We also provided an explanation on what made these models arrive at the classification decision. Finally, we validated the performance of the models at the patient and cell level with a large-scale clinical dataset and analyzed for the presence/ absence of a statistically significant difference in their performance metrics. We are currently performing pilot studies in deploying the customized model into mobile devices and analyzing its performance. Currently, ML libraries for mobile devices offer the flexibility for dynamic allocation of CPU and GPU for training the models and testing on unseen
034501-8
Jul–Sep 2018
•
Vol. 5(3)
Rajaraman et al.: Understanding the learned behavior of customized convolutional neural networks toward malaria parasite detection. . .
Fig. 7 Grad-CAM visualization: (a) input parasitized cell images, (b) guided saliency maps, and (c) gradCAM outputs. Table 4 Comparison with the state-of-the-art literature.
Accuracy
Sensitivity
Specificity
AUC
F 1-score
MCC
Proposed model (cell level)
0.989
0.992
0.988
0.999
0.990
0.979
Proposed model (patient level)
0.951
0.946
0.957
0.985
0.952
0.901
Das et al.
0.840
0.981
0.689
—
—
—
Ross et al.3
0.730
0.850
—
—
—
—
Method
2
Dong et al.
23
0.981
—
—
—
—
—
Liang et al.
22
0.973
0.969
0.977
—
—
—
0.963
0.976
0.959
—
—
—
0.977
0.971
0.985
—
—
0.731
Bibin et al.
26
Gopakumar et al.
25
Note: Bold fonts refer to the highest values.
data. The trained model could serve as triage and minimize delays in resource-constrained settings.
Disclosures Authors have no conflicts of interest to declare.
Acknowledgments This work was supported, in part, by the Intramural Research Program of the Lister Hill National Center for Biomedical Communications (LHNCBC), the National Library of Medicine (NLM), and the U.S. National Institutes of Health (NIH). The Mahidol-Oxford Research Unit (MORU) is funded by the Wellcome Trust of Great Britain. Journal of Medical Imaging
References 1. M. Poostchi et al., “Image analysis and machine learning for detecting malaria,” Transl. Res. 194, 36–55 (2018). 2. D. K. Das et al., “Machine learning approach for automated screening of malaria parasite using light microscopic images,” Micron 45, 97–106 (2012). 3. N. E. Ross et al., “Automated image processing method for the diagnosis and classification of malaria on thin blood smears,” Med. Biol. Eng. Comput. 44(5), 427–436 (2006). 4. K. Mitiku, G. Mengistu, and B. Gelaw, “The reliability of blood film examination for malaria at the peripheral health unit,” Ethiop. J. Health Dev. 17(3), 197–204 (2003). 5. Y. LeCun, Y. Bengio, and G. Hinton, “Deep learning,” Nature 521(7553), 436–444 (2015).
034501-9
Jul–Sep 2018
•
Vol. 5(3)
Rajaraman et al.: Understanding the learned behavior of customized convolutional neural networks toward malaria parasite detection. . . 6. J. Schmidhuber, “Deep learning in neural networks: an overview,” Neural Networks 61, 85–117 (2015). 7. N. Srivastava et al., “Dropout: a simple way to prevent neural networks from overfitting,” J. Mach. Learn. Res. 15, 1929–1958 (2014). 8. A. Krizhevsky, I. Sutskever, and G. E. Hinton, “ImageNet classification with deep convolutional neural networks,” in Advances In Neural Information Processing Systems, Vol. 25, pp. 1097–1105 (2012). 9. K. Simonyan and A. Zisserman, “Very deep convolutional networks for large-scale image recognition,” in CoRR, arXiv:1409.1556 (2014). 10. C. Szegedy et al., “Going deeper with convolutions,” in IEEE Conf. on Computer Vision and Pattern Recognition (CVPR), pp. 1–9 (2015). 11. K. He et al., “Deep residual learning for image recognition,” in IEEE Conf. on Computer Vision and Pattern Recognition (CVPR), pp. 770– 778 (2015). 12. C. Szegedy et al., “Rethinking the inception architecture for computer vision,” in IEEE Conf. on Computer Vision and Pattern Recognition (CVPR), pp. 2818–2826 (2016). 13. F. Chollet, “Xception: deep learning with depthwise separable convolutions,” in IEEE Conf. on Computer Vision and Pattern Recognition (CVPR), pp. 1800–1807 (2017). 14. G. Huang et al., “Densely connected convolutional networks,” in IEEE Conf. on Computer Vision and Pattern Recognition (CVPR), pp. 2261–2269 (2017). 15. M. D. Zeiler and R. Fergus, “Visualizing and understanding convolutional networks,” Lect. Notes Comput. Sci. 8689, 818–833 (2014). 16. W. Samek et al., “Evaluating the visualization of what a deep neural network has learned,” IEEE Trans. Neural Networks Learn. Syst. 28(11), 2660–2673 (2017). 17. K. Suzuki, “Overview of deep learning in medical imaging,” Radiol. Phys. Technol. 10(3), 257–273 (2017). 18. B. Zhou et al., “Learning deep features for discriminative localization,” in IEEE Conf. on Computer Vision and Pattern Recognition (CVPR), pp. 2921–2929 (2016). 19. R. Sivaramakrishnan et al., “Visualizing abnormalities in chest radiographs through salient network activations in deep learning,” in Proc. IEEE Life Sciences Conf. (LSC), pp. 71–74 (2017). 20. Y. Bar et al., “Chest pathology detection using deep learning with nonmedical training,” in Proc. IEEE 12th Int. Symp. on Biomedical Imaging (ISBI), pp. 294–297 (2015). 21. X. Wang et al., “ChestX-ray8: hospital-scale chest X-ray database and benchmarks on weakly-supervised classification and localization of common thorax diseases,” in Proc. IEEE Conf. on Computer Vision and Pattern Recognition (CVPR), pp. 3462–3471 (2017). 22. Z. Liang et al., “CNN-based image analysis for malaria diagnosis,” in Proc. IEEE Int. Conf. on Bioinformatics and Biomedicine (BIBM), pp. 493–496 (2017). 23. Y. Dong et al., “Evaluations of deep convolutional neural networks for automatic identification of malaria infected cells,” in IEEE EMBS Int. Conf. on Biomedical and Health Informatics (BHI), pp. 101–104 (2017). 24. Y. LeCun et al., “Gradient-based learning applied to document recognition,” Proc. IEEE 86(11), 2278–2324 (1998). 25. G. P. Gopakumar et al., “Convolutional neural network-based malaria diagnosis from focus stack of blood smear images acquired using custom-built slide scanner,” J. Biophotonics 11(5), e201700003 (2017). 26. D. Bibin, M. S. Nair, and P. Punitha, “Malaria parasite detection from peripheral blood smear images using deep belief networks,” IEEE Access 5, 9099–9108 (2017). 27. Y. LeCun and Y. Bengio, “Convolutional networks for images, speech, and time series,” in The Handbook of Brain Theory and Neural Networks, M. A. Arbib, Ed., pp. 255–258, MIT Press (1995). 28. W. Shang et al., “Understanding and improving convolutional neural networks via concatenated rectified linear units,” in Proc. of 33rd Int. Conf. on Machine Learning (ICML), pp. 2217–2225 (2016). 29. A. Botev, G. Lever, and D. Barber, “Nesterov’s accelerated gradient and momentum as approximations to regularised update descent,” in Int. Joint Conf. on Neural Networks (IJCNN), pp. 1899–1903 (2017). 30. J. Bergstra and Y. Bengio, “Random search for hyper-parameter optimization,” J. Mach. Learn. Res. 13, 281–305 (2012). 31. F. Chollet, “Deep learning models,” GitHub. https://github.com/fchollet/ deep-learning-models (2 February 2017).
Journal of Medical Imaging
32. S. Majumdar, “DenseNet implementation in Keras,” GitHub. https:// github.com/titu1994/DenseNet (10 December 2017). 33. Z. C. Lipton, C. Elkan, and B. Naryanaswamy, “Optimal thresholding of classifiers to maximize F1 measure,” Lect. Notes Comput. Sci. 8725, 225–239 (2014). 34. B. W. Matthews, “Comparison of the predicted and observed secondary structure of T4 phage lysozyme,” Biochim. Biophys. Acta, Protein Struct. 405(2), 442–451 (1975). 35. R. Ramprasaath et al., “Grad-CAM: visual explanations from deep networks via gradient-based localization,” in IEEE Conf. on Computer Vision and Pattern Recognition (CVPR), pp. 618–626 (2017). 36. J. S. Rossi, “One-way Anova from summary statistics,” Educ. Psychol. Meas. 47(1), 37–38 (1987). 37. S. Daya, “One-way analysis of variance,” Evidence-Based Obstet. Gynecol. 5(4), 153–155 (2003). 38. A. Vargha, H. D. Delaney, and A. Vargha, “The Kruskal–Wallis test and stochastic homogeneity,” J. Educ. Behav. Stat. 23(2), 170–192 (1998). 39. U. Kucuk et al., “Importance of using proper post hoc test with ANOVA,” Int. J. Cardiol. 209, 346 (2016). 40. P. Royston, “Approximating the Shapiro–Wilk W-test for non-normality,” Stat. Comput. 2(3), 117–119 (1992). 41. J. L. Gastwirth, Y. R. Gel, and W. Miao, “The impact of Levene’s test of equality of variances on statistical theory and practice,” Stat. Sci. 24(3), 343–360 (2009). 42. IBM Corp. Released, IBM SPSS Statistics for Windows, Version 23.0, IBM Corp., Armonk (2015). 43. D. Chicco, “Ten quick tips for machine learning in computational biology,” BioData Min. 10(1), 35 (2017). 44. S. L. Bressler, “Large-scale cortical networks and cognition,” Brain Res. Rev. 20(3), 288–304 (1995). Sivaramakrishnan Rajaraman is a postdoctoral fellow at the National Library of Medicine (NLM), National Institutes of Health (NIH). His expertise includes applying deep learning for medical image analysis and understanding, medical image processing, machine learning (ML), and biomedical signal analysis. He earned his PhD in information and communication engineering from Anna University, Chennai, India, and his BEng degree in electronics and communication engineering from Madurai Kamaraj University, India. He has authored several national, international journal, and conference publications in his areas of expertise. Kamolrat Silamut received her MSc and PhD degrees in tropical medicine from the Faculty of Tropical Medicine, Mahidol University, Bangkok, Thailand. She worked at Mahidol Oxford Tropical Medicine Research Unit (MORU) for more than 34 years. During her tenure, she was responsible for the effective assessment of morphology and stage development of Plasmodium parasites in relation to the pathophysiology of severe malaria and management of laboratory diagnosis of malaria parasites, quality control, and quality assurance of malaria slides management. Md. A. Hossain is the head of the Department of Medicine, Chittagong Medical College, Chittagong, Bangladesh. He has been working in the field of internal medicine with a special interest in infectious and tropical diseases for more than two decades. He has worked as a consultant in patient management and as a professor in the hospital and private sectors. He has also served as principal investigator in several research activities at national and international levels. He has actively collaborated on malaria research in the process of data collection. Ilker Ersoy received his PhD in computer science at the University of Missouri, Columbia, in 2014, where he developed automated image analysis algorithms to detect, segment, classify, and track cells imaged in various modalities. He is a postdoctoral fellow in the Department of Pathology and MU Informatics Institute, and the associate director of Whole Slide Image Analytics Laboratory. His research interests include biomedical and microscopy image analysis, computer vision, visual surveillance, machine learning, pathology informatics. Richard J. Maude is the head of epidemiology at Mahidol–Oxford Tropical Medicine research unit, Bangkok, Thailand and an associate professor in tropical medicine at the University of Oxford. His research combines clinical studies, descriptive epidemiology and mathematical
034501-10
Jul–Sep 2018
•
Vol. 5(3)
Rajaraman et al.: Understanding the learned behavior of customized convolutional neural networks toward malaria parasite detection. . . modeling of communicable diseases in South and Southeast Asia. His areas of interest include spatio-temporal epidemiology, clinical studies on severe malaria pathogenesis and treatment, and antimalarial drug resistance. Stefan Jaeger is a research fellow at NLM, NIH. He received his diploma in computer science from the University of Kaiserslautern and his PhD from the University of Freiburg, Germany. He has held research positions at Chinese Academy of Sciences, University of Maryland, University of Karlsruhe, Daimler, and others. At NLM, he supervises research on computational screening for malaria, and other diseases, and conducts research into image informatics and machine learning for clinical care and education. George R. Thoma received a BS degree from Swarthmore College, and his MS and PhD degrees from the University of Pennsylvania,
Journal of Medical Imaging
all in electrical engineering. As chief of the Communications Engineering Branch of the LHNCBC, a research and development division of the NLM, he directs R&D programs in image processing. He has lectured extensively on these topics at various conferences, seminars and workshops at institutions across the world. He is a fellow of the SPIE. Sameer K. Antani leads several scientific and technical research projects at NLM in medical image analytics, informatics, and data science for advancing life sciences research, education, and clinical care. He is a senior member of the SPIE and the Institute of Electrical and Electronics Engineers (IEEE). He serves as a vice chair on the IEEE TC on Computational Life Sciences and also the Life Sciences Community. He received his PhD and MEng degrees from the Pennsylvania State University, USA, and his BEng degree (with distinction) from the University of Pune, India.
034501-11
Jul–Sep 2018
•
Vol. 5(3)