Growth is driven by intentional R&D performed in the high-tech and high- ... economy, even after controlling for age, education, occupation, gender and ...
Unemployment and Endogenous Growth
Anton B.T.M. van Schaik and Henri L.F. de Groot* Department of Economics and CentER PO Box 90153 5000 LE Tilburg The Netherlands Tel: (31 13) 66 2833
Abstract In this paper we develop a two-sector endogenous growth model with a dual labour market, based on efficiency wages. Growth is driven by intentional R&D performed in the high-tech and highwage sector. It is examined how a change in rivalry among firms affects simultaneously growth and unemployment. On the one hand, an increase of the elasticity of substitution between the product varieties of different high-tech firms reduces market power and leads to higher growth but reduces job prospects. On the other hand, if barriers to entry exist, an increase of the number of rivals in the market (due to removal of entry barriers) leads to lower growth, whereas the effect on aggregate employment is ambiguous.
JEL classification: D40, E24, J21, J40, O41. Keywords: endogenous growth, efficiency wages, unemployment, dual economy, competition.
June 1995
*
We would like to thank Theo van de Klundert, Sjak Smulders and an anonymous referee for useful comments on an earlier version of this paper. Of course the usual disclaimer applies.
-1-
Unemployment and Endogenous Growth Anton van Schaik and Henri de Groot
1.
Introduction
Empirical evidence strongly suggests that wages differ considerably across broad sectors of the economy, even after controlling for age, education, occupation, gender and workplace characteristics (cf. OECD 1994, p. 28). There are certain common elements across the estimates of these differences for a number of countries, e.g., manufacturing pre-eminently being the large sector paying a relatively high non-competitive wage premium, whereas the agricultural sector pays the lowest wage. Moreover, evidence reveals that the wage premia are relatively stable over time (cf. Krueger and Summers 1988). The apparent willingness of employers in imperfectly competitive product-markets to share rents with their workers introduces frictions in the market mechanism: the unemployed may prolong their job search in the hope of entering high-wage sectors and workers displaced from these sectors may have very high replacement rates and hence reservation wages when benefits are based on previous earnings (cf. Kletzer 1992). This implies that equilibrium unemployment may be negatively related to the degree of competition in the product market. This idea is prominent in The OECD Jobs Study (cf. OECD 1994, p. 23 and 53), where it is proposed that: ’Establishing a competitive environment could, therefore, improve job prospects by both eliminating wage premia and encouraging output expansion.’ The main purpose of the present paper is to see whether tougher competition in imperfectly competitive product-markets indeed can foster aggregate employment and growth at the same time. In the project for this paper, we have developed an endogenous growth model with a traditional and a high-tech sector. The model predicts that relative nominal wages are rigid to a great extent. Labour is homogeneous, but employers in the high-tech sector are willing to pay efficiency wages for rent-sharing reasons. Thus, workers obtain a sector-specific wage rate. The presence of a dual labour market, due to an efficiency wage relation that is operating in one sector only, is an important characteristic of the model. The concept of efficiency wages has been studied widely1. What all these models have in common is that they can be used to explain the existence of involuntary unemployment. The mechanism underlying all these models is that there is a reason
1
Akerlof and Yellen (1986) and Layard, Nickell and Jackman (1991) provide good overviews.
-2for a (profit-maximizing) firm to pay a wage that is higher than the wage that clears the labour market. The reason for this is either to retain (Salop 1979), to recruit (Stiglitz 1976, Weiss 1980) or to motivate (Akerlof 1982, Shapiro and Stiglitz 1986) workers. Within this last class of models, there are again different explanations. Akerlof (1982) gives a sociological explanation and deals with ’fairness’. He assumes that workers have a norm of a fair day’s work and by paying a higher wage, this norm can be increased by the firm. Shapiro and Stiglitz (1984), on the other hand, assume that firms pay a high wage in order to prevent workers from shirking in the event that the monitoring system does not work properly. Because the firm is willing to pay a wage that is higher than the market-clearing-wage, there exists an equilibrium in which there are workers willing to work at a lower wage than the wage paid by the firm. Nevertheless, these workers are not employed because it is not in the interest of the profit-maximizing firm to hire them. That is why unemployment can be said to be involuntary. In the product markets, we assume perfect competition in the market for traditional goods and monopolistic competition in the market for high-tech goods. Growth is driven by research done in the high-tech sector. Technological progress in this sector stems from intentional activities undertaken by the private firms. It seems to be rather well established that this activity (innovation, as the outcome of intentional activities in private firms) is one of the most important sources of technological progress in OECD economies (cf. Dosi 1988, Fagerberg 1994). Recently, Smulders and Van de Klundert (1995) have incorporated the accumulation of firm-specific knowledge in a general equilibrium two-sector endogenous growth model in which labour is fully employed. We follow these authors in the general set-up of the model, and by assuming that knowledge is (at least partly) internal to the firm. However, in contrast with these authors, we let labour market institutions and thus equilibrium unemployment play a dominant role in the model. This enables us to put the relation between unemployment and endogenous growth into the foreground. Up till now, this topic has hardly been touched upon in theoretical growth literature. We proceed as follows. Section 2 presents the model. Consumers maximize utility, which leads to the warranted rate of growth. High-tech firms maximize the discounted value of the firm, which results in the planned rate of growth. In general equilibrium, the planned rate of growth equals the warranted rate of growth. Workers can be employed in one of the two sectors or they can be unemployed. The labour market is in equilibrium if the unemployed are indifferent between accepting a low-paid job in the traditional sector on the one hand, and remaining unemployed and waiting till a high-paid job in the high-tech sector becomes vacant on the other hand. Section 3 presents a general equilibrium steady-state analysis, focusing on two cases of tougher competition. The first case is an increase of the price elasticity of demand of high-tech
-3goods, induced by an exogenous change in consumer preferences. The second case deals with the effects on employment and growth of tougher competition after removing (exogenously given) institutionally determined barriers to entry in the market for high-tech products. Both cases are interesting in their own, but the second case may also be interesting from an economic policy point of view. We conclude in section 4.
2.
The model
The economy comprises two sectors. There is perfect competition in the product market for traditional goods and monopolistic competition in the product market for high-tech goods. Each firm in the high-tech sector produces a unique brand of the high-tech good. There are n high-tech firms, indexed i = 1,..,n. We assume that a high-tech firm holds only a negligible small market share, so that competition is monopolistically à la Chamberlin. Labour is homogeneous and can be employed in one of the two sectors or can be unemployed. Workers earn a sector-specific wage, while unemployed people get an unemployment benefit. In this section we will state the full model. Only the equations constituting the final model are numbered. Where no confusion arises, time indices are omitted.
2.1
Consumers
According to standard optimizing behaviour of consumers, individuals maximize intertemporal utility2
where c is a composite good, 1/ρ is the intertemporal elasticity of substitution and θ is the subjective discount rate. Consumers have Cobb-Douglas preferences over the two goods3
2
All the following maximizations are for single consumers. Therefore we omit the consumer indices. Aggregation over all consumers finally yields exactly the equations as stated in the main text.
3
This assumption of a Cobb-Douglas preference function is needed to guarantee a balanced growth equilibrium.
-4-
where Y is the traditional good and X is a bundle of varieties of the high-tech good. In addition, consumers have CES-preferences over the high-tech goods. Thus, X is defined as (cf. Dixit and Stiglitz 1977, Krugman 1990, Chapter 9)
xi represents the consumed quantity of the high-tech good of brand i, and
is the elasticity of
substitution between any two high-tech goods. The maximization problem is solved with a three step procedure. The first constraint to this problem is
This constraint describes the development of wealth A over time. The dot over A represents a derivative with respect to time (A˙t=dAt/dt). Consumers spend income on consumption cPc and obtain income by working, yielding a sector specific wage income, w, and by receiving rental income, rA, over financial assets accumulated in the past. The second constraint is
stating that consumption expenditure cPc is divided among the two types of goods that are available in the economy. The third constraint is
stating that consumers divide the spending on the high-tech goods over the n available varieties. In these formulations, Pc is the macroeconomic price index, PX is the price index of the bundle of high-tech goods, PY is the price of the traditional good and pxi is the price of a single brand of the high-tech good of variety i. Performing the three step maximization procedure finally leaves us with five equations. In the first step consumers decide how to divide total income between savings and consumption expenditure. This yields the Ramsey rule
-5-
This equation relates the growth rate of consumption to the determinants of the consumptionsavings decision. It shows that the rate of growth is high if the real return on savings (r-P˙c/Pc) is large, if consumers are patient (θ is low) and if consumers are willing to substitute intertemporally (1/ρ is high). In the second step consumers decide how to divide the income they want to spend on consumption expenditures between high-tech and traditional goods. Given the Cobb-Douglas specification chosen above this results in
where
Eq. 2 tells us that a fixed fraction 1-σ of aggregate consumption expenditure cPc is spent on traditional goods and a fixed fraction σ is spent on high-tech goods. Eq. 3 is the definition of the macroeconomic price index. In the last step consumers decide how to divide the income they want to spend on hightech goods among the n varieties of this good that are available. This yields the demand for a single variety of the high-tech good
where
The price-elasticity of demand for any variety of the high-tech good is thus equal to . From now on we employ the assumption of symmetry across firms in the high-tech sector, so that we may drop the subscript i. Hence, X = xn
/( -1)
and n = XPX/xpx. Notice that, after employing the
-6symmetry assumption, the equation for the circular flow (2) can be written as YPY/nxpx = (1-σ)/σ.
2.2
Firms
The traditional sector exhibits unitary labour-productivity
LY stands for the number of workers employed in this sector and Y is the production of traditional goods. Under perfect competition, the price of a traditional good equals labour-costs
where wY denotes the wage rate in the traditional sector. High-tech firms employ direct labour Lx, with labour productivity h and efficiency e, to produce x units of output
According to this equation, the overall productivity of direct labour x/Lx is composed out of two factors, each of which is determined differently. With respect to the efficiency e we assume, following Akerlof (1982), that the efficiency of a worker in the high-tech sector depends on the wage he earns, wx, related to the wage a worker earns in the traditional sector, wY,
We will call this the supply of effort. The reasons why this efficiency wage relation is only operating in the high-tech sector can be various. One may assume that it is because of imperfect monitoring possibilities in the high-tech sector or because of rent-sharing reasons. As profits are made in the high-tech sector only, workers may find it fair to share in the profits and hence ask for a higher wage. In that case it may be in the interest of the profit-maximizing firm to offer a higher wage4. The importance of institutional and organizational factors for the effort of workers has
4
Empirically, the relation between the operation of an efficiency wage relation and some characteristics of the sector like the size of the firm, capital intensity or kind of competition has been investigated by e.g. Krueger and Summers (1988), Brown and Medoff (1989), Arai (1994) and Gera and Grenier (1994). They find evidence for a significant wage premium for those people working in large firms and in firms that operate under imperfect competition.
-7been stressed in (historical) studies on the relation between economic institutions and economic performance. The following passage (Lazonick 1991, p. 35) is instructive:
To overcome restrictions of output and encourage workers to apply their effort to further the goals of the enterprise, employers had to assure the workers that promises of higher wages, better work conditions, and employment stability would be kept. Most capable of keeping such promises were those corporations that had already attained competitive advantage in their product markets. It was these corporations that were already generating value gains that could be shared with workers to an extent that other, less advantaged corporations could not. The most effective way to implement these incentives was by promising hard-working, loyal workers long-term employment security and a rising standard of living both on and off the job.
The variable h on the other hand can be affected by the firm by doing R&D. Assuming there is no uncertainty with respect to investment in knowledge, employing Lr units of research labour yields an increase in technology equal to
where K stands for the stock of knowledge a firm possesses. In the following we will assume for simplicity that K=h, so
(10)
h˙ h
ξ Lr .
This assumption implies that knowledge is completely internal to the firm. Alternatively, we could assume that knowledge is only partly internal to the firm. (This can easily be worked out, but turns out not to affect the main results; see footnote 115.) Finally, firms have to incur a (traditional) fixed cost Lf before being able to produce. This fixed cost is expressed in terms of labour and is exogenous. In maximizing present discounted value, high-tech firms decide about labour input in the production department Lx, labour input in the research department Lr, and the wage rate wx. This
5
In case knowledge is not completely internal to the firm, the incentive for firms to engage in research is lowered, as the firm cannot fully appropriate the benefits that are generated through the research. Thereby, one gets into a situation with a lower intensity of research (and therefore a lower growth rate) than in the case with no knowledge spillovers.
-8optimization finally leaves us with four equations (see Appendix A)6. The first equation shows the wage setting behaviour. Firms will pay higher wages as long as the increase in benefits related to the increase in efficiency more than offsets the increase in costs in the form of a higher wage bill. This comes down to what we will call the modified Solow condition
According to the standard Solow condition the wage elasticity of effort should equal one. This conclusion is however based on a model in which fixed labour (and also research labour) plays no role (e.g. Schmidt-Sørensen 1990). This explains the difference between the standard and the modified Solow condition, where the wage elasticity of effort exceeds one. The second equation describes price-setting-behaviour. Given the market power high-tech firms have, they will simply put a mark-up over their wage costs
This relation shows that real wages in the high-tech sector wx/px increase with labour productivity h. Unit real labour costs wx/ehpx equal ( -1)/
and are therefore invariant with respect to labour
productivity growth. The mark-up is inversely related to the elasticity of substitution between any two high-tech goods. The closer these goods form substitutes, i.e., the higher
, the less market
power firms have and the lower the mark-up they can put on labour costs. The third equation determines the optimal research effort
In this formulation ph is the shadow price of the level of technology h. It is a measure of the marginal value of an additional unit of h for the firm. According to this equation, a firm equalizes the marginal revenue of doing research (consisting of an increase in the level of technology a firm can use) with the marginal costs of R&D, i.e., the wage bill of a research worker. Combining the
6
In this approach, we determine the input of research labour on the basis of optimizing behaviour of the firm. To this approach, serious objections can be raised. The future revenues of doing R&D are, almost by definition, inherently uncertain. The use of a perfect foresight model certainly is not able to capture this important aspect of R&D properly. On average, however, it seems justified to assume that the input of more labour into the R&D process will lead to a higher output of knowledge. An alternative would be the use of a rule of thumb for R&D input.
-9eqs. 12 and 13 leads to
This relation shows that the price (of the input) of knowledge in terms of the price (of the output) of the final product will rise if it becomes relatively costly to generate new knowledge (ξ is low), if the efficiency of production workers increases and if high-tech goods form closer substitutes (higher ). Finally, we derive the dynamic equation
According to this equation, the marginal cost of an increase in h, which consists of capital costs r, should equal the marginal revenue of an increase in h, which consists of an addition to the stock of knowledge, an increase of production and a capital gains term, p˙h/ph. If there is free entry and exit, the number of high-tech firms is endogenous. The number of firms is determined by the profit opportunities that are left in the (total) market after that individual firms have outweighed the costs and benefits of investing in knowledge on the one hand with the costs and benefits of demanding effort on the other hand. In equilibrium, no firm earns a profit. Assuming that all firms, i.e., new and incumbent firms, are symmetrical, the zero profit condition comes down to
This equation determines the number of firms. If this condition does not hold, for instance due to barriers to entry, the number of firms is an exogenous variable.
2.3
Labour
In the labour-market there are three states in which a person can be: he can be employed in one of the two sectors or he can be unemployed. Thus, the labour constraint can be written as
where U is the number of people being unemployed and L is the labour force (which is exogenous
-10and constant). The unemployed receive an unemployment-benefit that is a fraction b of the wage in the traditional sector. Consequently, the nominal unemployment benefit equals bwY. This benefit is paid out of lump-sum taxes on labour income so that it does not affect consumer’s optimizing behaviour. It is assumed that the net real wage in the traditional sector is higher than the real unemployment benefit, so that the unemployment benefit b must be sufficiently smaller than 1. The number of people working in the high-tech sector equals
In principle, all people prefer to work in the high-wage sector as they strive for the highest possible pay-off. However, given the structure of aggregate demand and the operation of the efficiency wage relation not everybody can be employed in that sector. Those people that are not employed in the high-wage sector face two alternative opportunities. They can either choose to be unemployed or they can choose to accept a job in the traditional sector. We assume here that, although the pay-off is higher in the traditional sector than in the pool of unemployed, there are people that choose to be unemployed and queue for high-wage jobs7. This may be because it is more difficult to find a job in the high-tech sector when working in the traditional sector or because there are negative status effects from working in the traditional sector (see e.g. Layard et.al. 1991). The implication of this is that there is a reason for people to be unemployed and accepting a relatively low pay. The probability that an unemployed person will get a job in the high-tech sector equals δLT/U. Here, δ stands for the (exogenously given) quit-rate in the high-tech sector (which is composed of the chance of being fired, the chance of retiring, etc.)8. The numerator of this expression describes the number of high-paid jobs that falls free in every period. The denominator gives the number of people that is waiting for such a job. In (labour market) equilibrium it must hold that people are indifferent between accepting a job in the traditional sector on the one hand and being unemployed with a chance of getting a high-wage job on the other hand. This equilibrium condition looks like
where the LHS of this expression is the pay-off when working in the traditional sector and the
7
Bulow and Summers (1986) remark that the assumption of workers queueing for high-wage jobs may be justified both theoretically and empirically.
8
Of course, one could endogenize the lay-off rate, but for the purpose of this paper this point is not crucial.
-11RHS is the expected pay-off if one chooses not to work in the traditional sector. Thus the equilibrium unemployment ratio in the high-tech sector equals
This relation shows that there is a positive relation between the unemployment ratio in the hightech sector on the one hand and the relative wage, the unemployment benefit and the lay-off rate in the high-tech sector on the other hand. This relation could be further based on micro-economic behaviour, but this is not needed for the purpose of this paper9. Crucial for this paper is the positive relation between the rate of unemployment in the high-tech sector and the relative wage. We have now specified both the consumer and producer side and the labour market of the model, so that we are able to characterize the solution of the model. The conditions for an economically meaningful solution are
In total, we are left with a system of 18 equations and 24 unknowns, namely n, c, c˙, Pc, P˙c, r, Y, PY, PX, LY, wY, x, h, h˙, e, Lx, wx, Lr, px, ph, p˙h, LT, U and X. The system can be solved after defining a numéraire (alternatively, we could solve the model in relative prices) and after taking into account the definitions for the growth rates that link the levels of consumption, the price index of consumption, the level of technology and the shadow price of the level of technology with their respective growth rates. The system jumps to a steady-state growth equilibrium as there are no
9
Following for example Johnson and Layard (1986) the option to wait can be written as
where φ is the probability per unit of time that an unemployed person gets a job in the high-tech sector. The other option is not to wait, to accept and hold a job in the traditional sector continuously which yields
The labour market is in equilibrium if φ=δLT/U, which comes down to
This specification turns out not to affect the results of the growth block of the model, but complicates the analysis of the allocation of labour over sectors.
-12predetermined rigidities and as there are constant returns to scale with respect to knowledge (cf. Smulders and Van de Klundert 1995).
3.
Comparative statics
In this section, we will first characterize the properties of the steady-state equilibrium of the complete model. Thereafter, we will compare the free entry equilibrium that is characterized by zero-profits in the high-tech sector with the blocked entry equilibrium, where the number of firms is exogenous and profits are non-negative. By comparing these equilibria, we are able to deduce the effects on unemployment and growth of economic policies aiming at strengthening the competitive forces in imperfectly competitive products-markets. We start, for the moment, with the assumption that the relative wage (wx/wY≡ω), the R&D employment ratio (Lr/Lx≡β) and the number of firms (n) are exogenous. This allows us to depict the basic determinants of the sectoral allocation of labour and serves as a preliminary step towards the analysis of the complete model.
3.1
The allocation of labour
With ω, β and n fixed, the model can easily be solved. Substituting the expression for unemployment (18) into the labour constraint (16) yields
What this equation basically says is that a rise of employment in the high-tech sector and the accompanied increase of the number of unemployed people leaves less workers to be employed in the traditional sector. In other words, labour supply in the traditional sector is restricted by the difference between total labour supply and labour supply in the high-tech sector. Labour supply in the high-tech sector includes the number of people waiting for a job in that sector. The second relation between LY and LT follows from substituting the eqs. 6, 7, 8, 12 and 17 into eq. 2 and using Lr = βLx and the symmetry assumption
This equation shows that, for the circular flow to be in equilibrium, an increase of employment in the high-tech sector must be accompanied with an increase of employment in the traditional sector.
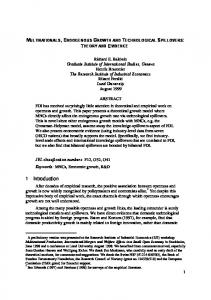
-13Equating A and B gives the full solution of the (simplified) model in terms of LT. It is instructive to derive the (preliminary) comparative static results from a picture, which decomposes labour over employment in the traditional sector, employment in the high-tech sector and unemployment (see Figure 1). In the figure it holds that
The figure also depicts the full-employment line, describing all possible divisions of labour over the two sectors for D=0. In this case there is no reason for people to remain unemployed as no new jobs will open up in the high-tech sector. If D>0, however, there is unemployment. The level of unemployment is determined by confronting the solution of the model, i.e., the intersection of line A and line B (point E), with the full-employment line.
Figure 1.
In the figure, a rise of the R&D employment ratio rotates line B around its intercept with the LTaxis to the right, leading to the new equilibrium point E’. Employment in the high-tech sector increases, whereas employment in the traditional sector decreases. On balance, aggregate employment declines, because the number of jobs in the high-tech sector is rising, so that waiting for a job in the high-tech sector becomes more attractive than accepting a job in the traditional sector. A similar reallocation of labour (higher unemployment, lower employment in the traditional sector and higher employment in the high-tech sector) results for a rise of the number of firms (parallel
-14shift of line B along the LT-axis to the right). The effect on unemployment of a rise of the relative wage is ambiguous. A higher relative wage makes more people willing to wait for a high-paid job, so that unemployment increases. (In the figure line A turns clockwise around its intercept with the LY-axis.) A higher relative wage makes high-tech goods more expensive relative to traditional goods, so that production shifts away from high-tech goods towards traditional goods. (In the figure line B rotates around its intercept with the LT-axis to the left.) This raises employment in the traditional sector, whereas employment in the high-tech sector falls. Unemployment also declines, because waiting for a job in the hightech sector becomes less attractive than accepting a job in the traditional sector. Thus, a rise of the relative wage has both a positive and a negative effect on unemployment. For the complete model, it remains to be seen which effect dominates. Finally, we consider the effects of a rise of the elasticity of substitution between any two high-tech goods
. This change in consumer preferences strengthens competition between high-
tech firms. Traditional goods become more expensive relative to high-tech goods, so that labour shifts from the traditional sector towards the high-tech sector (in the figure line B rotates around its intercept with the LT-axis to the right). On balance, aggregate employment decreases for reasons discussed before. Economic growth is enhanced. This is due to the increase of employment in the high-tech sector, which (as β and n are fixed) induces a greater number of research workers and thus a higher rate of growth of labour productivity. It remains to be seen whether this result, i.e., the trade-off between aggregate employment and growth by a change of the price elasticity of high-tech goods, stands upright in the fully fledged model, where β, ω and n are no longer fixed. This will be the topic of the remainder of this section.
3.2
The free entry equilibrium
The free entry economy is characterized by the zero profit condition (15)
Using the production function (8) and the price equation (12), this condition can be written as
The LHS is the mark-up over wage costs. In equilibrium, the mark-up (minus 1) equals the fixed costs in terms of direct labour (i.e. (Lr+Lf)/Lx). The same ratio between indirect and direct labour
-15was found in the RHS of the modified Solow condition (11). Thus, equating the zero profit condition with the modified Solow condition yields the equilibrium effort level
Combining this with the supply of effort (9), yields the equilibrium relative wage
This expression reveals that the relative wage is rigid to a great extent. It only depends on the parameters of the efficiency wage relation and the mark-up. The relation between ω and
is
positive, which will be explained later on (see Table 1). We now will derive the full solution of the model. To start with, notice that in the steady state it holds per definition that
Labour productivity in the high-tech sector grows at a constant rate, denoted by g. Output of hightech goods also grows at rate g, while output of traditional goods is constant. In addition, from the eqs. 2 and 3 it can be derived that the steady-state circular flow equilibrium is characterized by
Since consumers spend a constant fraction σ on high-tech goods, the macroeconomic rate of growth is σg, whereas the relative price PY/px increases at the rate g. Taking the price of the traditional good as a numéraire (PY=1), this implies that the price of a high-tech good decreases at the rate g. Further, notice that for firms the real rate of interest comes down to
In equilibrium ph/px is a fixed ratio, so that the growth rate of the price of the input of knowledge equals the growth rate of the price of output of high-tech products. This implies that the equilibrium real rate of interest can be written as
-16(22)
rx
r
g.
Another expression for the real rate of interest is found by substituting the eqs. 12 and 13 into eq. 14. The result is (23)
rx
ξ ( Lx Lr ) .
Using the definition of the growth rate g, the production function of the research department (10) is now written as (24)
Lr
g . ξ
Combining the eqs. 22, 23 and 24 yields
This equation shows the equilbrium R&D employment ratio as the present value of the steady-state rate of growth. Alternatively, using eq. 24, this relation can be written as (26)
Lx
r , ξ
which reveals that the equilibrium productivity of direct labour (1/Lx) equals the present value of the (exogenously determined) productivity of research labour. Substitution of this equation into the zero profit condition (19) then results in the following expression for the size of the individual firm (27)
Lx Lr Lf
r . 1 ξ
The size of the firm will be larger, the higher the rate of interest. Obviously, this is connected with the fact that high-tech firms have to cover investment in knowledge and other fixed costs. Investment decisions lead to the planned rate of growth, which follows after substituting the eqs. 24 and 26 into 27 as
The planned rate of growth depends positively on r-( -1)ξLf, which measures the attractiveness of investment for firms. Consumers, on the other hand, decide to save. Substituting the expression for the steady-state equilibrium into the Ramsey rule (1), we get the warranted rate of growth
-17-
The warranted growth rate depends positively on r-θ, which measures the attractiveness of savings for consumers. In equilibrium, the planned rate of growth equals the warranted rate of growth, which yields the following relations for the equilibrium rate of growth
(30)
g
(
1) ξ Lf
σ (ρ 1)
θ
1
,
and the equilibrium rate of interest
(31)
r
1)σ ( ρ 1 ) ξ Lf
(
σ (ρ 1)
(
1) θ
1
.
Notice that equilibrium rate of growth does not depend on the size of the labour force L. The solution is depicted in Figure 2. For an economically meaningful steady-state equilibrium, it can be reasoned that the slope of the line for the warranted rate of growth has to be smaller than the slope of the line for the planned rate of growth and that the point of intersection must guarantee that r>0. The first inequality that guarantees this is a condition for the stability of the model and comes down to σ(ρ 1)
1> .
As >1, this condition implies in addition that ρ>110. (The intertemporal elasticity of substitution should be smaller than one, which gives an upper bound to the warranted rate of growth.) The second inequality ensures that the rate of growth is positive and comes down to (
1 ) ξ Lf > θ.
This condition will hold for a sufficiently large value of traditional fixed cost Lf. Taken together, these conditions imply that σ(ρ-1)ξLf>θ. Using these conditions it follows from Figure 2 that both the equilibrium rate of growth and the equilibrium rate of interest depend positively on , ξ and Lf
10
Empirically, this seems to be the relevant case (cf. King and Rebelo 1993).
-18and negatively on ρ, θ and σ.11 The equilibrium rate of growth does not depend on parameters from the side of the labour market in the model. In other words, in the free entry equilibrium, the growth rate does not depend on the relative wage. Although the wage rate is an instrument for the firm that is choosen optimally to maximize profits, it is basically a variable that is fully determined in connection with the size of the firm. Nevertheless, the relative wage is an important determinant of the sectoral allaction of labour and consequently of the concentration ratio in the market for high-tech products. This can be seen from the complete solution of the model12. Here it suffices to give the outcome for the equilibrium number of unemployed13
(32)
L
U 1
1 D
1 σ ω σ D
.
This relation reveals that U/L depends positively on D (and via ω on
; the term ω/D depends
negatively on ω). Thus, in addition to the positive relation between the relative wage and the rate of unemployment in the high-tech sector (which characterizes labour market equilibrium), in general equilibrium we find a positive relation between the relative wage and the absolute number of unemployed people.
11
These results, which stem from the growth block of the free entry model, correspond with the findings of Smulders and Van de Klundert (1995). Following these authors it is easy to show that the introduction of a more extended knowledge base in R&D activities does not yield important additional insights. In the following formulation
research may also benefit from spillovers from the knowledge developed for other products. The fruits of R&D are in other words not completely internal to the firm. Repeating the procedure described in the text yields
The only difference with the equations in the text is the addition of α to the composite parameter σ(ρ-1). 12
The solution for LT, LY and n (see Appendix B) follows from eq. 19 and the eqs. A and B in subsection 3.1. (Lr is found with eqs. 24 and 30 and Lx with eqs. 26 and 31.)
13
To keep the equation tractable, we did not substitute the equilibrium relative wage (21) out.
-19-
Figure 2.
Table 1 Comparative static results (free entry equilibrium) n
g
β
ρ
+
-
θ
+
σ
ω
Lx
Lr
LT
LY
-
-
-
-
-
-
-
+
-
-
+
-
-
+
-
-
+
+
+
+
+
-
+n
ξ
-
+
+
+
+
Lf
-
+
+
+
+
b
-
+
-
-
L
+
+
+
+
+
U
Table 1 gives a complete overview of the comparative static results. These can be derived in a straightforward manner, taking into account the stability condition and the condition for a positive
n
LY will increase if δ < (1-b)/b (that is if the lay-off rate and/or the unemployment benefit are not too high). The reason is that high lay-off rates and/or high unemployment benefits (together with the rise of the relative wage) make waiting for a high-paid job more attractive than being unemployed in the traditional sector.
-20growth rate. The Table gives rise to the following conclusions. There is a negative relation between economic growth, g, and the number of firms, n. This is explained as follows. Before being able to produce, high-tech firms have to incur traditional fixed costs. In addition, to keep their position in the market, firms have to invest in R&D, which is also a fixed cost. Large fixed costs limit the possibility of making profits. The larger the fixed cost, the smaller is the ’room’ for firms with nonnegative profits. This restricts the number of firms. Thus, the larger the fixed cost, the larger the size of the individual firm and the more is each firm able to afford a large research department and to grow fast. There is no relation between the rate of growth and the size of the labour force L and the unemployment benefit b. An increase of the labour force leads to an equiproportionate rise of the number of firms, so that the ratio between economy-wide traditional fixed costs and total labour (nLf/L) does not change. A more generous unemployment benefit system increases the attractiveness of being unemployed, which restricts effective supply of labour (L-U) and therefore the number of high-tech firms. As can be seen from the number of production workers Lx, the size of the firm does not change, so that total employment in the high-tech sector declines. The rate of growth is negatively related to the willingness to smooth consumption over time ρ and the discount rate θ. The higher ρ, the less people are prepared to save now in exchange for future consumption. This lowers the warranted rate of growth. Incumbent firms will adapt the planned rate of growth to the lower level of savings by investing less in knowledge. Profits will therefore become positive and these will attract new firms until a new zero profit equilibrium is reached. The size of the firm decreases as can be seen from the lower number of production and research workers Lx. The increase of the number of firms exactly compensates the decrease of employment of the individual firm, so that total employment in the high-tech sector does not change. There is therefore no (additional) incentive for people to wait until a high-paid job falls free, so that aggregate employment does not change either. An increase of the discount rate θ leads to the same situation. The rate of growth also depends negatively on the share of income spent on high-tech goods σ. Since the production of traditional products does not grow and traditional and high-tech goods form imperfect substitutes, a higher share of income spent on high-tech goods hampers the warranted rate of growth. This leads in principle to the same situation as described above in the case of a higher ρ. The difference is that production shifts away from traditional towards high-tech goods, which raises employment in the high-tech sector and decreases employment in the traditional sector. Unemployment increases, because there are more jobs in the high-tech sector, so that waiting for a high-paid job becomes more attractive.
-21The rate of growth depends positively on the elasticity of substitution between any two high-tech goods . A rise of this price elasticity strengthens the competitive forces on the market for high-tech goods, so that the price of high-tech goods falls relative to the price of traditional products. This will decrease employment in the traditional sector. Ultimately, the effect on LY is ambiguous, because U increases and LT decreases14. In the high-tech sector profits decline due to the increased competitiveness and some firms have to leave the market. The remaining firms are larger and are thus able to invest more in knowledge, which raises the rate of growth. Aggregate employment drops however. This is explained as follows. A rise of the price elasticity
lowers the
mark-up on wage costs and thus raises unit real labour costs. Tougher competition forces firms to reduce these costs by paying higher wages in order to invoke more effort (note that the wage elasticity of effort is greater than one). The higher relative wage makes people more willing to wait for a job in the high-tech sector so that the number of unemployed people increases. Thus, we can conclude that in a free entry equilibrium, a rise of the price elasticity
reveals a trade-off between
aggregate employment and economic growth.
3.3
The blocked entry equilibrium
In an economy with institutionally determined barriers to entry, economic policy could establish a more competitive environment, so that new firms can enter the market for high-tech products. To study the effects of such a policy, we will compare the free entry equilibrium (further denoted by subscript f) with the blocked entry equilibrium (further denoted by subscript b)15. The differences between the two equilibria can be detected in a straightforward manner by realizing that in the free entry economy profits are zero which according to the modified Solow condition (11) and the zero profit condition (19) implies the following equalities simultaneously
14
LY will increase if the lay-off rate and/or the unemployment benefit are not too high. See the footnote in Table 1.
15
Alternatively, we could solve the whole model by determining the demand for effort from the side of the firm as a function of its price (the relative wage). This relation follows from combining eqs. 2, 10, 11, 16, 17, 18, 22, 23 and 29. This required effort can be confronted with the supply of effort (eq. 9). This yields the equilibrium level of effort and the equilibrium relative wage. All other endogenous variables can then be derived in a straightforward manner. However, this way of solving the model does not yield a closed form solution due to non-linearity. One therefore has to resort to numerical simulations. Qualitative results can however be obtained and we concentrate on that in the main text.
-22-
In the blocked entry economy profits are positive. This implies that the mark-up over wage costs is higher than the wage elasticity of effort
Thus we see that in free entry equilibrium the wage elasticity of effort (further denoted by W) is higher than in blocked entry equilibrium. According to the efficiency wage relation, effort is positively related to the relative wage, so that the inequality between the mark-up and the wage elasticity of effort implies that in blocked entry equilibrium the relative wage is higher than in free entry equilibrium. (Lower relative wages might thus be instrumental in fostering competitive forces on products markets.) These inequalities (Wf>Wb and ωb>ωf) can further be used to give a full description of the differences between the two equilibria (see Table 2). The results have been derived as follows. For the blocked entry economy, the planned rate of growth is found after substituting the eqs. 24 and 26 into eq. 11
There is a positive relation between gb and rb, as Wb>1. Equating the planned rate of growth with the warranted rate of growth (29) leads to the equilibrium rate of growth
and the equilibrium rate of interest
An important point to make here is that in contrast with the free entry equilibrium, there is now a relation between the growth rate and labour market considerations. To be more specific, the blocked entry model reveals a positive relation between the rate of growth and the relative wage (which follows from eq. 34 and the notion that dW/dω Wb - 1 > 1/(σ(ρ-1)). Notice that if Wb = /( -1) the conditions for an economically meaningful zero profit equilibrium are replicated.
-24-
From the eqs. 24 and 26 it then immediately follows that
We can therefore conclude that average firm size decreases when barriers to entry are released. In addition, it can be shown that (see Appendix B)
These results can be explained as follows. In the blocked entry economy firms make profits. After removing the barriers to entry, new firms enter the market and try to share in these profits. As new firms enter the market, firms become smaller in size and economy-wide traditional fixed cost increase. The share of fixed costs per firm increases. This makes the ’room’ for firms with nonnegative profits smaller. As a result, firms cannot afford a higher relative wage to invoke more effort, neither can they afford a larger research department to raise labour productivity. On the contrary, both the relative wage and the number of research workers per firm decrease. As a consequence, economic growth is depressed. Thus, establishing a more competitive environment by removing barriers to entry improves job prospects in the high-tech sector by invoking cheaper labour, but this goes at the expense of the expansion of output. The economy becomes more ’high-tech’, but economic growth slows down. The effect of removing barriers to entry on the rate of unemployement is ambiguous as can be seen by comparing the following expression for unemployment in the blocked entry economy (36)
Ub 1
1 D
L 1 σ ω σ D
1 1 Wb
.
with the corresponding relation for unemployment in the free entry economy (32). The difference is the ratio between the mark-up and the wage elasticity of effort (which equals one in the free entry equilibrium) in the denominator of these equations. ’Moving’ from the blocked entry equilibrium towards the free entry equilibrium the denominator shows two oppositie effects. The ratio between the relative wage and the wage elasticity of effort (ω/W) decreases, which has a positive effect on unemployment and the unemployment ratio in the high-tech sector (D) decreases, which has a negative effect on the number of unemployed. In general, it is not possible to say
-25which effects dominates18. In any case, moving from blocked towards free entry reduces the relative wage and the growth rate. Concluding, the model shows that the move towards free entry is at best characterized by a trade-off between employment and growth. In the worst case, both growth and aggregate employment decrease when moving towards free entry.
4.
Conclusion
In this paper, we have developed a model to study the interaction between equilibrium unemployment and long-term endogenous economic growth. In the model, investment in R&D is a major source of fixed costs and therefore of excess profits in imperfectly competitive product markets. Excess profits come about because new firms cannot enter. Incumbent firms are willing to share excess profits with their workers. This shows up in a dual economy with high-paid jobs in the growth-generating high-tech sector and low-paid jobs in the traditional sector. Robust comparative static results are obtained for the zero-profit steady-state general equilibrium of the model. The model is used to evaluate the policy recommendation in The OECD Jobs Study (cf. OECD 1994) that economic policy might aim at improving job prospects by both eliminating wage premia and encouraging output expansion. The model predicts that establishing a more competitive environment by removing statutory limitations on competition and other government intervention in the market process indeed may improve job prospects in the high-tech sector by levelling down the relative wage, but this goes at the expense of employment in the traditional sector. The economy becomes more ’high-tech’, but economic growth is lower. Therefore, from an economic policy point of view, one has to outweigh the welfare effects of more high-paid jobs on the one hand with the welfare effects of a lower rate of economic growth and less low-paid jobs on the other hand. From a macroeconomic perspective, inducing more entry by firms leads in the best case to lower unemployment. It can however not be precluded that both economic growth and employment decrease.
18
This is seen from the condition for Uf < Ub that looks like
-26-
Appendix A Producer behaviour of high-tech firms On the producer side of the model we assume that high-tech firms compete monopolistically. Each firm, producing a unique brand of the high-tech good, is assumed to maximize its present discounted value Vi which yields
subject to
The ’current value’ Hamiltonian corresponding to this optimization problem is
where phi is the shadow price of the level of technology (hi). This shadow-price is a measure of the marginal value of an additional unit of h for the firm. The first order conditions of this maximization problem are
which yields the modified Solow-condition,
which shows that firms engage in mark-up pricing,
-27-
which yields optimal R&D input, and
Rewriting these first order conditions a little (thereby invoking the symmetry assumption and assuming K=h), yields eqs. 11-14 in the text.
Appendix B The allocation of labour In the blocked entry economy the number of firms is fixed. This number can be expressed in terms of the parameters of the model in the same manner as the number of firms in the free entry economy is derived. A full closed solution of the blocked entry model is intractable, but we can compare the two economies in a qualitative sense by applying the following inequalities19
Wf >Wb ,
γ ( ei
Wi ≡
Df < Db ,
a) ei
Di ≡
ωf < ωb ,
,
i
δ (ωi b ) 1 b
f,b,
,
( ωi > 1 ) .
It follows that20
19
Note that Wf= /( -1) and ωf is determined by eq. 21, so that a full closed solution of the free entry model is obtained. Given these results, the comparative static results (Table 1) can be obtained when taking into account the stability condition and the condition that is needed to ensure that the growth rate is positive as mentioned in the text.
20
The integer problem with respect to the number of firms is ignored to simplify the analysis.
-28-
The denominator shows two opposite effects. The ratio between the wage elasticity of effort and the relative wage increases, which has a negative effect on LY and the unemployment ratio in the high-tech sector decreases, which has a positive effect on LY. Writing the second term of the denominator in terms of the relative wage and determining the derivative of this term with respect to the relative wage it is unambiguously true that
Note that we saw this condition before (see the footnote in Table 1).
-29-
References Akerlof, G.A.: Labor Contracts as Partial Gift Exchange. The Quarterly Journal of Economics 97, 543-569, 1982. Akerlof, G.A. & Yellen, J.L.: Introduction. In Akerlof and Yellen (eds.), Efficiency Wage Models of the Labor Market, Cambridge University Press, 1-21, 1986. Arai, M.: An Empirical Analysis of Wage Dispersion and Efficiency Wages. The Scandinavian Journal of Economics 96, 31-50, 1994. Brown, Ch. & Medoff, J.: The Employer Size-Wage Effect. Journal of Political Economy 97, 1027-1059, 1989. Bulow, J.I. & Summers, L.H.: A Theory of Dual Labor Markets with Application to Industrial Policy, Discrimination, and Keynesian Unemployment. Journal of Labor Economics 4, 376-414, 1986. Dixit, A. & Stiglitz, J.E.: Monopolistic Competition and Optimum Product Diversity. The American Economic Review 67, 297-308, 1977. Dosi, G.: Sources, Procedures, and Microeconomic Effects of Innovation. The Journal of Economic Literature 26, 1120-1171, 1988. Fagerberg, J.: Technology and International Differences in Growth Rates. The Journal of Economic Literature 32, 1147-1175, 1994. Gera, S. & Grenier, G.: Interindustry Wage Differentials and Efficiency Wages: Some Canadian Evidence. Canadian Journal of Economics 27, 81-100, 1994. Johnson, G.E. & Layard, P.R.G.: The Natural Rate of Unemployment: Explanation and Policy. In Ashenfelter, O. & Layard, R. (eds.): Handbook of Labor Economics, volume II, Elsevier Science Publishers B.V., Amsterdam, 1986. King, R.G. & Rebelo, S.T.: Transitional Dynamics and Economic Growth in the Neoclassical Model. The American Economic Review 83, 908-931, 1993. Kletzer, L.: Industry Wage Differentials and Wait Unemployment. Industrial Relations 31, 250269, 1992.
-30Krueger, A.B. & Summers, L.H.: Efficiency Wages and the Inter-Industry Wage Structure. Econometrica 56, 259-293, 1988. Krugman, P.R.: Rethinking International Trade, The MIT Press, Cambridge, Massachusetts, 1990. Layard, R. & Nickell, St. & Jackman, R.: Unemployment, Macroeconomic Performance and the Labour Market, Oxford University Press, 1991. Lazonick W.: Business Organization and the Myth of the Market Economy. Cambridge University Press, 1991. OECD: The OECD Jobs Study; Evidence and Explanations, Part II, Paris, 1994. Salop, S.C.: A Model of the Natural Rate of Unemployment. The American Economic Review 69, 117-125, 1979. Schmidt-Sørensen J.B.: The Equilibrium Effort-Wage Elasticity in Efficiency Wage Models. Economics Letters 32, 365-369, 1990. Shapiro, C. & Stiglitz, J.E.: Equilibrium Unemployment as a Worker Discipline Device. The American Economic Review 74, 433-444, 1984. Smulders, S. & Klundert, Th. van de: Imperfect Competition, Concentration and Growth with Firm-Specific R&D. European Economic Review 39, 139-160, 1995. Stiglitz, J.E.: The Efficiency Wage Hypothesis, Surplus Labour, and the Distribution of Income in L.D.C.s. Oxford Economic Papers 28, 185-207, 1976. Weiss, A.: Job Queues and Layoffs in Labor Markets with Flexible Wages. Journal of Political Economy 88, 526-538, 1980.