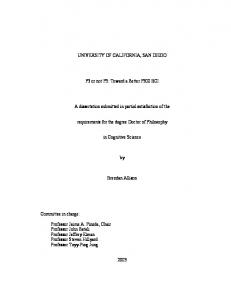
Figure 2: Spectrophotometry of the 2 Green Light Masks Used in the. Study compared to ...... Participants wore a Sleep Watch with Light wrist monitor. (Ambulatory ...... influence of various irradiances of artificial light, twilight, and moonlight on ...
UNIVERSITY OF CALIFORNIA, SAN DIEGO SAN DIEGO STATE UNIVERSITY
Sleep, Mood, and Circadian Responses to Bright Green Light During Sleep
A Dissertation submitted in partial satisfaction of the requirements for the degree
Doctor of Philosophy in Clinical Psychology by Michael Andrew Grandner Committee in charge: University of California, San Diego Dr. Daniel F. Kripke, Chair Dr. Sonia Ancoli-Israel Dr. Sean P. A. Drummond San Diego State University Dr. Linda Gallo Dr. Claire Murphy 2007
© Michael Andrew Grandner, 2007 All rights reserved
The Dissertation of Michael Andrew Grandner is approved, and it is acceptable in quality and form for publication on microfilm:
Chair
University of California, San Diego San Diego State University
2007
iii
TABLE OF CONTENTS
SIGNATURE PAGE …………………………………………………………….iii TABLE OF CONTENTS ………………………………………………………..iv LIST OF TABLES ……………………………………………………………….vi LIST OF FIGURES …………………………………………………………….viii ACKNOWLEDGEMENT ………………………………………………………..xi VITA ……………………………………………………………………………..xiii ABSTRACT OF THE DISSERTATION …………………………………….xxiii INTRODUCTION ………………………………………………………………..1 The Value of Bright Light Stimulation …………………………………1 Physiology of Light …………………………………………………….10 Light: Physiological and Psychological Effects ……………………..14 Light Treatment of Affective Disorders ………………………………16 Light Delivery: Light Box and Light Mask ……………………………28 Special Effectiveness of Green Light ………………………………..32 Aims of the Present Study …………………………………………….36 METHOD ………………………………………………………………………..38 Overview ……………………………………………………………......38 Subjects …………………………………………………………………38 Materials ………………………………………………………………...40 Procedure ……………………………………………………………….51
iv
Data Analyses ………………………………………………………….53 RESULTS ………………………………………………………………………56 Recruitment and Screening …………………………………………..56 Subject Characteristics ………………………………………………..56 Distributions of Dependent Variables ………………………………..58 Safety of Nocturnal Green Light Masks ……………………………..58 Effects of Nocturnal Green Light Masks on Actigraphic Sleep and Circadian Timing ………………………………………………….60 Effects of Nocturnal Green Light Masks on Subjective Sleep …….61 Effects of Nocturnal Green Light Masks on Mood ………………….62 DISCUSSION …………………………………………………………………..64 Light Masks are Safe and Tolerable for Use in Research …………64 Light Masks Advanced Circadian Phase But Did Not Improve Sleep …………………………………………………………………….67 Light masks Did Not Improve Mood ………………………………….71 Extensions to Current Knowledge ……………………………………72 Limitations of the Study ……………………………………………….74 REFERENCES ……………………………………………………………….108
v
LIST OF TABLES
Table 1: Outline of the study ………………………………………………….77
Table 2: Age and Ethnicity Breakdown for Light Groups and Screened Non-Participants …………………………………………………...78
Table 3: Number of Nights Self-Reported Compliant and Group Status For Each Subject ………………………………………………………79
Table 4: Mean Values for Baseline, End and Difference Scores for Mood, Sleep Questionnaire, Sleep Diary, and Actigraphy Variables, by Light Group ……………………………………………………..81
Table 5: SAFTEE “Eye” Subscale Baseline, End and Difference Scores for Bright Green and Dim Red Light Groups, with MannWhitney U Comparisons of Difference Scores ……………………………86
Table 6: SAFTEE “Chest” Subscale Baseline, End and Difference Scores for Bright Green and Dim Red Light Groups, with MannWhitney U Comparisons of Difference Scores ……………………………..87
vi
Table 7: Correlations Between Sleep Diary and Actigraphic Sleep Variable Analogues at Baseline and End of Study …………………………88
vii
LIST OF FIGURES
Figure 1: Approximate light exposure in various environments …………. 89
Figure 2: Spectrophotometry of the 2 Green Light Masks Used in the Study compared to daytime sunlight …………………………………………90
Figure 3: SAFTEE Overall Score Baseline and End scores with Means for Dim Red and Bright Green Light Groups ……………………….91
Figure 4: SAFTEE “Eye” Subscale Baseline and End scores with Means for Dim Red and Bright Green Light Groups ……………………….92
Figure 5: SAFTEE “Chest” Subscale Baseline and End scores with Means for Dim Red and Bright Green Light Groups ……………………….93
Figure 6: QIDS Baseline and End scores with Means for Dim Red and Bright Green Light Groups ……………………………………………….94
Figure 7: PSQI Baseline and End scores with Means for Dim Red and Bright Green Light Groups ……………………………………………….95
viii
Figure 8: HOMEQ Baseline and End scores with Means for Dim Red and Bright Green Light Groups ……………………………………………….96
Figure 9: ESS Baseline and End scores with Means for Dim Red and Bright Green Light Groups ……………………………………………….97
Figure 10: Sleep Diary Sleep Latency Baseline and End scores with Means for Dim Red and Bright Green Light Groups ………………………98
Figure 11: Sleep Diary WASO Baseline and End scores with Means for Dim Red and Bright Green Light Groups ………………………………..99
Figure 12: Sleep Diary TST Baseline and End scores with Means for Dim Red and Bright Green Light Groups …………………………………..100
Figure 13: Sleep Diary Sleep Efficiency Baseline and End scores with Means for Dim Red and Bright Green Light Groups ……………………..101
Figure 14: Actigraphic Total Sleep Time Baseline and End scores with Means for Dim Red and Bright Green Light Groups ……………………..102
ix
Figure 15: Actigraphic WASO Baseline and End scores with Means for Dim Red and Bright Green Light Groups ………………………………103
Figure 16: Actigraphic Sleep Efficiency Baseline and End scores with Means for Dim Red and Bright Green Light Groups ……………………...104
Figure 17: Actigraphic Awakenings Baseline and End scores with Means for Dim Red and Bright Green Light Groups ……………………...105
Figure 18: Actigraphic Sleep Latency Baseline and End scores with Means for Dim Red and Bright Green Light Groups ……………………..106
Figure 19: Actigraphic Before and After Treatment Bedtimes, Wake Times and Acrophases for Green and Red Light Groups ……………….107
x
ACKNOWLEDGEMENT
I would like to acknowledge Dr. Daniel Kripke MD for his work as mentor, advisor, and committee chair. His dedication to my education and professional guidance have been invaluable.
I would also like to acknowledge the generous support of the other members of the committee, Dr. Linda Gallo PhD and Dr. Claire Murphy PhD, and especially Dr. Sean P. A. Drummond PhD and Dr. Sonia AncoliIsrael PhD for their mentorship.
The faculty and staff associated with the Human Circadian Pacemaker Lab have also assisted in countless ways throughout my tenure in the Joint Doctoral Program. I would especially like to acknowledge Kathy Rex MS, Dr. Richard Loving DNSc, Dr. Jeffrey Elliot PhD, Dr. Shawn Youngstedt PhD, Dr. Roger Cole PhD, Nancy Knickerbocker, Charles Im, and Sue Lawton.
Others who have made many contributions to my academic and professional development include Dr. Jose Loredo MD, Dr. William Perry PhD, Dr. Vanessa Malcarne PhD, Dr. Scott Rousch PhD, Dr. Z Kripke MD,
xi
Dr. Leeza Maron PhD, and especially Dr. Michael Perlis PhD and Dr. Donna Giles PhD.
Also, I would like to acknowledge the contributions of Travis Turner MS, Xavier Cagigas MS, Sara Schild MS, Henry Orff MS, Kate Possin MS, Shamini Jain MS, Jorge Ramirez-Cabrera, and especially Ana Liza Casillas.
Finally, I would like to acknowledge my family for being so supportive.
xii
VITA
Education
2007
Doctor of Philosophy, San Diego State University & University of California, San Diego, Joint Doctoral Program in Clinical Psychology, Behavioral Medicine Track
2007
Clinical Psychology Internship , University of California, San Diego & San Diego VA Healthcare System
2005
Master of Science, San Diego State University & University of California, San Diego
2001
Bachelor of Arts, University of Rochester, Clinical and Social Sciences in Psychology, Concentration in Brain and Cognitive Science, Cum Laude, High Honors for Research in Psychology
xiii
Research Experience 2001-2006
Graduate Research Assistant to Daniel F. Kripke MD Circadian Pacemaker Laboratory Department of Psychiatry University of California, San Diego
2003-2006
Research Assistant to Sonia Ancoli-Israel PhD J. Christian Gillin Sleep Research Laboratory Department of Psychiatry VA San Diego Healthcare System University of California, San Diego
2000-2001
Research Assistant to Donna Giles PhD Depression Research Laboratory Department of Psychiatry University Medical Center University of Rochester
2000-2001
Research Assistant to Michael L. Perlis PhD Sleep and Neurophysiology Research Laboratory Department of Psychiatry University Medical Center University of Rochester
xiv
Clinical Experience 2006-2007
Behavioral Medicine Psychology Intern San Diego Veteran’s Affairs Health System Supervisor: Julie Wetherell PhD
2006-2007
Psychology Intern Outpatient Psychiatric Services (Gifford Clinic) University of California, San Diego Supervisor: Giovanna Zerbi PhD
2004-2005
San Diego Veteran’s Affairs Health System & University Medical Center University of California, San Diego Supervisors: Sonia Ancoli-Israel PhD & Jose Loredo MD
2003-2004
Inpatient Psychiatry Practicum Student Neurobehavioral Medicine Unit University Medical Center University of California, San Diego Supervisors: William Perry, PhD, Leeza Maron PhD & Steven Hickman PsyD
2002-2003
Student Therapist Psychology Clinic
xv
San Diego State University Supervisors: Brenda Johnson PhD & Bina Parekh PhD
Teaching Experience 2005-2006
Instructor PSY 270: Statistical Methods in Psychology San Diego State University
2004
Invited Group Therapy Trainer Neurobehavioral Medicine Unit University of California, San Diego
2000-2001
Psychology Tutor University Tutoring Program University of Rochester
2000
Teaching Assistant CSP 260: Sleep Research and Sleep Medicine University of Rochester
Honors and Awards 2006
SDSU Department of Psychology Outstanding Doctoral Teaching Award
2005
Outstanding Professor Award from AXL, SDSU chapter
xvi
2004
Research on long sleep highlighted in over 200 national and international news publications and television shows, including all major American news outlets
2001
Cum Laude from University of Rochester
2001
High Honors for Psychology Research from University of Rochester
2000
Sleep Research Society Travel Award
2000-2001
Rochester Psychology Honors Program (one of nine students)
1997-2001
Dean’s List, University of Rochester College of Arts and Sciences (All semesters)
1997-2001
Meliora Grant
1997-2001
Rush Rhees Scholarship
Peer-Reviewed Publications
Grandner, M. A. and Drummond, S. P. A. (In Press). Who are the long sleepers? Towards an understanding of the mortality relationship. Sleep Medicine Reviews.
xvii
Grandner, M. A., Kripke, D. F., Youngstedt, S. D., and Langer, R. D. (2006). Light exposure is related to social and emotional functioning and quality of life in older women. Psychiatry Research, 143:35-42.
Grandner, M. A., Kripke, D. F., Yoon, I. Y., and Youngstedt, S. D. (2006). Criterion Validity of the Pittsburgh Sleep Quality Index: Investigation in a non-clinical sample. Sleep and Biological Rhythms, 4:129-136.
Loving, R. T., Kripke, D. F., Elliott, J. A., Knickerbocker, N. C., and Grandner, M.A. (2005). Bright light treatment of depression for older adults. BMC Psychiatry, 5:41.
Loving, R. T., Kripke, D. F., Elliott, J. A., Knickerbocker, N. C., and Grandner, M.A. (2005). Bright green light treatment of depression for older adults. BMC Psychiatry, 5:42.
Pandey, J., Grandner, M., Crittenden, C., Smith, M.T., and Perlis, M.L. (2005). Meteorologic factors and subjective sleep continuity: A preliminary evaluation. International Journal of Biometeorology, 49:152-155.
xviii
Grandner, M.A. and Kripke, D.F. (2004). Self-reported sleep complaints with long and short sleep: A nationally representative sample. Psychosomatic Medicine, 66:239-41.
Submitted Publications
Grandner, M. A., Giles, D. E., Duberstien P., and Useda J. D. REM latency as a predictor of personality factors in major depression. Submitted for publication.
Published Abstracts
Grandner, M. A., Kripke, D. F., and Rex, K. (2006). Effects of a green light mask worn at night. Sleep, 29 (Supp): A63.
Grandner, M. A., Kripke, D. F., and Langer, R. D. (2005). Correlations among dietary nutrient variables and subjective and objective sleep. Sleep, 28 (S2): A148-A149.
Loving, R. T., Kripke, D. F., Elliott, J. A., Knickerbocker, N. C., and Grandner, M.A. (2005). Bright light treatment of depression for older
xix
adults. Society for Light Treatment and Biological Rhythms Program and Abstracts, 17:35.
Loving, R. T., Kripke, D. F., Elliott, J. A., Knickerbocker, N. C., and Grandner, M.A. (2005). Bright green light treatment of depression for older adults. Society for Light Treatment and Biological Rhythms Program and Abstracts, 17:35.
Grandner, M., Kripke, D., Youngstedt, S., and Langer, R. (2004). Light exposure, social and emotional functioning, and quality of life in postmenopausal women. Society for Light Treatment and Biological Rhythms Program and Abstracts, 16.
Grandner, M. A., and Kripke, D.F. (2003). Validity of the Pittsburgh Sleep Quality Index: Subjective sleep, objective sleep and depression. Sleep, 26, (S2).
Grandner, M. A., and Kripke, D.F. (2002). Self-reported sleep problems in short and long sleepers. Sleep, 25, (S2).
xx
Pandey, J., Ilniczky, N., Grandner, M. A., Lowell, A., Smith, M. T., Giles, D. E., and Perlis, M. L. (2001). Meteorological factors and subjective sleep continuity: a replication and extension. Sleep,24, (S2).
Grandner, M. A., Pandey, J., Smith, M.T., Giles, D.E., & Perlis, M.L. (2000). Evoked EEG activity in patients with insomnia and good sleeper controls. Sleep,23, (S2), 318-319.
Pandey, J., Grandner, M. A., Crittenden, C.N., Smith, M.T., Giles, D.E., & Perlis, ML. (2000). Meteorological factors and subjective sleep continuity. Sleep,23, (S2), 225.
Professional Presentations
Grandner, M. A., Kripke, D. F., and Rex, K. (2006, June). Effects of a green light mask worn at night. Poster presented at the meeting of the Associated Professional Sleep Societies, Salt Lake City, UT.
Grandner, M. A., Kripke, D. F., and Langer, R. D. (2005, June). Correlations among dietary nutrient variables and subjective and objective sleep. Poster presented at the meeting of the Associated Professional Sleep Societies, Denver, CO.
xxi
Grandner, M., Kripke, D., Youngstedt, S., and Langer, R. (2004, June). Light exposure, social and emotional functioning, and quality of life in postmenopausal women. Poster presented at the meeting of the Society for Light Treatment and Biological Rhythms, Toronto, ON, Canada.
Grandner, M. A., and Kripke, D.F. (2003, June). Validity of the Pittsburgh Sleep Quality Index: Subjective sleep, objective sleep and depression. Poster presented at the meeting of the Associated Professional Sleep Societies, Seattle, WA.
Grandner, M. A., and Kripke, D.F. (2002, June). Self-reported sleep problems in short and long sleepers. Poster presented at the meeting of the Associated Professional Sleep Societies, Chicago, IL.
Grandner, M. A., Pandey, J., Smith, M.T., Giles, D.E., & Perlis, M.L. (2000, June). Evoked EEG activity in patients with insomnia and good sleeper controls. Poster presented at the meeting of the Associated Professional Sleep Societies, Las Vegas, NV.
xxii
ABSTRACT OF THE DISSERTATION Sleep, Mood, and Circadian Responses to Bright Green Light During Sleep
by
Michael Andrew Grandner Doctor of Philosophy in Clinical Psychology
University of California, San Diego, 2007 San Diego State University, 2007
Dr. Daniel Kripke, Chair
Based on human and animal research, it appears that light administered in the last two hours of sleep might be particularly effective as an antidepressant and in advancing circadian rhythms. Green light might be more effective than white light. An obvious advantage of light treatment during sleep is that disturbance and time cost during waking hours might be avoided. For these reasons, we decided to explore effects of a light
xxiii
treatment with a green light mask used for in the last hours of sleep. Subjects were 30 adults aged 18-35 years. This protocol took take place at the subjects’ homes and lasted 15 days after recruitment (3-day baseline period and 12-day intervention period). Throughout the study, participants maintained sleep and compliance diaries and wore a wrist actigraph. The study was a randomized, controlled clinical trial of a bright green light mask versus a dim red light mask. The two treatments were a bright green light and dim red light. Post-treatment interviews showed that all subjects reported some discomfort from the masks, but compliance was good overall. Symptom inventory scores did not differentiate groups, suggesting no significant differences in side effects. Mood ratings and sleep questionnaires did not differentiate groups. Sleep diaries distinguished groups, suggesting worse sleep overall in the green mask group. Actigraphy showed a significant circadian phase advance in the green light group. This suggests that the green light had a physiological effect. These findings suggest that green light masks are safe and tolerable; while the green light mask worsened perceived sleep overall, no specific factors were implicated and such complaints may simply be due to earlier awakening caused by a phase advance. Also, early morning green light presented during sleep produced a significant phase shift, suggesting that while there were no symptom benefits evidenced in this healthy sample, green light masks may be useful in clinical and research applications (e.g.,
xxiv
mood disorders, endocrine functioning, delayed sleep phase syndrome) where circadian phase shifts have resulted in positive outcomes.
xxv
INTRODUCTION
The Value of Bright Light Stimulation
The human species is thought to have developed and adapted primarily to bright, unforested climates without excessive cloud cover. Our ancestry probably adapted to daytime light between 500 and 10,000 lux (Kripke & Youngstedt, 1996). Lux is a standard unit of illumination, equal to one lumen (a physical term to describe amount of light) per square meter. To put lux values in context, graphical approximations of various light stimuli and their lux values (Jean-Louis, Kripke, Ancoli-Israel, Klauber & Sepulveda, 2000a; Kripke & Youngstedt, 1996) are shown in Figure 1.
In modern times, we have spent more of our days indoors out of the sun and more of our nights in lighted rooms. This change in behavior has led us to experience less illumination than in the past. The physiological and psychological consequences of these changing amounts of illumination, as well as the effect of the great diversity of light exposures in different populations, may be important in understanding health (Kripke & Youngstedt, 1996).
1
2
Light in the General Population. The role of light in health and physiological functioning may be most salient to people with overt, clinical conditions directly related to light. However, the role of light in the lives and health of the general population is also relevant. While we, as a society, are currently exposed to a wide range of light values over the course of a day or over a year, it is clear that humans do not experience the same patterns of natural light exposure as our ancestors. In one of the earliest attempts to objectively describe illumination patterns in a modern population sample, it was reported that, in San Diego, CA, people were exposed to surprisingly little bright light. Whereas the subject with the most light exposure spent the entire day outdoors in clear, sunny weather and was exposed to a 10,000 lux average per hour across 24 hours, the median population sample light exposure was just 297 lux in an average hour. Only 13.2% of the 24-hour day was spent in illumination greater than 100 lux, a minimum recommended level of office lighting. Depressive symptoms were negatively correlated with light exposure, regardless of time of year (Jean-Louis et al., 2000a; Kripke & Youngstedt, 1996). Thus, even in a climate with as much light as that in San Diego, the population does not receive much light exposure.
An additional investigation examined light exposure in a diverse sample of women ranging from ages 19 to 81 years (Jean-Louis, Kripke,
3
Ancoli-Israel, Klauber, Sepulveda, Mowen, Assmus & Langer, 2000b). This study showed no significant effect of age upon amount or timing of light exposure, although the authors note that the older women in the sample were active and healthy, thus perhaps nonrepresentative. Thus, even in a region as bright as San Diego, CA, most people do not receive much bright light, and this pattern holds across age and ethnic lines. Unfortunately, in regions with even less natural bright light, the amount of light exposure is likely decreased, increasing the risk that individuals are not receiving enough light for normal physiological functioning.
Seasonal Variation. It has been suggested that the amount of light experienced by a percent of the population may be insufficient for proper entrainment and maintenance of circadian rhythms and mood. (Cole et al., 1995; Hébert et al., 1998; Jean-Louis et al., 2000b). Local climate may also play a role. When seasonal changes in light exposure were compared in San Diego, CA to Rochester, MN, researchers found that those in colder climates receive even less light. In the summer, San Diegans spent less time exposed to bright light over 1,000 lux (median of 2 hours and 10 minutes) than those living in Rochester (median 2 hours and 23 minutes), at a higher latitude with longer days. However, in the winter, amount of time of exposure to light over 1,000 lux was greater in San Diego (median 1 hour and 20 minutes) than in Rochester (median 23 minutes) (Cole,
4
Kripke, Wisbey, Mason, Gruen, Hauri & Juarez, 1995). These results could be due in part to the cold (staying indoors) or latitude (less sunlight during winter).
Values similar to those found in Rochester were also found in Montreal, Canada, where researchers investigated daily light in winter as compared to summer (Hébert, Dumont & Paquet, 1998). There was no difference between seasons in time spent in environments of less than 1,000 lux. However, subjects spent an average of 2.6 hours in bright light environments (over 1,000 lux, presumably outdoor daylight) in the summer but only 0.4 hours in the winter. At almost all time points in the day, there was significantly more time spent in bright light environments in summer than winter. Over 50% of time awake was spent in environments under 100 lux in both seasons. Thus, the general population is receiving very little light overall, and this may be impairing health (described later); also, conditions involving sensitivity to lack of sufficient light at proper times (described later), may be exacerbated by this phenomenon.
Circadian Rhythms. Understanding of the relationship between light and physiology, behavior and mood involves the understanding of circadian rhythms, which are physiological cycles that fluctuate across a time period of approximately 24 hours. Unlike some geophysical rhythms in
5
nature, human endogenous circadian rhythms are imprecise (e.g., Hallonquist, Goldberg & Brandes, 1986; Wehr & Goodwin, 1981) and are constantly being modified and reset to adapt to our environment. Cues, called zeitgebers (German for “time givers”), are gathered from the environment and help reset our internal clocks. One of the strongest zeitgebers is light.
Human circadian rhythms govern a wide range of functions, including components of the sleep/wake cycle and the endocrine system (e.g., Kryger, Roth & Dement, 2000; Hallonquist et al., 1986; Wehr & Goodwin, 1981). Circadian rhythms are actively generated and maintained by the organism, not passively controlled by environmental factors. In fact, foundational studies (e.g., Wever, 1979) demonstrated an intrinsic clock that cycled with a period slightly longer than 24 hours. Thus, in order to maintain a 24-hour day, our clocks need continual resetting.
The process of using zeitgebers to tell the time of day and adjust physiological properties accordingly is referred to as “entrainment” (Wever, 1979). Entrainment can be modified, however. For example, a pulse of light early in the day will shift a rhythm earlier in time (phase advance) while a light pulse late in the evening will shift a rhythm later in time (phase delay).
6
Circadian rhythms operate within an environment of zeitgebers, but are also based on endogenous rhythms, when independent of external time cues. Understanding of these “free-running” rhythms facilitates understanding of the physiological components of circadian rhythms and the processes they govern. To fully understand free running circadian rhythms, subjects are placed in an isolated environment supposedly devoid of zeitgebers. An important early finding in studies of free-running rhythms was that the usually-coinciding sleep/wake and temperature rhythms began to desynchronize in some subjects. This desynchronization was associated with reports of “neuroticism” and “stress” (Wever, 1979, p. 246).
This finding was continually replicated and eventually provided the background for the development of a “dual oscillator model” that is thought to exert the majority of control in human circadian rhythms (e.g., Czeisler & Wright, 1999; Hallonquist et al., 1986; Wehr & Goodwin, 1981). These two theorized oscillators are thought to be designed to act independently and harmoniously, but can become desynchronized through problems with circadian entrainment. This desynchronization may lead to the experience of various psychological and somatic problems. Further theories by Borbely and colleagues (Borbely, 1982; Daan, Beersma & Borbely, 1984;), which have been elaborated by others (Achermann, Dijk, Brunner & Borbély, 1993; Beersma, 1998; Borbely & Achermann, 1992; Benington & Heller,
7
1994; 1995; Dijk & Czeisler, 1995), have tended to emphasize a singleoscillator model, with sleep-wake regarded as a homeostatic process, somewhat less periodic than an oscillator. In the context of these theories, light might advance the circadian oscillator, which might alter its phaseangle relationship to sleep, or advance in the circadian oscillator might also advance sleep, or both.
Another dual oscillator model was developed by Pittendrigh and Daan (Daan & Pittendrigh, 1976a; 1976b; Pittendrigh & Daan, 1976a; 1976b; 1976c) and elaborated by others (e.g., Daan, Albrecht, van der Horst, Illnerova, Roenneberg, Wehr & Schwartz, 2001; Illnerova, Sumova, Travnickova, Jac & Jelnikova, 2000). According to this theory, the circadian oscillator has two coupled components, a morning and an evening component, which may shift their phase-angles in response to photoperiod. This is independent of the sleep-wake process, which then becomes a third process. The change in the phase-angle between evening and morning oscillators controls the duration of melatonin secretion (Elliott and Tamarkin, 1994), which in turn controls seasonal responses in hamsters, sheep, and other experimental animals. This approach has been supported by a number of studies of light treatment (Tuunainnen et al., 2004), which suggest a photoperiodic model of mood disturbance. Light treatment
8
devices (such as light boxes or masks) might have photoperiodic effects, leading to mood alteration.
With respect to affective disorders such as depression, there are two primary circadian rhythm abnormalities that have been theorized. The first type is where one endogenous rhythm becomes separated from others with which it is usually entrained, whether as a result of a phase-angle change in the rhythm or a true free-running component that operates independently of entrainment. Second, abnormalities in the relationships between phases of various rhythms and the environment can occur (such as in the case of jet-lag). Both of these situations might result in mood disturbance (e.g., Hallonquist et al., 1986).
Thus, mood response may, in part, be related to light exposure patterns. These patterns of light exposure, and how they affect mood, depend on their timing along the circadian day. Light exposure at different times of day results in different circadian rhythm changes or “phase shifts,” thus called because they horizontally shift the cyclical curve forward or backward in time, based on the timing of the light stimulus.
Phase Response Curves. Phase Response Curves (PRCs) were developed to describe the effects of timing of phase shifting stimuli. They
9
evolved as a way to quantify and describe circadian phase shifts. A single pulse of light can reset circadian phase (Pittendrigh & Bruce, 1957). The magnitude and direction of these shifts depend on the intensity and duration of light (plotted as a Dose Response Curve, or DRC) and on the circadian timing of the light (plotted as a PRC) (Pittendrigh & Bruce, 1957). For example, a PRC would plot the relationship between light pulse and amount of circadian shift, relative to time. Knowledge of PRCs is useful in the understanding of shifting a circadian phase back (advance) or forward (delay) in time. Thus, the PRC for light demonstrated that the timing of light is of critical importance in producing an effect. Light administered late in the day or in the evening may delay the PRC, while light administered in the early morning (or even just prior to waking) will advance the PRC. A full review or PRCs is outside the scope of this paper; however, further discussion of the development and utilization of PRCs in various applications is reported by Czeisler (1995) and Johnson (1992).
Thus, light plays a very important role in health and functioning in the general population, as well as in individuals with disruptions of circadian rhythms. To understand the role of and effects of light on health parameters, the scientific community has developed methods of investigating endogenous, free-running rhythms, as well as PRCs to quantify the relationship between timing of light (or other phase-shifting
10
stimulus) and its effect. While there is still much to be learned about the physiological components of the circadian system, there has already been a great deal of investigation in this area.
Physiology of Light
The mechanisms of action of light involve alteration of underlying physiological rhythms. Current research in the physiological aspects of circadian rhythms has focused on three main areas: the circadian visual system (CVS), the structure and function of the suprachiasmatic nucleus (SCN), and the SCN-efferent neural pathways (Miller, Morin, Schwartz & Moore, 1996).
Early studies (and recent investigations such as Lee, Nelms, Nguyen, Silver & Lehman, 2003) demonstrated that eyes are the necessary conduits for light to entrain circadian rhythms (Miller et al., 1996), and ablation of all central retinal projections posterior to the optic chiasm produced behavioral blindness, yet photoperiodic behavior remained. This led to the discovery of a separate, direct retinalhypothalamic tract (RHT) that is necessary and sufficient for entrainment (Miller et al., 1996).
11
At the retina, melanopsin-containing retinal ganglion cells are the primary sensory mechanisms of entrainment and may operate independently of rods and cones (Berson, Dunn & Takao, 2002; Hattar, Liao, Takao, Berson & Yau, 2002; Thapan, Arendt & Skene, 2001), though there is some evidence that they are not entirely independent (Panda, Provencio, Tu, Pires, Rollag, Castrucci, Pletcher, Sato, Wiltshire, Andahazy, Kay, Van Gelder & Hogenesch, 2003). When wavelengths of 420 nm (violet-blue) to 600 nm (yellow-orange) were evaluated, the range of 446 nm to 477 nm was the most effective for melatonin suppression, suggesting that a photopigment most associated with circadian entrainment may not be exclusively related to the rods and cones (Brainard et al., 2001a; 2001b). The photopigment used for entrainment may include melanopsin (Hattar et al., 2002).
Melanopsin-producing retinal ganglion cells supply the axons which synapse on the SCN or other hypothalamic structures, as well as the intergeniculate leaflet (IGL). The RHT-IGL pathway projects, through the geniculohypothalamic tract (GHT), as well as the contralateral IGL, to the SCN. The IGL may have specific functions related to reentrainment, response to a long-lasting light stimulus, and length of circadian phase. In addition to the RHT and IGL/GHT inputs to the SCN, information also
12
arrives via serotonergic neurons from the midbrain (Miller et al., 1996; Morin, 1994).
It remains somewhat unclear to what extent the serotonin signal is modulated by light and to what extent by the sleep/wake cycle. An important role of serotonin 5-HT(7) receptors is presynaptic inhibition of RHT inputs to the SCN (Ehlen, Grossman & Glass, 2001). Therefore, since serotonin is augmented during wakefulness, wakefulness may reduce the strength of RHT stimulation of the SCN. Conversely, light stimuli to the eyes during sleep might be particularly efficient.
In the hamster, the SCN relays its timekeeping information to the rest of the body via a number of primary projections, including projections to the anterior paraventricular thalamus, ventral lateral septum and bed nucleus of the stria terminalis, hypothalamic paraventricular nucleus, medial hypothalamus, IGL, posterior paraventricular thalamus, precommisural nucleus, and olivary pretectal nucleus (Miller et al., 1996). This may be generalizable to other mammals.
An investigation of the role of glial cells in the functioning of the SCN was pursued by Prosser, Edgar, Heller & Miller (1994). This group
13
demonstrated that disruption of glial metabolism resulted in shortened rhythms.
Recent research has investigated the circadian rhythms of ocular mechanisms. Loving, Kripke and Glazner (1996) did not find any circadian rhythmicity in the physiological apparatus of the pupil and eyelid. More recent investigation of the retina (Tuunainen, Kripke, Cress & Youngstedt, 2001) has elucidated rhythmicity based on electrooculography (EOG), electroretinography (ERG) and visual detection threshold (VTH), but large confidence intervals (data were based on only 12 subjects) complicated interpretation of these data. Additionally, these retinal rhythms were less consistent than the recorded temperature rhythm. However, other animal findings suggest that profound circadian rhythms exist in retinal function and demonstrate that the retinae are independent circadian oscillators (Tosini & Menaker, 1996). These studies suggest that the retinae are likely to be especially sensitive at the end of darkness, which, in humans, is the end of sleep. This may result in an interaction with the circadian rhythms of the SCN and other physiological structures, producing a uniquely effective time window for light treatment.
A review of a number of other non-SCN considerations for detecting, measuring, understanding, and altering circadian rhythms was reviewed by
14
Mrosovsky (2003), including considerations of species-wide changes from being active during the day to being nocturnal, changing patterns in the absence of changed SCN, and other non-zeitgeber environmental influences on rhythmicity. The paper concludes, “The allure of deciphering the clockwork, the charisma of the central pacemakers, has resulted in neglect of powerful downstream mechanisms that might – for all we know – be just as natural and healthy to make use of as large and repeated clock resetting (Mrosovsky, p.5).”
Thus, much is known about the neural pathways involved in the transduction of light from the eyes to the brain, and how that information is passed through networks in the nervous system. These neurological systems are responsible for a number of physiological and psychological effects.
Light: Physiological and Psychological Effects
Biological Effects of Light. An adequate review of biological effects of light is beyond the scope of this paper. Hollwich (1979) provided a rather complete review of physiological properties of light (perceived through the eyes) across species, with specific discussion of the optic nerve, the pineal gland, growth, temperature, renal function, blood,
15
metabolism, thyroid, sexual function, adrenal function, pituitary function, and the specific issues surrounding light pollution and the differences between natural and artificial light. To summarize, Hollwich noted that the “improvement” seen in formerly blind patients that have regained the perception of light through their eyes may largely be due to more than the regaining of visual representations of the external world; these changes may be more the result of “extravisual photostimuli” that can now be perceived.
A shorter, though more recent, review of the physiological effects of light is reported by Brainard, Hanifin, Hannon, Gibson, French and Rollag (1996), specifically focusing on arousal and activity rhythms rather than sleep/wake or other circadian systems. Additionally, McColl and Veitch (2001) summarize the physiological effects of “full-spectrum fluorescent lighting.” They describe possible benefits of fluorescent lighting in Vitamin D metabolism and resultant calcium absorption and note that although there may be a beneficial increase in calcium absorption, this did not translate to increased dental health. Additionally, the authors note a possible cancer risk from the minimal ultraviolet emissions from "fullspectrum” lighting (regular fluorescent lighting does not contain as much ultraviolet light). Other considerations of physical health, neurological functioning, arousal, stress, activity, and mood disorders (with light
16
therapy) are discussed, as well as the confounds of studying light (e.g., light intensity, daylight, flicker).
The Mind’s Eye: Shedding Light in Dark Places. In addition to physiological effects, a purely psychological component of light treatment is plausible. Schultz-Ross and Jenkins (1994) reiterate that antidepressant effects of light may have an important psychological component. Light may cause biological changes that are psychologically interpreted. Light may even cause simultaneous physiological and psychological responses that overlap and interact, producing the evidenced benefit. In addition to these effects, much scientific attention has been devoted to the relationships between light exposure and affective disorders.
Light Treatment of Affective Disorders
In addition to its numerous other effects, the relationship between light exposure and mood has been examined in great detail in animals and humans. The seasonal variations in physiology and behavior evidenced in a wide range of mammals, especially several breeds of hamsters, have provided the basis for conceptualizing the relationship between seasonal light change and depression (Kripke, 1985). Much research has focused on
17
the specific cellular and molecular processes of rodent photoperiodism (Oster, Maronde & Albrecht, 2002).
Hamsters demonstrate a critical time interval during the “dark” period in which light exposure will stimulate and enhance gonadal development, and absence of light will result in gonadal regression (Goldman, 2001). During (long) winter nights, these hamsters will not be exposed to light during this critical period, but they will as the days become longer. This seasonal change in light exposure has a direct influence on reproductive and nonreproductive behaviors. A similar critical period in humans, dependent on seasonal light variation, may be implied in human affective disorder (Kripke, 1984).
As described earlier, there are numerous hypotheses regarding the processes by which light received through the eyes affects the circadian system which regulates a wide range of biological rhythms, and that disruption of these circadian rhythms, or other circadian abnormalities, can directly and indirectly lead to a depressed state in humans (Healy & Williams, 1988; Kripke et al., 1992a; Neumeister, Stastny, PraschakRieder, 1999). Also, a sustained pulse of artificial bright light will alter these rhythms. With these in mind, the idea of bright light therapy has developed as an antidepressant treatment.
18
Light Treatment for Nonseasonal Depression. The beneficial effects of bright light treatment for depression were reported prior to specific interest in seasonal or winter depression (Kripke, 1998a; 1998b). The earliest controlled trial of bright light as antidepressant (Kripke, 1981) reported significant reduction in depressive symptoms within one day following 1 hour of bright light. Soon afterwards, these results were replicated in subsequent studies (Kripke, Risch & Janowsky, 1983a; 1983b). Later studies found increased benefit in 5-day (Kripke, Gillin, Mullaney, Risch & Janowsky, 1987) and 1-week (Kripke, Mullaney, Klauber, Risch & Gillin, 1992b) trials. A large number of other studies have shown benefit in nonseasonal depression (Kripke, 1998b). Even the more modest of benefits reported are still greater than those reported for other therapies in similar time periods, and even demonstrated additive effects when combined with antidepressant medications (Kripke, 1998a; 1998b; Neumeister et al., 1999; Tuunainnen, Kripke & Endo, 2004).
There is still much discussion and debate of the role of circadian rhythms in affective disorders, especially nonseasonal depression (Gordijn, Beersma, Korte, Rutger & van den Hoofdakker, 1998; Healy & Waterhouse, 1995; van den Hoofdakker, 1994; Wirz-Justice, 1995). However, enough evidence exists to recommend bright light therapy for the
19
treatment of affective disorders irrespective of their seasonality (Kripke, 1998b). Additionally, light therapy in addition to antidepressant medication, psychotherapy or other treatments may also be warranted (Kripke, 1998a; 1998b).
A recent, comprehensive review of 20 separate studies of light treatment for nonseasonal depression (Tuunainen et al., 2004) found that light, especially administered during the first week of treatment, in the morning hours, and/or as an adjunct to wake therapy (antidepressant sleep deprivation), is an effective treatment for depression.
Treatment of SAD Using Bright Light. SAD received its initial introduction in 1984 (Rosenthal, Sack, Gillin, Lewy, Goodwin, Davenport, Mueller, Newsome & Wehr, 1984). Since that time, a great deal of research has investigated the characteristics and mechanisms of the disorder. Neurophysiological findings in SAD have been previously summarized (Skwerer, Jacobsen, Duncan, Kelly, Sack, Tamarkin, Gaist, Kasper & Rosenthal, 1988). Several of these findings include differences in norepinepherine, prolactin, melatonin, cortisol, mitogens, sleep (REM and NREM), and metabolic rate, and syndrome-specific responses to light of norepinepherine, melatonin, cortisol, L-tryptophan, thyroid stimulating hormone, mitogens, sleep, and the P300 component of event-related
20
potentials. More recent findings suggest that serotonin may play a major role in the regulation of circadian rhythms in the SCN and may be vital in the pathogenesis of SAD (Neumeister et al., 1999).
Michalak, Wilkinson, Hood & Dowrick (2002) recently investigated the differences between SAD and nonseasonal depression. They had found that patients with SAD had less cognitive and functional impairment and required less psychiatric treatment than nonseasonal patients. Additionally, symptomatic hopelessness and weight loss were found to be predictive of nonseasonal depression versus SAD.
SAD has been investigated in many areas of the world, including Alaska (Booker & Hellekson, 1992), Canada (Lam & Levitt, 1999), India (Avashthi, Sharma, Gupta, Kulhara, Varma, Malhotra & Mattoo, 2001), Australia, Japan, and a host of other locales (Wirz-Justice, 1993).
SAD is currently being investigated in many domains. For example, current findings suggest that winter depressives demonstrate seasonal variations in retinal sensitivity (Hébert, Dumont & Lachapelle, 2002). Also, light therapy has been investigated in seasonal minor depression (Levitt, Lam & Levitan, 2002; Neumeister et al., 1999). With regard to specific environmental variables, some recent research has related seasonal
21
depressive episodes to patterns in solar irradiation (Summers & Shur, 1992; Young, Meaden, Fogg, Cherin & Eastman, 1997), hours of sunshine and mean temperature (Young et al., 1997).
Much attention has focused on the use of bright light to treat winter depression, also called seasonal depression or seasonal affective disorder (SAD). SAD is subsumed under the DSM IV-TR diagnosis of Major Depressive Disorder, with Seasonal Pattern (APA, 2000) and ICD-10 diagnosis for Seasonal Depressive Disorder. A great deal of research, however, has investigated this disorder and its treatment with bright light.
Some degree of discrepancy exists between existing accepted definitions of diagnostic criteria for SAD, based largely on differing definitions of the disorder (Lam & Levitt, 1999). A common pattern exists however, with primary criteria being recurrent depressive episodes that coincide with time of year (usually in winter). Inversely, the rest of the year should be marked by the lack of depressive symptoms. Also, diagnosis of SAD usually requires that the seasonal pattern not be caused by seasonal variation in psychosocial stressors. Consistent with the theoretical models for seasonal variation, patients with SAD often report hypersomnia, hyperphagia, weight gain, and carbohydrate craving.
22
An early hypothesis regarding the pathophysiology of SAD involved an abnormal melatonin rhythm (Lam & Levittan, 2000; Wirz-Justice, 1993). However, winter recordings of melatonin rhythm were not significantly different in SAD patients and controls, and melatonin suppression using light is not sufficient for a therapeutic effect. Although melatonin supplementation as a treatment for SAD has shown mixed results, a recent study documenting benefits of melatonin in the treatment of SAD suggests that the use of phase-stimulating agents, such as melatonin, hold promise (Lewy, Lefler, Emens, & Bauer, 2006).
The relationship between melatonin and SAD has more recently been shown to involve more complex photoperiodic properties of melatonin (Isaacs, Stainer, Sansky, Moor & Thompson, 1988; Lam & Levitan, 2000). For example, patients with SAD may be more responsive to seasonal photoperiodic signals, and melatonin may play a large role in the vegetative symptoms of SAD (Wehr, Duncan, Sher, Aeschbach, Schwartz, Turner, Postolache & Rosenthal, 2001). Various neurotransmitter systems have also been implicated in SAD, including serotonin, norepinepherine and dopamine. Also, there is recent evidence for genetic contributions to SAD from population and twin studies (Lam & Levitan, 2000).
23
Placebo-controlled investigation of bright light in SAD continues (Eastman, Young, Fogg, Liu & Meaden, 1998) and alternative treatments for SAD have been explored. Demonstrating promising results for treatment of SAD are the dawn simulator (Avery, Bolte, Cohen & Millet, 1992), negative ionizer (Terman & Terman, 1995), selective serotonin reuptake inhibitors (Thorell, Kjellman, Arned, Lindwall-Sundel, Walinder & Wetterberg, 1999), and ‘natural’ light (Wirz-Justice, Graw, Kräuchi, Sarrafzadeh, English, Arendt & Sand, 1996). Less promising results are reported for Ginkgo biloba (Lingjærde, Føreland & Magnusson, 1999).
Bright Light Treatment. Recommended practice parameters for bright light treatment of nonseasonal depression are currently indistinguishable from those for SAD (Kripke, 1998c; Lam & Levitt, 1999). Degree of improvement seems to increase as the amount of light (duration or amount of lux) received is increased. White light intensities below 2,000 lux will probably not be effective, but those above 10,000 may be relatively unsafe (Kripke, 1998c). Effective treatment of lower doses of light (2,000 to 3,000 lux) may require a few hours of daily exposure for beneficial effects to be seen, but less time (15 minutes to 1 hour) with intensities approaching 10,000 lux may also be effective. Thus, lights need to be sufficiently bright, for a sufficient amount of time to be effective, but light that is too bright might be sub-optimal.
24
Various treatments for SAD, including light treatment, have been reviewed in great detail (Lam & Levitt, 1999; Tam, Lam & Levitt, 1995). The Canadian Consensus Guidelines for the Treatment of Seasonal Affective Disorder (Lam & Levitt, 1999) describe the following parameters for the administration of light treatment for SAD: (1) starting “dose” of light should be 10,000 lux for at least 30 minutes per day or 2,500 lux for at least 1-2 hours per day, (2) correct positioning of the light is important – avoid looking directly into the light (to avoid discomfort), (3) use white, fluorescent, non-ultraviolet light; do not use incandescent halogens (LEDs were not specifically mentioned), (4) use light early in the morning, but other times may be acceptable as well (justification described later), (5) response often occurs during 1 week, but may take up to 4, (6) common side effects include headache, eye strain, nausea and agitation, but are generally mild and are ameliorated with reduced dose (discussed in more detail later), (7) no absolute contraindications and virtually no evidence of eye damage from bright light therapy (a case report is described by Gallenga, Lobefalo, Mastropasqua & Liberatoscioli, 1997), (8) patients with ocular risk factors should have opthamological consultation and monitoring, and (9) clinicians should be aware of suicide risk associated with bright light treatment (Praschak-Rieder, Neumeister, Hesselmann, Willeit, Barnas, & Kasper, 1997).
25
Nocturnal Timing of Light Treatment. Recent findings suggest that light presented toward the end of nocturnal sleep may have benefit above presentation at other times of day. Terman, Terman, Lo and Cooper (2001) found that light presented between 7.5 and 11 hours after melatonin onset (with an optimum time of 8.5 hours after) produced the maximum phase shift (approximately 4.75 - 7.25 hours after sleep onset, according to their sample). These findings support research suggesting that dawn simulators – devices specifically designed to provide external light, mimicking the gradual increase of light at dawn – may have a unique effect by presenting light prior to awakening (Avery, Eder, Bolte, Hellekson, Dunner, Vitiello & Prinz, 2001; Terman, Terman, Quitkin, McGrath, Stewart & Rafferty, 1989). The effects of light at natural dawn have been specifically hypothesized to play an important role in human circadian rhythms (Danilenko, WirzJustice, Krauchi, Weber & Terman, 2000). Thus, light presented very early in the morning, even prior to awakening, has been shown to be effective in shifting circadian phase in normal and depressed subjects. In depressed subjects, these early morning phase shifts have been important in the improvement of depressive symptoms.
Bright Light in Nondepressed Samples. Although light has been shown to be beneficial to depressed people, the effects of bright light on
26
those without a mood disorder is unclear. One group recently found that moderately bright light exposure (1,000 lux) for 6 days improved the sleep quality and increased alertness in eight healthy elderly women studied in the fall months (Kohsaka, Fukuda, Honma, Kobayashi, Sakakibara, Koyama, Nakano & Matsubara, 1999). Another group recently reported that bright light administered to 160 healthy office workers during the winter in southern Finland reduced depression, and increased vitality and quality of life (Partonen & Lonnqvist, 2000). Additionally, our group (Grandner, Kripke, Youngstedt & Langer, 2004) found that in a sample of postmenopausal women, greater daily light exposure was associated with better social and emotional functioning, as well as improved quality of life. Other studies however, have not demonstrated benefits of light in healthy people (Genhart, Kelly, Coursey, Datiles & Rosenthal, 1997; Kasper, Rogers, Madden, Joseph-Vanderpool & Rosenthal, 1990).
Thus, bright light treatment has been shown to be an effective treatment for disordered mood, and may also provide benefit to nondepressed people. Additionally, through the manipulation of circadian rhythms by light, numerous other physiological and psychological processes may be affected.
27
Side Effects of Light Treatment. While bright light has been recommended as a treatment in a number of disorders, including depression, advanced and delayed sleep phase syndromes, non-24-hour sleep-wake syndrome, jet lag and shift work (Chesson, Littner, Davila, Anderson, Grigg-Damberger, Hartse, Johnson & Wise, 1999), it is not without side effects (Chesson et al., 1999; Kogan & Guilford, 1998; Remé, Rol, Grothmann, Kaase & Terman, 1996). The most common minor side effects that are reported are eye irritation, sedation, irritability, anxiety, hypomania, headache, nausea, tightness in chest, glare, eye or skin dryness (Chesson et al., 1999; Gallenga et al., 1997; Kogan & Guilford, 1998). These mild side effects are usually reduced or eliminated if the light intensity is reduced.
Additionally, light therapy has been shown to elicit hypomanic symptoms in (non-bipolar) depressed patients (Bauer, Kurtz, Rubin & Marcus, 1994). These feelings and behaviors appear to be mild and not related to the intensity of light, but there have been cases of problematic manic and hypomanic episodes resulting from light treatment (Lam & Levitt, 1999). Bright light has also been shown to trigger periods of severe mania in bipolar patients, especially morning light (Kripke, 1991) Patients with bipolar disorders receiving light therapy should be closely monitored. Finally, a risk of increased suicidal thinking in response to light has been
28
reported (Haffmans et al., 1998), though similar reports with other antidepressant treatments have also been reported (Healy, 2003).
With regard to specific physical properties of lights used in the treatment of SAD, a relatively thorough investigation was undertaken by Remé and colleagues (1996). Specifically, certain fluorescent lamps used in the treatment of SAD may contain dangerous levels of ultraviolet light, as well as a large amount of blue and green light, which has been shown to cause ocular damage in laboratory animals. However, results varied widely depending on which bulb was analyzed, and which light-diffusing screen was placed in front of the bulb, and the sensitivity to light of nocturnal rodents is known to be greater than that of man.
Light Delivery: Light Box and Light Mask
Light Box. Bright light treatments are usually administered with light boxes, although other devices such as visors, masks and dawn simulators have also been used (Kripke & Loving, 2001; Lam & Levitt, 1999; WirzJustice, 1993). Although very few studies have investigated light treatment by means other than light boxes for nonseasonal depression, a recent, comprehensive review suggests that light boxes currently seem more effective than alternatives which have been tested (Tuunainen et al., 2004).
29
Light boxes are commercially available from a wide variety of manufacturers, and can be found in numerous sizes and variations. They usually emit bright white light from fluorescent bulbs, as point sources might cause ocular discomfort or damage. Additionally, being more electrically efficient, fluorescents give off less uncomfortable heat and cost less for the electricity than incandescent bulbs. Also, fluorescent light is easier to diffuse than incandescent. Light Emitting Diodes (LEDs) have recently become increasingly incorporated into light treatment devices. LEDs generate far less heat and require less power than incandescent bulbs.
Although several manufacturers have offered "full spectrum" devices with ultraviolet components in the light spectrum, the lights generally recommended are not “full spectrum” – they do not produce ultraviolet radiation, which has been shown to be related to numerous health risks and has not been shown to be beneficial in altering circadian rhythms. In addition, “full-spectrum” light may contain a significant amount of blue light, which has been shown to result in retinal damage (Algvere, Marshall & Seregard, 2006).
Light Mask. As mentioned previously, other devices, such as visors, masks and dawn simulators have been used (Kripke & Loving, 2001; Lam
30
& Levitt, 1999; Wirz-Justice, 1993). The present study utilized a light mask, with the rationale that light administered during sleep might provide unique advantages over light boxes. While a light box could be set up with a timer, there is no reason to believe that the light will be close to the subject’s eyes or that the subject is even facing the light. Specifically, light masks may increase compliance with light therapy (as the mask is placed in the proper position before bedtime), provide light at a particularly sensitive part of the PRC, direct light directly at the eye to maximize angle of effect, minimize negative side effects of light, such as glare, which occur during treatment and reduce tolerability of effective dosage, and are adjustable in their intensity. Additionally, light masks may be more portable and easy to store, as well as more energy-efficient (by using LEDs). Kripke and colleagues have examined the effect of light masks in three previous studies (Ando, Kripke, Cole & Elliott, 1999; Cole, Smith, Alcala, Elliott, & Kripke, 2002; Riesenberg, Kripke, Elliott & Cole, 2002).
Ando and colleagues (1999) developed a light mask that administered 500 lux of bright light during sleep for the treatment of Delayed Sleep Phase Syndrome (DSPS). This disorder presents with a circadian rhythm disruption such that the endogenous circadian rhythm peaks later than those in the general population. Thus, people with DSPS tend to go to sleep very late, and wake up very late. This rhythm can be
31
advanced to a more socially amenable time through the use of bright light. The study by Ando and colleagues tested a mask in a very small sample (n=5 each in treatment and control group). Although the study reported no significant differences between groups, a slight phase advance in body temperature rhythm and phase delay in melatonin rhythm were evidenced. Additionally, a slight mood improvement was detected.
Subsequent investigation of light masks for treatment of DSPS was pursued by Cole and colleagues (2002). This study used a brighter light than the Ando study (approximately 2700 lux), in a larger sample (n=28 treatment, n=26 control). This study utilized masks of very similar construction to those used in the present study, but employing white-light LEDs. Masks were programmed to turn on 4 hours prior to regular waking time, ramp up slowly for 1 hour, and remain at full intensity until the subjects woke up. This study found a significant advance of melatonin acrophase. Specifically, in subjects whose baseline median acrophase was earlier than 0602 hours, there was a 98 minute acrophase advance (versus 29 minutes control), and an 81 minute bedtime advance (versus 18 minute control). This suggests that light via mask could be sufficient to produce a significant biological effect.
32
Green light masks have been used in one previous study (Riesenberg et al., 2003) demonstrating their efficacy to suppress melatonin by a significant amount during sleep. Although there was no direct comparison, the green light masks appeared more effective in melatonin suppression than the white light masks used by Cole and colleagues (2002). Reasons for superior effectiveness of green masks might include: (1) The special effectiveness of green light, as reviewed below. (2) Green LEDs produce brighter illuminance and more photons that white LEDs for the same electric power and heat production; Thus, green LEDs are brighter. (3) Green LEDs might be effective (phase-shifting and anti-depressant) with lower illuminance and irradiance than white LEDs. The present study highlights the possible utility of green light, which may prove to be a more favorable approach to light treatment than the use of white light.
Special Effectiveness of Green Light
Most studies of the effects of bright light have involved white light. White light contains a very broad spectrum, and it has been postulated that specific wavelengths may be more effective at affecting physiological change than others.
33
As mentioned above, melanopsin has been described as the photopigment of the mammalian circadian system. This novel opsin-like protein is expressed in retinal ganglion cells that form the RHT, a neuronal connection between the retina and the SCN. While proper entrainment of these rhythms requires retinal input, these melanopsin-containing ganglion cells are intrinsically sensitive to light, partly independent of the rod-cone system (Berson et al., 2002; Hattar et al., 2002; Skene, 2003; Thapan et al., 2001), and may have a peak absorbance different from that of the cone system (Brainard et al., 2001a; 2001b).
Brainard, Richardson, King, and Reiter (1984) compared the suppression of pineal melatonin caused by several wavelengths of light presented to Syrian hamsters. They found that light around 500 nm was the most effective (“blue” light at 435-500 nm was most effective and “green” light at 510-550 nm was second most effective) in suppressing melatonin. Wright and Lack (2001) found that wavelengths close to 500 nm were most effective in suppressing melatonin in humans. Others (Lockley, Brainard & Czeisler, 2003; Wright, Lack & Kennaway, 2004) have demonstrated that light somewhat below 500 nm (460 nm) was significantly more effective at suppressing melatonin than light slightly above (555 nm). Warman and colleagues have shown that shorter-wavelength light was more effective at shifting circadian phase, even though that light had fewer
34
photons than the white light. A recent study by Glickman, Byrne, Pineda, Hauck and Brainard (2006) described a study in which three weeks of bright blue light through LEDs in a light box significantly improved SAD symptoms during winter versus red light placebo. This study found the blue light to be safe and tolerable.
However, recent findings suggest that low intensity blue light (456 nm) was not better at suppressing melatonin than high intensity light of the same wavelength or low or high intensity green light at 548 nm in an older sample (Herljevic et al., 2004). Although several studies of young adults have suggested that blue light at the retina is more effective than green light for suppressing melatonin, the studies included a correction for the attenuation of blue light by the lens. The advantage of blue light at the cornea is not as impressive, particularly among older individuals. When illumination through the eyelids is considered, green light is transmitted somewhat better than blue light. Berson's study found that the peak activation of melanopsin neurons at about 500 nm (green or blue-green) in rats. Although the most popular current view is that blue light may be more active than green light, it is also widely accepted that blue light is potentially more dangerous to the retina. The benefits/risks ratio for blue light may not be as good as for green light.
35
Green light has been shown to be more effective in treating SAD symptoms than placebo dim red light. However, when white and blue light (which may be more effective than green light at suppressing melatonin) were compared in a crossover design with 18 subjects, no difference in treatment effect was found in SAD between white and blue (half-peak 435465nm) light of equal photon density (Brainard, Sherry, Skwerer, Waxler, Kelly & Rosenthal, 1990). This suggests that there may not always be added therapeutic benefit of differing wavelengths of light, except that blue and/or green light may be more tolerable than white light.
Current literature is somewhat unclear whether blue light would be more effective than green light, particularly for antidepressant action, but it is widely accepted that intense blue light has more risk to the retina (Algvere et al., 2006). Therefore, the optimal benefits/risks ratio may lie with green light around 500 nm.
The reason for the enhanced effects of light at approximately 500 nm is currently unknown. Several theories have been proposed, including that by Gehring and Rosbash (2003), that prehistoric metazoans evolved a particular ability to perceive the blue / green light that was visible in the oceanic depths, which was used for circadian timing purposes (i.e., avoiding harmful ultraviolet light from the sun).
36
Aims of the Present Study
The present study was a randomized controlled trial of green light vs. dim red light to evaluate effects of light administered during sleep on sleep and mood. It utilized a mask, worn at night, equipped with lightemitting diodes (LEDs). Measurements of sleep, mood, side effects and other variables were taken at the beginning and at the end of two weeks of nighttime light administration. The primary aims were:
(1)
To evaluate whether administration of green light,
using a mask during sleep, is safe (presenting few negative treatment emergent effects) and tolerable (demonstrating acceptable compliance) in young men.
Hypothesis: Green light masks are safe and tolerable in young men.
(2)
To evaluate the effects of administration of green light
vs. red light, using a mask during sleep, on subjective and objective sleep variables in young men.
37
Hypothesis: Green light masks will improve sleep variables (consolidating sleep and reducing fragmentation) in young men more than dim red light.
Additionally, this study had the following secondary aims:
(1)
To evaluate whether administration of green light
compared to dim red light, using a mask during sleep, will reduce mood disturbance in minimally to mildly depressed young men.
Hypothesis: Green light masks will reduce mood symptoms in young men more than dim red light.
(2)
To evaluate the effects of administration of green light
compared to dim red light, using a mask during sleep, on circadian timing variables in young men.
Hypothesis: Green light from masks at the end of sleep will produce more of a circadian phase advance in young men than dim red light.
METHOD
Overview
The study was a randomized, controlled clinical trial of a bright green light mask versus a dim red light mask. This study protocol extended over 15 days, scheduled at some time after recruitment and screening of participants. There was a 3-day baseline period and a 12-day intervention period. In the baseline data collection period, subjects were instructed to complete a sleep diary (SD), mood visual analogue scale (MVAS), The Quick Interview of Depressive Symptomatology Self Report (QIDS-SR; Rush, Gullion, Basco, Jarrett & Trivedi, 2003), Epworth Sleepiness Scale (ESS; Johns, 1991), The Pittsburgh Sleep Quality Index (PSQI; Buysse, Reynolds, Monk, Berman & Kupfer, 1989), Systematic Assessment for Treatment Emergent Effects (SAFTEE; NIMH, 1986), Horne-Östberg Morningness-Eveningness Questionnaire (HOMEQ; Horne & Östberg, 1976). Participants also wore a wrist actigraph for the duration of the study. Subjects wore the mask to bed for 12 nights and repeated questionnaires at the end of the study. A summary of all of the study components can be seen in Table 1.
Subjects
38
39
Participants in this study were 30 young adult males recruited from the University of California, San Diego (UCSD) and San Diego State University (SDSU) campuses, as well as from the general population of San Diego.
Written informed consent was obtained from participants prior to the start of the study, in accordance with the guidelines set forth by the American Psychological Association (2002), the Declaration of Helsinki, as well as any additional guidelines set forth by the UCSD Human Research Protections Program and the SDSU Institutional Review Board, which both approved the protocol.
A two-stage recruitment strategy was used. First, not specifically targeting depression, male students from the UCSD campus, as well as other young men from the San Diego area, were recruited. UCSD students were solicited on approved areas of campus for participation in the study. Other community members were referred by other participants or UCSD students who heard about the study. Those solicited or referred were paid $5 to fill out a screening questionnaire on sleep and mood, as well as a Center for Epidemiological Studies Depression scale (described later); they were informed that they may be selected for a further study about light
40
mask treatment. Those whose scores suggested minimal to mild symptoms of depression (CESD score of 15), and 29 for other problems (e.g., unwillingness to maintain a sleep schedule). All of the participants excluded for mood disturbance were immediately sent a letter suggesting treatment at UCSD or SDSU student health or UCSD outpatient services.
Subject Characteristics
After screening, a total of 30 participants gave informed consent to participate in the expanded study. There were no drop-outs after consent was signed. Table 2 reports age and ethnicity characteristics of the sample, including breakdown by light group and comparison to those screened who were not invited to participate.
56
57
Compliance. Compliance with the light mask is reported in Table 3. Average compliance out of 12 nights was 10.7 nights for the green group and 11.3 nights for the red group. No significant difference was found. Only one subject, from the Green Light group, was not compliant with the light mask for at least 10 of 12 nights. For that subject, there were 5 nights throughout the study, including the last 2, that he did not use his mask as instructed; he reportedly stayed up late studying and decided not to wear the mask. Thus, this subject was excluded from analysis. Several subjects reported and demonstrated inconsistent wearing of actigraph devices; subjects with several missing days of recording or long periods where the actigraphs were not worn were excluded from study. Two subjects contributed enough data to reliably estimate cosines, but not enough to reliably estimate sleep parameters. Thus, only 20 (11 green, 9 red) subjects’ actigraphy recordings were usable for cosine-fitting analyses, and only 18 (10 green, 8 red) were usable to determine sleep variables. No systematic differences between those with complete data and those without were found.
Independent-samples t-tests did not show significant differences between groups or testing periods (pre/post) on any expectation ratings. The mean expectation for mood improvement at the start of the study was
58
62.67 in the green and 66.64 in the red group. Mean sleep improvement expectation was 65.57 in the green and 68.21 in the red group. At the end of the study, mean subjective mood ratings were 50.53 (green) and 52.73 (red), and mean subjective sleep ratings were 54.60 (green) and 52.27 (red).
Distributions of Dependent Variables
Mean values for baseline, end and difference scores for all dependent variables, in both light groups, are reported in Table 4. Whisker plots detailing distributions (before and after) for Safety, Mood, Sleep Questionnaire, Sleep Diary and Actigraphic variables, by light group, are displayed in Figures 3-18.
Safety of Nocturnal Green Light Masks
Safety was evaluated with the SAFTEE symptom inventory, which is divided into 16 subscales. Mann-Whitney U scores for overall score and all subscales are reported in Table 4. Although no before/after change scores for subscales were significant by Bonferroni criteria (.05 / 17 = .003), 2 subscales were nominally significantly different between groups.
59
The green light group reported a slight increase in symptoms on the “Eye” subscale and the dim red group reported a slight decrease. MannWhitney U comparisons were performed on each item in this subscale. These results are reported in Table 5. No differences were found on the item level. The largest trend was an increase in Light Sensitivity, where those in the red light group reported slightly lowered sensitivity on average, whereas those in the bright light group reported increased sensitivity on average. This difference may be clinically relevant, though not statistically conclusive.
The green light group also reported a slight increase in symptoms on the “Chest” subscale, and the dim red group reported a slight decrease. Mann-Whitney U comparisons were performed on each item in this subscale. These results are reported in Table 6. No significant differences or notable trends were found on the item level.
In addition to checklist reports of side effects, all participants were asked to evaluate the masks as part of a debriefing interview conducted by the researcher. All subjects reported some discomfort from the mask, whether green or red. Nearly all participants described the mask as very uncomfortable. Specifically, many subjects noted that the mask was either too tight or became loose, sliding sideways (off the eyes), up, or down
60
(over the nose). All of those with the green mask reported discomfort resulting from the brightness and early timing of illumination of the light from the mask. Two subjects reported that the intensity was nearly intolerable and were not able to remain compliant throughout the study (each by not wearing the mask for 2 nights during the study).
Effects of Nocturnal Green Light Masks on Actigraphic Sleep and Circadian Timing
The MANCOVA for Actigraphic Time to bed, Time out of bed, and Sleep Acrophase as dependent variables, baseline recording as covariate and light group as the independent variable was significant (Hotelling’s Trace (3,31) = 0.403, F = 4.167, p = 0.014). Results of between-groups tests are reported in Table 4. The overall result suggests that, taken together, bedtime, wake time and acrophase change were different between the two groups. Post-hoc analyses showed no significant differences on any specific measure. Although not significant individually, the green group showed a larger phase advance in all variables. A graphical display of the circadian phase shift can be seen in Figure 19.
This pattern was different in the sleep diary data, where time to bed was slightly advanced from 0:46:44 to 0:27:10 in the green group, but
61
slightly delayed from 0:48:46 to 0:58:51 in the dim red group. Also, when looking at time awake, the bright green group was somewhat advanced, from 8:39:37 to 8:11:44, and the red group was even more advanced, from 8:41:58 to 8:04:41.
The MANOVA for Actigraphic TST, WASO, Sleep Efficiency, Sleep Latency, and Number of Awakenings difference scores as dependent variables and light randomization as the independent variable was not significant (Hotelling’s Trace (5,12) = 0.497, F = 1.192, p = 0.369), suggesting that there were no differences in these actigraphic sleep variables between groups.
Effects of Nocturnal Green Light Masks on Subjective Sleep
Correlations between sleep diary and actigraphic sleep analogues are reported in Table 7. Correlations between sleep diary and actigraphy variables were significant for baseline sleep latency, time to bed and time awake, as well as time awake at the end of the study. This suggests that actigraphy and sleep diary measured similar constructs for these variables at these times.
62
The MANOVA for subjective Sleep Diary items (Sleep Latency, TST, WASO and Sleep Efficiency) difference scores as dependent variables and light randomization as the independent variable was significant (Hotelling’s Trace (4,24) = 0.498, F = 2.989, p = .039), but post-hoc tests of betweengroups differences did not distinguish between mask assignments on any of the individual sleep diary items, (reported in Table 4). This suggests that groups differed overall, but not on any specific measure. Although groups did not significantly differ on any single variable, the green light group reported a nominal increase in WASO and decrease in sleep latency, sleep efficiency, and time in bed. A larger difference was seen with TST, where the green light group reported sleeping an average of approximately 49 minutes less at the end of the study compared to the beginning, compared to a 5 minute decrease in the dim red light group.
The MANOVA for sleep questionnaires (PSQI, ESS, HOMEQ) difference scores as dependent variables and light randomization as the independent variable was not significant (Hotelling’s Trace (3,21) = 0.151, F = 1.059, p = 0.388), suggesting that there were no differences in sleep quality, sleepiness or morningness/eveningness difference scores between groups.
Effects of Nocturnal Green Light Masks on Mood
63
Mean CESD at screening was 8.3 in the dim red group and 7.8 in the bright green group. When green and red light groups were compared, no differences were found (t = .315, p = .755). Correlation between CESD at screening and QIDS at baseline was significant (r = .577, p = .002).
A t-test of QIDS difference scores (before/after) compared by light group was not significant (t (26) = -1.455, p = 0.158), suggesting that there were no differences in mood rating changes between treatments.
DISCUSSION
The present study evaluated the feasibility and utility of a mask, worn at night, equipped with bright green LED lights for improving mood, changing sleep and shifting circadian phase. The hypothesis that the green light mask, as compared to dim red light, would be safe and tolerable was partially supported, as were the hypotheses that the green light mask would alter sleep or circadian rhythms. The hypothesis that the mask would improve mood was not supported.
Light Masks are Safe and Tolerable for Use in Research
That no subject dropped out of the study, or reported serious adverse events, subsequent to informed consent being signed, suggests that, overall, the mask protocol is safe and feasible. Additionally, overall compliance with the light masks was good. Although most subjects were not able to remain compliant for the entire study, nearly all reported being able to wear the mask, as instructed, for nearly all nights of the study. This suggests that even though the masks may be uncomfortable at times, and remembering to reset and wear the masks may be inconvenient for some, this method of delivery of bright light demonstrates compliance on par with other studies of bright light (Tuunainen et al., 2004).
64
65
Results of the SAFTEE symptom inventory suggest that the light masks produced few detectable side effects in relatively healthy young males. Although no side effects were statistically significant, there were trends towards significance for “eye” symptoms and “chest” symptoms. The most likely cause of an elevation in “eye” symptoms is due to greater reported light sensitivity following use of bright green light. Although this side effect was not statistically significant with Bonferroni criteria, it could be expected, as light sensitivity has been reported in earlier studies of bright light (Hebert, Martin, Lee & Eastman, 2002). Examination of the results of “chest” symptoms reveals a pattern by which green light users reported a slightly greater incidence of coughing, shortness of breath and chest pain. No apparent causes of these symptoms are apparent at this time, and these symptoms have not been reported by others previously, except for chest tightness, which has been reported in one subject of one previous study (Kogan & Guilford, 1998). One possible cause could be that occasionally, subjects reported that the mask would not remain in place and would shift to the side, up, or down. When the mask shifted down, some subjects reported, it would cover their nose. If this is the case, the shifting mask may have caused slight restrictions in airflow, leading to hypopneas or apneas, which may explain these symptoms. However, it
66
should be noted that when 17 subscales are tested, one nominally significant contrast is to be expected by chance.
All subjects reported some discomfort from the mask. This may be a problem inherent to light mask studies, but it may also suggest that redesigned masks are needed. Perhaps the discomfort caused by the masks sometimes outweighed the benefits received, which would themselves be somewhat slight, given the relative health of the sample. It should be noted that the masks used in the present study were originally constructed as preliminary prototypes rather than final products.
Most of the subjects who received bright green light reported discomfort from the bright light in the morning. It is unclear whether the bright light was waking them up or if a circadian phase advance was causing them to awaken earlier, in which case subjects would be awakening earlier than intended, during the light delivery. Because the data supports a phase advance, it is likely that these awakenings are at least in part due to phase shifts, rather than disturbances due to light. Had the protocol encouraged subjects to awaken earlier as their phases advanced, there might have been less discomfort. Moreover, had the protocol encouraged arising earlier, the contrast between green and red groups might have been greater.
67
Overall, light masks are generally safe, producing no notable side effects other than anecdotal discomfort from the mask. Improvements in the design and construction of light masks may lead to reduced complaints and possibly more effective treatment. Despite these complaints, light masks were well-tolerated and should be feasible for use in other research studies. Although no previous studies have systematically examined or reported safety data, these results are consistent with previous studies of light masks, which have indicated good compliance and low rates of dropouts (Tuunainen et al., 2004).
Light Masks Advanced Circadian Phase But Did Not Improve Sleep
Previous studies of light masks have suggested that they may be effective in advancing circadian phase (Ando et al., 1999; Cole et al., 2002; Riesenberg et al., 2003). Notably, the fact that the green light advanced phase shows that compliance and light transmission were good enough to have a biological effect. Although the present study did not utilize endocrine measures, as in these previous studies, changes in actigraphic measurements of bed and wake times, as well as acrophase, indicate a significant phase advance in the bright green group versus the dim red group. This suggests that the bright green light just prior to waking was
68
sufficient to produce a significant phase advance. This is supported by anecdotal reports from those in the bright green light group of waking up earlier at the end of the study than at the start of the study.
It is interesting to note that while the sleep diary data suggest that the green light group advanced time to bed and time awake, the dim red group slightly delayed time to bed and, more surprising, they advanced time awake – to a greater extent than the bright green group. This is contrary to actigraphic measures in this group that showed an advance of time to bed but no change in time awake. Correlations between subjective and objective estimates of time to bed were significant at the start of the study but not at the end, and correlations were significant for time out of bed at both time points. As subjects were asked to keep a particular sleep schedule, correlations between subjective and objective sleep measures may have been discrepant, especially at the start of the study, as subjects reported bedtimes closer to the target, while the actigraphs detected more variability in time to bed.
A significant difference between groups was detected for changes in subjective experience of sleep, such that the green light masks produced some worsening of sleep parameters overall. Although no specific factors were significant, the green light mask users reported an overall decrease in
69
total sleep time, as well as a slight increase in WASO and slight decreases in sleep efficiency. There was also a slight decrease in sleep latency, which is usually regarded as beneficial. This effect was largely due to the presence of 3 outliers who reported extremely high WASO as a result of the green mask. Notably, this pattern was also found in the actigraphic data, in addition to increased frequency of awakenings in the green light group. Also, the actigraphic data were influenced by the presence of 2 outliers, reflecting abnormally short baseline total sleep time. This finding of worse sleep in the green mask group versus the red mask group may be due to the notable discomfort reported by all light mask users, compounded by the additional discomfort reported by green light mask users, due to phase advance or waking up to bright light. However, a lack of other group differences, or even simple effects within this domain, suggests that the light mask produces worsening perceptions of sleep parameters overall, rather than specific alterations in sleep. Thus, the green light mask users had a general impression of having slept less well overall.
No significant difference was observed between green and red light groups on changes in actigraphic sleep latency, efficiency, duration and awakenings. Although it was hypothesized that the green light mask would produce an observable change in these sleep variables, this was not
70
evidenced in the actigraphic data, although the pattern was in the same direction as in the sleep diary data, which was significantly different by group. This suggests that changes in objective sleep were of a nature not detectable by the actigraph or that changes of the perception of sleep were greater than those of sleep per se.
Change scores on questionnaires measuring sleep quality (PSQI), daytime sleepiness (ESS) and morningness/eveningness (HOMEQ) did not distinguish groups. It should be noted that the trends evidenced suggest a very slight worsening of sleep quality (PSQI score) with green masks and very slight improvement in placebo masks. Additionally, there was a slight trend for HOMEQ scores to reflect phase advance in the green light group versus delay in the dim red light group, and a very slight increase in daytime sleepiness (ESS score) in the green light group versus the dim red light group, who reported slightly less sleepiness. This suggests that despite complaints, the green light masks did not increase daytime sleepiness or worsen sleep quality to any substantial degree. Conversely, it also suggests that these domains were not improved, either. It should be noted that although the PSQI has been routinely used to detect change (Grandner et al., In Press), the ESS was not originally intended for this purpose (Johns, 1991). Thus, a statement of no effect for sleep quality is less cautiously made than for daytime sleepiness.
71
These results also suggest that although a significant phase shift was detected, no notable difference in morningness/eveningness orientation was produced. However, the HOMEQ is not routinely used to detect change; rather, it was intended for classifying by type (Horne & Östberg, 1976). Thus, a statement of no effect for subjective time of day orientation must be made cautiously.
Light Masks Did Not Improve Mood
Although light masks have not been previously investigated in the context of mood change, numerous studies have documented the effectiveness of bright light in altering mood in depressed (Tuunainnen, Kripke & Endo, 2004) and in non-depressed individuals (Grandner et al., 2004; Kohsaka et al., 1999; Partonen & Lonnqvist, 2000). The present study did not detect any significant mood change in young men with minimal-mild depression, though a non-significant trend showed a slight worsening of symptoms in the green light group and slight improvement in the red light group. Although most subjects reported some mood symptoms that could have been improved, there was a notable floor effect in depression symptoms. As a precautionary measure, participants were excluded if they presented symptoms that suggested clinically relevant
72
mood symptoms that would suggest that treatment would be required. Previous studies have suggested that reductions in depressive symptoms are particularly difficult to detect, especially in smaller samples without significant symptoms. Additionally, these results may be even more difficult to detect in men (Rochlen, Whilde & Hoyer, 2005), since male socialization tends to create negative attributions to weakness, vulnerability, emotional expression, and seeking help from others. Additionally, studies documenting the benefits of bright light in non-depressed groups suggest that measuring increases in positive experience, rather than decreases in depression, may be most appropriate (Grandner et al., 2004; Partonen & Lonnqvist, 2000). Perhaps the inclusion of a quality of life measurement would have more fully addressed the issue of improvement related to bright light in this sample.
Extensions to Current Knowledge
This study contributes to current scientific knowledge in several important ways. First, this study provides specific, detailed documentation of any possible negative effects of treatment, providing the first such account of safety, compliance and feasibility of light masks. In addition, there have been few studies that specifically document side effects of
73
bright light (Chesson et al., 1999; Kogan & Guilford, 1998; Remé et al., 1996), especially green light.
Second, this study documents the effects on sleep of bright light delivered by mask just prior to waking. This study suggests that although the bright light did not improve sleep, it also did not alter subjective estimates of sleep quality, daytime sleepiness and morningness/eveningness. This suggests that although light masks alter circadian rhythms, either they do not improve sleep quality, or they need to be more comfortable. Additionally, they might be more useful for people with phase delay symptoms than those without.
Third, this study suggests that nocturnal bright green light may not be effective in reducing depressive symptoms. Although bright light has been shown to reduce depressive symptoms, this study did not demonstrate any such effect or even a trend. Although it may be the case that a brighter light could have been used, a light of even greater intensity may have exacerbated the reported green light mask discomfort. Additionally, the fact that a significant circadian phase shift occurred suggests that the light was sufficiently bright.
74
Fourth, this study replicates previous findings of phase advances induced by light masks (Ando et al., 1999; Cole et al., 2002), extending them into the domain of green light. This supports other studies, which suggest that bright green light may be as effective, or more so, in shifting circadian rhythms. The study by Cole and colleagues (2002) found an average phase advance of approximately 80 minutes, compared to the approximately 30 minute advance demonstrated in the present study. Although the present shift is notably smaller, it should be noted that the Cole study sought to actively treat patients with Delayed Sleep Phase Syndrome, a disorder characterized by circadian abnormalities, usually sensitive to phase advance with bright light. Also, the Cole study included a behavioral intervention encouraging both bright light and control subjects to slowly advance sleep, but in the present study, participants were instructed to stabilize wake-up time. Moreover, the Cole treatment phase was twice as long. The present study did not administer bright light to patients with any circadian abnormalities or any particular motivation for phase advance.
Limitations of the Study
This study presents several important limitations. First, the sample used for the present study presents several inherent problems. Due to various constraints, the sample consisted of only 30 people (15 per group),
75
and only healthy young males studied in the spring and summer months. Thus, any results are to be interpreted cautiously in the presence of possible seasonal, gender, and age effects, as well as floor effects for treatment and underpowering of the study. As this study primarily assessed safety and compliance, these results should still be useful. Thus, the results of the present study may be understating the usefulness of nocturnal bright green light. Additional, larger studies, with more diverse samples, will better ascertain this.
Another limitation may be that actigraphy insufficiently measures arousals and sleep architecture which may be related to the sleep quality. Actigraphy does monitor arousals and midsleep awakenings, though not as well as it monitors total sleep time. It is true that actigraphy does not detect some brief sleep arousals without movement, but such brief arousals are only scored with considerable difficulty in polysomnography (Mathur & Douglas, 1995). It is likewise true that actigraphy does not distinguish the sleep stages, but it is widely recognized that insomnia and other disturbances of sleep have more to do with total sleep time, time awake in bed, and arousals than they have to do with quantities of each sleep stage (Kryger, Roth & Dement, 2000).
76
A third limitation to this study is that compliance was only recorded via self-report. While some light delivery devices can monitor light intensity and movement (with a photometer and accelerometer attached to the unit), as well as whether the light is turned on or off, it is still impossible to detect whether the mask is being used as intended without video cameras, which would invade privacy. As there is currently no way to monitor true compliance with a light mask at home through more objective means, future studies may utilize as-yet-undeveloped measurements of compliance. At this time, compliance to the light mask can only be inferred via daily self-report diaries. It is possible that compliance was lower than reported, with reports biased for social desirability. While this would lead to less reliable results, it would most likely also lead to an underestimate of treatment effects. Thus, studies with more reliable measures of compliance may show the light masks to be more beneficial for the compliant patient than was evidenced in the present study.
77
Table 1: Outline of the study Day 1
2
3
4-7
8
9-14
15
Friday
Saturday
Sunday
Mon-Thu
Friday
Sat -Thu
Friday
Mask worn at night SD MVAS CD Expectation
Expectation QIDS-SR
QIDS-SR
ESS
ESS
PSQI
PSQI
SAFTEE
SAFTEE
HOMEQ Actigraph Staff visit
Staff visit
SD = Sleep Diary, MVAS = Mood Visual Analogue Scale, CD = Compliance Diary, QIDS = Quick Inventory of Depressive Symptoms- Self Report, ESS = Epworth Sleepiness Scale, PSQI = Pittsburgh Sleep Quality Index, SAFTEE = Systematic Assessment of Treatment Emergent Effects, HOMEQ = Horne-Östberg Morningness-Eveningness Questionnaire
78
Table 2: Age and Ethnicity Breakdown for Light Groups and Screened
Group
Hispanic Asian
Native
White
More Age
(White)
Hawaiian
(Non-
Than (mean)
or Other
hispanic)
One
Pacific
(%)
Race
(%)
(%)
Islander
(%)
(%) Green
6.7
26.7
0
66.6
0
23.13
Red Light
6.7
40.0
0
53.3
0
22.13
Did not
5.7
58.6
4.3
25.7
5.7
24.71
Light
participate Non-Participants
79
Table 3: Number of Nights Self-Reported Compliant and Group Status For Each Subject Subject Group
# Nights Compliant
1
Green
11
2
Red
12
3
Red
10
4
Green
10
5
Green
10
6
Green
11
7
Red
11
8
Red
12
9
Red
12
10
Red
12
11
Green
7
12
Green
10
13
Red
10
14
Green
10
15
Red
10
16
Green
12
17
Red
11
18
Green
12
80
Table 3: Number of Nights Self-Reported Compliant and Group Status For Each Subject, Continued Subject Group
# Nights Compliant
19
Red
11
20
Green
12
21
Green
11
22
Red
12
23
Red
11
24
Green
11
25
Red
11
26
Green
11
27
Green
11
28
Red
12
29
Green
12
30
Red
11
Note: Compliance is defined as reporting having used the mask at night as instructed.
81
Table 4: Mean Values for Baseline, End and Difference Scores for Mood, Sleep Questionnaire, Sleep Diary, and Actigraphy Variables, by Light Group. Green Light
Red Light
Comparison Simple Effect/ Specific
Variable
Baseline
End
Difference Baseline
End
Difference
Test
Value
p
-7.87
U
67.50
0.061
SAFTEE SAFTEE overall score
139.13
140
0.87
139.13 131.26
7.13
7
-0.13
6.6
6.27
-0.33
U
99.00
0.504
8.93
9.33
0.4
9.4
8.6
-0.8
U
57.00
0.014
6.67
6.6
-0.07
6.13
6.07
-0.07
U
110.50 0.915
8.53
8.47
-0.07
8.93
8.33
-0.6
U
80.00
0.148
8.93
8.4
-0.53
8.07
7.73
-0.33
U
99.00
0.535
8.27
8.53
0.27
8.53
8.13
-0.4
U
67.50
0.021
SAFTEE "head" SAFTEE "eye" SAFTEE "ear" SAFTEE "mouth and teeth" SAFTEE "nose and throat" SAFTEE "chest"
82
Table 4: Mean Values for Baseline, End and Difference Scores for Mood, Sleep Questionnaire, Sleep Diary, and Actigraphy Variables, by Light Group, Continued. Green Light
Red Light
Comparison Simple Effect/ Specific
Variable
Baseline
End
Difference Baseline
End
Difference
Test
Value
p
SAFTEE SAFTEE "heart"
4.07
4.07
0
4.13
4
-0.13
U
105.00 0.317
6.4
6.53
0.13
6.47
6.33
-0.13
U
94.50
9
9.13
0.13
8.93
9.07
0.13
U
106.00 0.765
9.33
9.53
0.2
10.07
8.73
-1.33
U
67.50
8.47
8.2
-0.27
8.27
8.07
-0.2
U
105.00 0.674
8.27
8.6
0.33
8.47
8.27
-0.2
U
81.00
0.13
5.87
5.87
0
6
5.33
-0.67
U
84.00
0.212
SAFTEE "abdomen"
0.356
SAFTEE "bowel" SAFTEE "appetite"
0.053
SAFTEE "urination" SAFTEE "genitals" SAFTEE "muscle, bone and joint"
83
Table 4: Mean Values for Baseline, End and Difference Scores for Mood, Sleep Questionnaire, Sleep Diary, and Actigraphy Variables, by Light Group, Continued. Green Light
Red Light
Comparison Simple Effect/ Specific
Variable
Baseline
End
Difference Baseline
End
Difference
Test
Value
p
SAFTEE SAFTEE "walking and moving"
8.67
8.6
-0.07
8.47
8.2
-0.27
U
100.50 0.553
6.6
6.6
0
6.8
6.27
-0.53
U
100.00 0.565
24
24.53
0.53
23.87
21.87
-2
U
89.50
0.337
-1.46
0.158
SAFTEE "scalp and skin" SAFTEE "other"
MOOD t-test QIDS
4.13
5
0.87
4.6
3.33
-1.27
84
Table 4: Mean Values for Baseline, End and Difference Scores for Mood, Sleep Questionnaire, Sleep Diary, and Actigraphy Variables, by Light Group, Continued. Green Light
Red Light
Comparison Simple Effect/ Specific
Variable
Baseline
End
Difference Baseline
End
Difference
Test
Value
p
SLEEP QUESTIONNAIRES [Hotelling’s Trace (3,21) = 0.151, F = 1.059, p = 0.388] PSQl
5.13
5.47
0.33
5.33
4.6
-0.73
F test
3.04
0.095
HOMEQ
50.08
49.87
-0.08
46.33
47.69
1.33
F test
2.08
0.163
ESS
7.2
8
0.8
8.67
7.4
-1.27
F test
0.61
0.445
SLEEP DIARY [Hotelling’s Trace (4,24) = 0.498, F = 2.989, p = .039] Diary Latency
11.66
10.37
-1.29
12.04
12.14
0.1
F test
0.42
0.523
WASO
9.26
14.26
5.9
7.96
7.64
-0.32
F test
0.95
0.337
Diary TST
465.78
416.63
-49.15
438.64 433.82
-4.82
F test
1.82
0.188
95.62
94.47
-1.15
95.68
-0.19
F test
0.38
0.545
Diary
Diary SEFF (%)
95.49
ACTIGRAPHY (SLEEP) [Hotelling’s Trace (5,12) = , F = 1.192, p = 0.369] Total Sleep Time
393.19
370.54
-22.65
325.78 348.44
22.66
F test
5.97
0.026
WASO
128.25
139.98
11.73
117.88 121.46
3.57
F test
0.14
0.716
76.16
74.08
-2.08
73.17
1.24
F test
1.47
0.243
Sleep Efficiency
74.41
85
Table 4: Mean Values for Baseline, End and Difference Scores for Mood, Sleep Questionnaire, Sleep Diary, and Actigraphy Variables, by Light Group, Continued. Green Light
Red Light
Comparison Simple Effect/ Specific
Variable
Baseline
End
Difference Baseline
End
Difference
Test
Value
P
ACTIGRAPHY (SLEEP) [Hotelling’s Trace (5,12) = , F = 1.192, p = 0.369] Number of Awakenings
29.75
29.95
0.2
25.1
27.44
2.34
F test
1.91
0.186
13.56
12.07
-1.49
11.35
10.83
-0.52
F test
0.12
0.739
Sleep Latency
ACTIGRAPHY (CIRCADIAN) [Hotelling’s Trace (3,31) = 0.403, F = 4.167, p = 0.014] Time Into Bed
1:05:33 0:30:04 -0:35:29
1:30:21 1:01:44 -0:28:37
F test
0.962
0.334
9:46:52 9:03:41 -0:43:11
9:01:56 8:48:52 -0:13:04
F test
1.109
0.300
5:51:38 5:02:36 -0:49:02
5:31:09 5:08:18 -0:21:51
F test
0.021
0.886
Time Out of Bed Acrophase Sleep
Light Groups, with Mann-Whitney U Comparisons of Difference Scores
Table 5: SAFTEE “Eye” Subscale Baseline, End and Difference Scores for Bright Green and Dim Red
86
Red Light Groups, with Mann-Whitney U Comparisons of Difference Scores
Table 6: SAFTEE “Chest” Subscale Baseline, End and Difference Scores for Bright Green and Dim
87
88
Table 7: Correlations Between Sleep Diary and Actigraphic Sleep Variable Analogues at Baseline and End of Study
Baseline Variable
End of Study
r
p
r
p
Total Sleep Time (TST)
-.053
.836
.061
.810
Wake After Sleep Onset (WASO)
.269
.280
.158
.531
Sleep Efficiency (SEFF)
.249
.320
.245
.328
Sleep Latency (SL)
.529
.024
.049
.848
Time to Bed
-0.651
.006
-0.467
.059
Time Awake
0.558
.016
0.810