Uppsala University
This is a published version of a paper published in Journal of Archaeology and Ancient History (JAAH). Citation for the published paper: von Hackwitz, K., Stenbäck, N. (2013) "Changing Landscapes – A GIS analysis of Neolithic site location and shore displacement in Eastern Central Sweden." Journal of Archaeology and Ancient History (JAAH), (6) Access to the published version may require subscription. Permanent link to this version: http://urn.kb.se/resolve?urn=urn:nbn:se:uu:diva-200090
http://uu.diva-portal.org
Journal of Archaeology and Ancient History 2013
Number 6
Editors: Frands Herschend and Paul Sinclair. Editorial Board: Assyriology: Olof Pedersén. Archaeology: Anders Kaliff, Kjel Knutsson, Paul Lane. Classical Archaeology and Ancient History: Gunnel Ekroth, Lars Karlsson. Egyptology: Irmgard Hein, Lana Troy.
Editorial history: www.arkeologi.uu.se/Journal/
ISSN: 2001-1199
Published: 2013-06-04 at http://urn.kb.se/resolve?urn=urn:nbn:se:uu:diva-200090
Changing Landscapes – A GIS analysis of Neolithic site location and shore displacement in Eastern Central Sweden. Kim von Hackwitz1 & Niklas Stenbäck2
1
Kim von Hackwitz. Department of Archaeology and Ancient History, Box 626, 751 26 Uppsala, Sweden.
[email protected]. 2 Niklas Stenbäck. Societas Archaeologica Upsaliensis, Thunbergsvägen 5B, 752 38 Uppsala, Sweden.
[email protected]
Department of Archaeology and Ancient History Uppsala University, Sweden
1
ABSTRACT Kim von Hackwitz & Niklas Stenbäck 2013. Changing Landscapes – A GIS analysis of Neolithic site location and shore displacement in Eastern Central Sweden. Journal of Archaeology and Ancient History. 2013, No. 6 pp 1–26. http://urn. kb.se/resolve?urn=urn:nbn:se:uu:diva-200090 This article is an attempt to put forward the use of new digital techniques and data for understanding prehistoric landscapes. The starting point is that the specific characteristics of the landscape and of the sites included affect the interpretation. One character is the contemporary landscape and its topographies. Ancient landscapes can be successfully recreated digitally using GIS. By applying GIS methodology, a regression equation and new data, we reinvestigated an hypothesis proposed by Welinder in 1978 concerning the acculturation of the Pitted Ware Culture. The results indicate that a reconstruction of the landscape may alter the understanding of the Neolithic land use and the question of the relocation and termination of the Pitted Ware Culture at the end of Middle Neolithic B. KEYWORDS: Eastern Central Sweden, Neolithic, pitted ware culture, site location, site performances, GIS, NNH, elevation equations, shoreline reconstructions, Welinder, Norslunda
2
Kim von Hackwitz 1 & Niklas Stenbäck2
Changing Landscapes – A GIS analysis of Neolithic site location and shore displacement in Eastern Central Sweden.
Introduction The formal properties of an archaeological site, for example its location in relation to topography, direction, view, acoustics, distance or other similar landscape phenomenon, affect our understanding of the past function of the place, but also of the society of the people who once produced the archaeological site. It might even be argued that the site’s formal properties are as important as its archaeological contents for ascribing meaning to it (Schiffer & Skibo 1997; Zedeño 2000; Bowser & Zedeño 2009; von Hackwitz 2010, 2012). For example, sites located adjacent to prehistoric shorelines tend to be interpreted as associated with marine activities. Such an interpretation is strengthened by artefacts related to marine hunting and fishing or to ancient seafaring. However, if a site containing artefacts related to marine activities were located in the inland, the interpretation would presumably be different, plausibly pointing to a land use system integrating the coast and the inland. This means that the interpretation of an archaeological site greatly depend on the topographical settings. Hence it can be argued that it is essential that the archaeological reconstruction of ancient landscape settings becomes as accurate as possible. In recent years, new digital techniques for reconstructing prehistoric shorelines as well as new laser scanned elevation data have resulted in better 1 Kim von Hackwitz. Member of the research initiative Rethinking Human Nature. Department of Archaeology and Ancient History, Uppsala University, Box 626, 751 26 Uppsala, Sweden.
[email protected]. 2 Niklas Stenbäck. Societas Archaeologica Upsaliensis, Thunbergsvägen 5B, 752 38 Uppsala, Sweden.
[email protected]
3
opportunities to outline and investigate prehistoric landscapes. The objective of this paper is to use new techniques and data in order to gain a better understanding of the formal properties of Neolithic sites in Eastern Central Sweden. This will be done through two case studies.
Outline, theory and method In this paper, we will use a regression equation to recreate the Neolithic shore displacement. The model is based on a shoreline method from archaeological sites combined with an isolation method built on analyses to determine when lakes were isolated from the sea. The benefit of using a regression equation is that the method considers both the isostatic uplift and the eustatic variations. This means that the shoreline reconstructions will be more accurately calculated, especially for larger areas, as the uplift is uneven between different land areas. Further, the shoreline can be modelled from any given BP value which means that a site can be put in its specific time context in terms of shoreline displacement as long as there is a valid BP value (Sund 2010:5–11). The regression equation used here was originally developed by Jan Risberg et al. (2007) and further developed by Camilla Sund for the area of Eastern Central Sweden (Sund 2010). The accuracy of Sund’s model is comparable with that of Risberg et al. (2007; cf. Risberg 2007), but with the advantage of generating a contemporary shoreline over a larger area (Sund 2010:27). It should be noted that Risberg was one of Sund’s supervisor in her development of the model. The model covers the area of Eastern Central Sweden including the provinces of Uppland and Södermanland. In the first case we discuss the accuracy of Sund’s shoreline model in comparison with the shorelines provided by The Geological Survey of Sweden (SGU). In her thesis, Sund states that there is a correlation between her model and the model used by SGU (available through a map generator: http://maps2. sgu.se/kartgenerator/maporder_sv.html), calculated on smaller areas (Sund 2010:27). However, as Sund does not demonstrate this, part of the present study compares the results from her shoreline model with the shorelines provided by SGU. This will be done by using the topography around the site Norslunda and the new elevation data, NNH (see below). We will also investigate the correlation between Sund’s model and the traditional way of producing the shoreline where the different Neolithic chronological phases in Eastern Central Sweden are usually correlated to different elevations owing to the continuous uplift, often with an interval of 5 m.a.s.l., following the topographical map. For example, in southern Uppland, the shorelines is presumed to be at approximately 35 m.a.s.l. for the Middle Neolithic A, 30 m.a.s.l. for Middle Neolithic B and 25 m.a.s.l. for the Late Neolithic. These altitudes are projected onto a modern map or a digital elevation model to create shorelines equal to the time period in question (cf Lekberg 2002:52–58; Stenbäck & Vogel 2010:46–48:Fig. 46–48). In the text, this type of shoreline 4
modeling will henceforward be referred to as “the 5-metre method” to avoid confusion. To test the correctness, Sund’s shoreline model was used to obtain altitude values for the test area according to the different cal BP values; 5250 cal BP, 4450 cal BP and 3950 cal BP marking different periods that will be further discussed below in case two. In the next step, these values were interpolated in ‘ArcGIS 10.1’and subtracted from the elevation data to generate a shoreline curve. The method was presented in a workshop within the Rethinking Human Nature Seminar series by Daniel Löwenborg in January 10, 2012, at the Department of Archaeology and Ancient History. The results were then compared with the shorelines provided by SGU and the shorelines generated by using the 5-metres method. It should be noted that regression models have been criticized, pointing to inaccuracies in the results. However, such criticism is of a technical nature and outside the scope of this paper. For a discussion of the subject, see a forthcoming paper by Löwenborg (in prep.; see also the published review comments by Jan Apel in the Journal logbook). The second case re-examines a hypothesis proposed by Stig Welinder in 1978, concerned with changes in site location during the Middle Neolithic. Using different quantitative methods, Welinder argued that Late Pitted Ware Culture (PWC, 3300–2350 BC) sites were located further out in the ancient archipelago compared with the earlier phase. He interpreted this as an effect of the emerging and competitive Battle Axe Culture (BAC, 2800–2350 BC), which forced the PWC to move towards the outer archipelago. Consequently, the PWC vanished at the end of the period. Since its publication, the hypothesis is more or less considered an archaeological truth and the discussion has not addressed the question whether this really happened – only why (e.g. Malmer 2002; Edenmo 2008; Larsson 2009a: 244–245; Carlsson 2011). In the present article, we will re-examine Welinder’s hypothesis by testing his original approach against reconstructed shorelines constructed from Sund’s shoreline model. The shorelines for this study are equal to the two time periods representing Early PWC, 3300 BC/5250 cal BP and Late PWC, 2500 BC/4450 cal BP (Stenbäck & Vogel 2010).
5
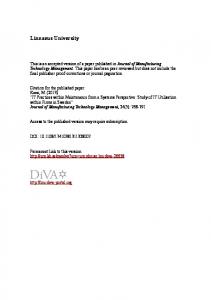
Fig. 1: Right: The location of the research area in Sweden. Left: The Norslunda area used for the NNH discussions marked in the larger research area. http://www.arkeologi.uu.se/digitalAssets/161/161472_fig_001.jpg
Case 1: The Accuracy of Sund’s Shoreline Model One advantage of using Sund’s shoreline model is that it produces a map over a larger area. In previous models, the Uppland province is divided into six smaller areas because of the area’s major regional anomalies. Consequently, the study area displays large differences in shore levels on a regional basis (Risberg 2007:124). For example, the northern part of the investigation area has previously been investigated by Ann Segerberg in her thesis Bälinge mossar – Kustbor i Uppland under yngre stenåldern (1999). One of her main concerns was the shore displacement and Stone Age settlements. Segerberg used the shoreline models constructed by Risberg (1999) and compared them with the radiocarbon dates in the Bälinge mossar area. As a result, the maps presented in her thesis have a shoreline based on 40 m.a.s.l. at the time of Middle Neolithic A (Segerberg 1999:135–145, 39–40, Fig. 16 and 17). However, for the area around the Neolithic site Norslunda in southern Uppland, 50 km south of Bälinge, the same period has a shoreline at 35 m.a.s.l. (Stenbäck & Vogel 2010:46, Fig. 46, se Fig. 7–10). Accordingly, there is a significant difference within the investigation area, which means that it is difficult to compare the entire region simultaneously. For that reason, the area around the Norslunda site will be used as a test area to investigate whether Sund’s model is consistent with the shorelines provided by SGU. 6
The Site Norslunda The Norslunda site in Uppland was investigated by the excavation company Societas Archaeologica Upsaliensis in 2008 owing to the expansion of the airport city Arlandastad (Fig. 1). The archaeological record from the dwelling site is dated to the Middle Neolithic, the Late Neolithic/Early Bronze Age and to the Iron Age. The site is located approximately 28.5–34 metres above the present sea level. During the Middle Neolithic, Norslunda was located near the contemporary shoreline on an island in the archipelago. Owing to the gradual shoreline displacement, the area later became a part of the mainland. The excavation has generated a large assemblage of Neolithic settlement remains such as worked lithics, ceramics and bone fragments. The main part of the pottery is classified as late PWC, although early PWC and some potsherds of BAC, Late Neolithic Pottery and Iron Age Ware were also found (Stenbäck & Vogel 2010). One of the purposes of the investigation was to examine a number of questions related to settlement and landscape traditions. The issues included questions such as: During which phases was the site located on the coast? What kind of activities can be distinguished and how can changes in activities be situated in a chronological perspective? In order to discuss these questions, the site and the material had to be put in the context of the surrounding landscape during the different time periods. To reconstruct the landscape, shoreline models were created using the 5-metres method. The elevation data consisted of the old Geografiska Sverigedata (Geographical Swedish data, see Lantmäteriet: Produktbeskrivning: GSD-Höjddata, grid 50+; Fig. 2). The concluding interpretations of the practices associated with the site, and their change over time were largely based on the shoreline reconstructions and can be summarised as follows: During the Middle Neolithic, the site was transformed from a temporary fishing and hunting site on a smaller islet to a geographically integrated seasonal fishing and hunting site on a larger islet in a diminishing archipelago. As the elevation progressed, the islet expanded and eventually formed a larger island. At the beginning of the Late Neolithic, Norslunda was still located on the contemporary beach and marine hunting and fishing were still performed. The site was probably one of many fishing sites in a larger land use system integrating other activities, such as agriculture. By the end of the Late Neolithic, the shore displacement had transformed the place to an inland site (Stenbäck & Vogel 2010:45–48). Henceforward, the old elevation data will be referred to as “GSD data” not to be confused with the new laser scanned GSD data here referred to as the NNH data (see below).
Using NNH to reconstruct the Neolithic shorelines In order to obtain the best result for this comparative study, the New National Elevation Model (NNH, Sw: Nya Nationella Höjdmodellen) was used for 7
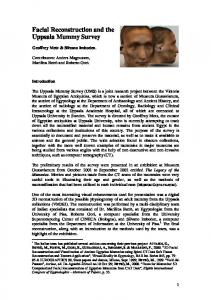
Fig. 2: A reconstruction of the area surrounding the Norslunda site using the 5-metres method and GSD data. Above left: During the MNA using 35 m.a.s.l. Above right: The Norslunda area during the MNB using 30 m.a.s.l. Below: The Norslunda area during the LN using 25 m.a.s.l. Included on the maps are known contemporary sites from each time period (from Stenbäck & Vogel 2010:fig 46–48). Elevation data ©Lantmäteriet i2012/92. http://www.arkeologi.uu.se/digitalAssets/161/161474_fig_002.jpg
reconstructing the shorelines. LIDAR (Light Detection and Ranging) is a remote sensing technology that uses laser to distinguish and measure surface features. In Sweden, the data is accessible through a new high-resolution digital elevation model, NNH. NNH has a high accuracy with a point density of 0.5–1 points per square metre. It is provided in two formats, both in raw LIDAR data and in a comprehensive grid format with two-metre resolution (see Lantmäteriet: Product description: GSD-Elevation data, grid 2+; Product description: Laser data). The benefit of using NNH in the smaller research area is that it can provide a more detailed model of the shore displacement during the Neolithic. Even if the difference in elevation between two periods is minor, the changes of the landscape can be significant and affect the location of the site (cf. Löwenborg 2010:13). For the reconstruction of the Neolithic shoreline in the Norslunda area, we used the grid format. The data was downloaded from the Geographic 8
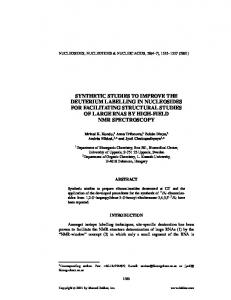
Fig. 3: A reconstruction of the area surrounding the site Norslunda using the 5-metre method and NNH data to indicate different time periods. Norslunda is marked with the black point. A: The shoreline is equal to MNA using 35 m.a.s.l. B: The shoreline is equal to MNB using 30 m.a.s.l. C: The shoreline is equal to LN using 25 m.a.s.l. Elevation data ©Lantmäteriet i2012/92. http://www.arkeologi.uu.se/digitalAssets/161/161476_fig_003.jpg
Extraction Tool (GET) provided by the Swedish University of Agricultural Sciences (SLU). In this case, we compare shore line reconstructions made out of the GSD-Terrain elevation data (grid 50+) and fixed metres above sea level with shore line modelling using NNH data (grid 2+) combined with a regression equation in a smaller area around the Neolithic site Norslunda. In an effort to compare the different methods to reconstruct prehistoric shorelines, we performed a three-step analysis. First, we reconstructed the shorelines for the different time periods using NNH data and simply drew a line between the land and the sea at different elevations comparable with the the 5-metre method in the earlier analysis from the excavation report; 35, 30 and 25 metres above sea level. This generated an accurate view of today´s landscape surface as well as more detailed models for interpreting the location of the Neolithic landscape within the present landscape (Fig. 3). In a comparison between the previous maps created by using the GSD data (Fig. 2) and the maps created by using the NNH data, the difference is not significant for interpreting the site from a landscape perspective. 9
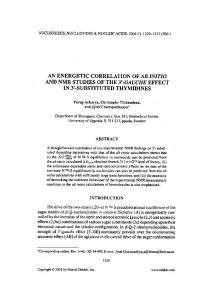
Fig. 4: A reconstruction of how the shoreline changes from the Middle Neolithic A to the end of the Late Neolithic in the area surrounding the Norslunda site using NNH data and Sund´s regression model. Norslunda is marked with the black point. A: The shoreline is equal to 5250 cal BP/MNA. B: The shoreline is equal to 4450 cal BP/MNB. C: The shoreline is equal to 3950 cal BP/LN. Elevation data ©Lantmäteriet i2012/92. http://www.arkeologi.uu.se/digitalAssets/161/161486_fig_004.jpg
Sund´s model and the NNH data were subsequently used to obtain shorelines for the different time periods in the area, as described above. The result shows a correlation with the shorelines created using the 5-metre method with a metre’s difference (Fig. 4). The final step was to compare the result obtained with Sund’s model for a specific BP value with the shorelines provided by SGU for the same period. The year chosen for comparison was 3950BP/2000 BC. The results are shown in Fig. 5. As seen, the regression model developed by Sund gives a result that is more or less consistent with the shorelines provided by SGU. The SGU map has a shoreline at 26 m.a.s.l. and the Sund map has a shoreline at 25.8 m.a.s.l. The minor differences in the compared shorelines seen in Fig. 5 are most likely a result of the SGU map being calculated using the GSD elevation data (50 m), while the Sund map has been calculated using NNH elevation data (2 m). In addition, the SGU map contains lakes that were not included in the Sund map. Hence, the shorelines produced with Sund’s equation correlate with the shorelines provided by SGU. It is therefore reliable to use in the further study. 10
Fig. 5: A comparison between the map created using NNH data and Sund´s regression model and the shorelines provided by SGU (marked with a line) at 3950 cal BP. Elevation data ©Lantmäteriet i2012/92. http://www.arkeologi.uu.se/digitalAssets/161/161488_fig_005.jpg
Case 2: Rethinking Welinder´s Hypothesis? The setting The transition from the Middle Neolithic (3300–2350 BC) to the Late Neolithic (2350–1800 BC) marked a significant change in society and in people’s lifestyles. This can be understood as part of a long and chronologically prolonged Neolithic revolution in the region. In the archaeological record, the PWC as well as the BAC were replaced by the Late Neolithic Culture (LNC, 2350–1800 BC). From a landscape perspective, the change is most apparent in that the Late Neolithic sites in the form of settlements and stone cists congregate in the coastal areas; meanwhile, the stray finds are found all over 11
the landscape, indicating an continuous comprehensive land use (Holm et al. 1997:221–224; Lekberg 2002). Although the Middle Neolithic cultures were both replaced by the LNC, a notable shift took place at the end of the Middle Neolithic. The PWC seems to have been at least partly replaced by the BAC in some areas by this time. The PWC may thus have been pushed out to more peripheral marine areas or have become part of the BAC (e.g. Welinder 1978; Malmer 2002:170; Edenmo 2008:242–243; Carlsson 2011:8–9). One way to investigate the latter hypothesis is through the theory of acculturation. Acculturation is a term used to describe situations where contact between a dominant and a subordinate group results in the erosion of the later group’s culture. A review of literature can be found in Lakey 2003.
The acculturation of the Pitted Ware Culture – Welinder’s hypothesis In his paper ‘The Acculturation of the Pitted Ware Culture in Eastern Sweden’(1978) Stig Welinder presents a hypothesis concerned with the acculturation of the PWC, which since then has had a prominent role for the understanding of the relationship between PWC and BAC. Welinder suggested that not only did the PWC sites follow the declining shoreline; they also became more concentrated to the outer archipelago. This change in location was induced by the expansion of the BAC from the inland out to the inner archipelago. Furthermore, Welinder notes that the relocation of the PWC sites most likely reflects a situation where the resources became fewer and the PWC economy became more specialised, targeting pelagic seal. As a result, the PWC economy became more sensitive to various types of disturbances, and in the end, an acculturation was inevitable. Welinder’s study is based on PWC sites from eastern Sweden (the provinces of Gästrikland, Uppland, Västmanland, Närke and Södermanland) and from the Island of Åland in the Baltic Sea. Welinder arranged the sites according to the Överåda chronology, which he had already suggested (Welinder 1971). This chronology is based on the horizontal distribution of decorated potsherds retrieved from refuse heaps found on the PWC site Överåda in the province of Södermanland. The spatial frequency on the site is interpreted as that potsherds with decorations of vertical lines (o1) are earlier than potsherds with decoration of comb impression (o6) (Welinder 1971:26–63, Welinder 1973:4–22, 82–89; cf. Larsson 2009:101–103). In order to ensure that the interpretation was not the result of local variations, Welinder tested the model on geographically dispersed sites. It was further confirmed on two sites on Åland and corresponded with radiocarbon dates from four different sites in central Sweden. This assured Welinder that the chronology was acceptable as a tool for distinguishing earlier from later PWC (Welinder 1978:102–106). The chronology was then applied to 53 PWC sites in the study area. Sites with a high frequency of shards with o1 decoration were regarded as earlier than sites
12
with a high frequency of shards with o6 decoration. Mixed sites were perceived as of intermediate age (Welinder 1978:101–102). The main objective of Welinder’s study was to distinguish between the inner and the outer archipelago by denoting the proportion of land and sea surrounding the PWC sites from different time-periods. The proportion of land and sea was calculated by superimposing a rectangular grid with 500m squares on a map in scale 1:50,000 after a method described by Fogelvik (1973). Welinder does not account for how the map has been modified to reflect the contemporary shoreline. For each of the 53 sites he used a 4 km radius for estimating the area of land and sea surrounding the site. The sites fell into three groups, which also reflected a gradient from the inner to the outer archipelago: 1. Sites surrounded by 0–40% of sea (19 sites) 2. Sites surrounded by 41–65% of sea (20 sites) 3. Sites surrounded by more than 65% of sea (14 sites) Welinder found that the early PWC sites were found in areas 1–2, while the late sites were found in all areas, although predominantly in area 3 (Welinder 1978:107, Fig. 15). He interpreted this as reflecting a process in which …a territorial expansion of the farming area of the Battle Axe culture into the traditional hunting-gathering area of the Pitted Ware culture in the inner archipelago, a competition which forced the Pitted Ware groups to move towards the outer archipelago (Welinder 1978:109)
As the PWC disappears from the archaeological record, Welinder´s conclusion was that ‘… the Pitted Ware culture did not survive in the economically and territorially margin position within the landscape described above’ (Welinder 1978:110). In other words, Welinder argued that the results pointed to an acculturation of the PWC owing to the expansion of the BAC. His explanation was in line with the main view within anthropology at the time, stressing the idea of acculturated hunter-gatherers as a result of expanding agricultural groups (cf. e.g. the discussion in Lindholm 2006:37–52). However, the archaeological and geological data used by Welinder in 1978 were sparse. Only a few radiocarbon-dated sites were available and the contemporary reconstructions of the Middle Neolithic shoreline most likely did not consider different geological factors. Today, more archaeological data is available, and more advanced methods, e.g. GIS, for reconstructing and analysing the data has been developed. Although Welinder has always embraced new data and methods and thus developed his view on the issue (Welinder 1998), his hypothesis concerning the PWC sites as being pushed out into the periphery by the emerging BAC is still apparent in the literature (e.g. Malmer 2002; Edenmo 2008; Larsson 2009a: 244–245; Carlsson 2011). Therefore, we aim to re-evaluate his hypothesis by using new archaeological and geological data and GIS methodology. 13
The material – Early and Late Pitted Ware in the Fagervik chronology The intention of our study was to use the same PWC sites as used by Welinder in order to set up a comparable database. However, this has proved difficult, since some of the site locations are uncertain and therefore not suitable for this analysis. Owing to the geographical delimitations of the regression equation (see above), our research area is limited to Eastern Central Sweden (Fig. 1). In this paper, the more frequently used Fagervik chronology will be applied to distinguish between early and late PWC pottery, since it more or less corresponds with the Överåda chronology. However, the Fagervik chronology is more detailed and thus more suitable for differentiation between early and late sites. The Överåda chronology characterises decorations of comb impressions (o6) as late pottery. In the Fagervik chronology, comb impression occurs in both Fagervik III and Fagervik IV. However, Fagervik III was present during the entire Pitted Ware phase, while Fagervik IV is dated to the later part (Fig. 6). For that reason, using the Överåda chronology will not show a comparison between early and late sites, but between early sites and sites covering the entire Middle Neolithic. The Fagervik chronology was developed by Axel Bagge (1951). It is based on the results from an excavation in 1935 on the Fagervik site in Östergötland parish, just south of the research area. The purpose of the investigation was to determine the chronological phases of the PWC by establishing the horizontal stratigraphy of different pottery styles, similar to what Welinder later did at Överåda. The chronology includes five styles, Fagervik I–Fagervik V, ranging from the Early Neolithic to the Middle Neolithic/Late Neolithic. The pottery styles Fagervik II–Fagervik IV denotes PWC pottery (Fig. 6; Edenmo et al. 1997:175–178; Segerberg 1999: 72–77; Malmer 2002:77–81; Stenbäck 2003:75–81; Larsson 2006:19–21; Papmehl-Dufay 2006:63; Larsson 2009:94–100). Early and late PWC sites were separated using the Fagervik II and Fagervik IV as chronological markers. This is based on the presumption that these styles were never concurrent. By the time of use of Fagervik II pottery, the shoreline is equal to 3300 BC and by the time of use of Fagervik IV pottery, the shoreline is equal to 2500 BC (Fig. 6). Even if the Fagervik III-style is also defined as late PWC, it will not be included in this study, since it overlaps and is partly concurrent with Fagervik II (Hallgren 2011:36–38). In total, 39 sites have been used in the study; 23 of the sites contained early PWC pottery, 9 contained late PWC pottery and 7 contained both Fagervik II and IV (Figs 7 and 8, Tab. 1 and 2).
14
Fig. 6: A chronological model over the different pottery styles in the region (from Stenbäck & Vogel 2010). http://www.arkeologi.uu.se/digitalAssets/161/161478_fig_006.jpg
Using Sund’s shoreline model to re-investigate Welinder’s hypothesis The shorelines were modelled using Sund’s regression equation as described above. In order to mirror Welinder’s methodology, each site was given a buffer area with a radius of 4 km. The calculations of the surrounding land and sea area were subsequently done using the reconstructed shorelines and then summarizing polygons within polygons, i.e. counting the total areas of land and water within each single buffer. It should be noted that the analysis did not include smaller streams, bays and lagoons, but only the actual sea floor. For that reason, the estimated percentage of the surrounding water may be somewhat misleading. However, if a site was surrounded by streams or other inland water bodies rather than by the actual sea, it would be placed in the inner archipelago and the aim of the method was to distinguish the inner and the outer archipelago (cf. Welinder 1978:99). The result is presented in table 1 and 2 and in the diagrams in Fig. 9, where the sea area for each buffer is given in percentages.
15
Fig. 7: The discussed sites containing Fagervik II pottery. The shoreline is equal to 5250 cal BP/ 3300 BC. The numbers correspond with Table 1. Elevation data ©Lantmäteriet i2012/92. http://www.arkeologi.uu.se/digitalAssets/161/161490_fig_007.jpg
16
Fig. 8: The discussed sites containing Fagervik IV pottery. The shoreline is equal to 4450 cal BP/ 2500 BC. The numbers correspond with Table 2. Elevation data ©Lantmäteriet i2012/92. http://www.arkeologi.uu.se/digitalAssets/161/161492_fig_008.jpg
17
Nr
Province
Site
RAÄ
Sea (%)
1
Gästrikland
Sofiedal 11
Valbo 478
32
2
Södermanland
Brunn / Djursnäs
Ösmo 96
60
3
Södermanland
Djupvik
Västerljung 207
62
4
Södermanland
Ekla
Bogsta 78
44
5
Södermanland
Häggsta IV*
Botkyrka 352
42
6
Södermanland
Korpberget
Huddinge 383
59
7
Södermanland
Masmo
Huddinge 132
44
8
Södermanland
Moäng N
Husby-Rekarne 21
39
9
Södermanland
Sittesta*
Ösmo 68
48
10
Södermanland
Sköttedal
Trosa-Vagnhärad 254
77
11
Södermanland
Strålsjön
Nacka 118
41
12
Södermanland
Överåda*
Trosa-Vagnhärad 263
72
13
Uppland
Fembäcke
Vendel 292
52
14
Uppland
Högmossen
Tierp 85
69
15
Uppland
Lappdal
Österåker 461
45
16
Uppland
Mjölkbo
Österunda 47
36
17
Uppland
Norslunda*
Norrsunda 223
79
18
Uppland
Persbo
Skuttunge 138
46
19
Uppland
Postboda 1
Tierp 238
46
20
Uppland
Postboda 2
Tierp 239
41
21
Uppland
Postboda skjutbanan
Tierp 356
52
22
Uppland
Snåret*
Vendel 291
45
Table 1: Percentage of sea area in each site buffer holding a Fagervik II-site. The marked sites also include Fagervik IV. http://www.arkeologi.uu.se/digitalAssets/161/161462_tab_001.pdf
18
Nr
Province
Site
RAÄ
Sea (%)
1
Gästrikland
Skuggan
Valbo 86
53
2
Södermanland
Fållnäs skola
Sorunda 681
50
3
Södermanland
Häggsta VI*
Botkyrka 352
33
4
Södermanland
Igelsta
Östertälje 279
44
5
Södermanland
Korsnäs
Grödinge 447
16
6
Södermanland
Sittesta*
Ösmo 68
29
7
Södermanland
Överåda*
Trosa-Vagnhärad 263
62
8
Uppland
Brännpussen
Tensta 436
56
9
Uppland
Norslunda*
Norrsunda 223
58
10
Uppland
Snåret*
Vendel 291
13
11
Uppland
Tibble
Björklinge 67
54
12
Uppland
Torslunda nedre
Tierp 315
56
13
Uppland
Vendel
Vendel 289
61
14
Västmanland
Bollbacken
Tortuna 258
58
15
Östergötland
Fagervik*
Krokek 23
48
16
Östergötland
Säter*
Kvarsebo 13
46
Avarage
46%
Table 2: Percentage of sea area in each site buffer holding a Fagervik IV-site. The marked sites also include Fagervik II. http://www.arkeologi.uu.se/digitalAssets/161/161464_tab_002.pdf
The result of our study differs significantly from Welinder´s results. None of the younger sites were surrounded by more than 65 per cent sea area. Instead, four of the older sites were placed in the outer group: Sköttedal: 77 per cent, Överåda: 72 per cent, Högmossen: 69 per cent and Norslunda: 79 per cent. According to the original hypothesis, they should have had a low percentage as being early sites and therefore more likely to be located in the inner archipelago. Looking at the separate groups, the early sites show a range from 32–79 per cent, while the range within the group of late sites is between 13–61 per cent. In other words, the location of the sites shift over time, from an area 19
Fig. 9: The diagram shows the divergence in site placement between the Early and Late PWC sites according to percentage of surrounding sea. http://www.arkeologi.uu.se/digitalAssets/161/161480_fig_009.jpg
covering mostly the middle and the outer archipelago to an area covering the inner and the middle archipelago. However, the average per cent of sea area within each site group is 46 per cent. These figures comply with the results showing that both the early and the late groups placed the majority of its sites in topographical group 2, i.e. surrounded by 41–65% sea (see table 1 and 2): 1. Sites surrounded by 0–40% of sea (7sites) 2. Sites surrounded by 41–65% of sea (28 sites) 3. Sites surrounded by more than 65% of sea (4 sites) In other words: there is no great difference in location between the early and the late sites seen to the entire region and to the entire groups. However, on a local scale there are significant differences, as there is a wide span in the group of early PWC sites as they are encountered far out in the outer archipelago and in the inner archipelago, i.e. in all three of Welinder’s topographical groups. The late PWC sites, which, according to Welinder’s hypothesis should be located in the outer archipelago, seem to avoid the outer archipelago and are instead found in Welinder’s groups 1 and 2. Consequently, the results of our study contradict Welinder’s hypothesis, as the sites that would be most exposed to the sea are also found within the early group, while the late group is found in the more retracted areas. Taking into account the appearance of the BAC, the location pattern indicates some form of interaction between the two cultures, instead of a confrontation: As the BAC sites appear in the inland, the PWC sites seem to abandon the outer
20
Fig. 10: The diagram shows the relationship according to percentage of surrounding sea at sites that were in use during both early and late PWC. http://www.arkeologi.uu.se/digitalAssets/161/161482_fig_010.jpg
archipelago in favour of the inner archipelago, establishing a stronger spatial relationship to the inland. These changes in site location during late MN should therefore be understood as based on a relationship between the different topographical regions rather than reflecting an explanation emphasising acculturation. In addition, it should be noted that there are 7 sites that have both early and late PWC. As Sweden has a consistent regression, the logical scenario would be that the process transformed the local landscapes around these sites from being surrounded by gradually lesser amount of sea area. Hence, sites that were in use during both early and late PWC were at first located in the outer archipelago and later located in the inner archipelago (Tab. 1 and 2; Fig. 10). Consequently, repeating Welinder’s methodology by a refined chronology and a GIS analysis based on a new method for calculating the regression, our analysis does not verify a displacement of the late PWC to remote marine areas towards the end of the Middle Neolithic.
Changing Landscapes As stated in the introduction, the sites’ formal properties are regarded as important factors in the interpretation of the site. As they form a basis for the actions being performed, we wanted to develop the question by discussing the Neolithic site from a perspective of continuity in placement and performance. In the first case, where Sund’s regression equation was tested against the SGU model, the shoreline in the area around the site Norslunda were 21
reconstructed to reflect three subsequent periods; Middle Neolithic A, B and Late Neolithic. At the same time as the land-elevation provided more land and less water the Norslunda site continued to be a shore bound activity site (Fig. 4). Hence, even though the settings changed for the larger area, the formal properties of Norslunda stayed the same until the Late Neolithic. On the other hand, the Late Neolithic is generally regarded as a period characterised by a new economy based on agriculture. This leads to a relocation of the settlements and the most obvious change is that the sites no longer follow the declining shore but are located higher up in the terrain, about 30–40 m.a.s.l. (Holm et al. 1997:222). Consequently, a clear shift is visible in the land use from the Middle Neolithic period. It has been suggested that this relocation of the settlements leads to a division of the landscape with careful consideration to different aspects; pastures, fields, water, fishing, raw material, cultural praxis etc. (Edenmo 2000:21). Within this land use system, Norslunda is interpreted as one of many fishing and maritime hunting sites with a spatial relationship to earlier maritime sites (Stenbäck & Vogel 2010). We suggest that one reason for the location of the Late Neolithic Norslunda site is the vicinity to previously used maritime sites that retain their resource attributes. In the second case concerned with the location of early and late PWC sites and Welinder’s hypothesis, the analysis highlighted that 7 out of 39 sites show continuity from Middle Neolithic A–B. A topographic survey, where the shorelines and sites from the two time periods were correlated, showed that the transgression did not lead to changed circumstances in terms of proximity to the sea at these sites (Fig. 11). Most of the sites remained shore bound. However, one site in the northern part of the research area was located at some distance from the sea in both periods (Fig. 11:A). Again, we want to suggest that this continuity in the site’s formal properties may be one reason for the upheld continuity as the settings did not change – hence the activities could still be performed at the same location. This is also the reason why the present analysis showed a relocation of the younger PWC sites to the inner archipelago as some places continue to be used. Consequently, they were surrounded by less water owing to the land elevation. Nevertheless, it should be noted that some sites were abandoned, even though the location remained seemingly unchanged. This is particularly evident at the island of Södertörn (Fig. 11:C). Consequently, as the overall landscape changed over time owing to the shore displacement, it is evident that some sites remained unchanged both in terms of topography and in terms of performance. For this reason, a landscape perspective and the use of new methods and data to locate the sites in the prehistoric landscape may provide valuable information on prehistoric land use and site performances.
22
Fig. 11: A survey of the sites containing Fagervik II and IV pottery. A: Snåret, B: Norslunda, C: Häggsta and Sittesta, D: Överåda, E: Fagervik and Säter. Elevation data ©Lantmäteriet i2012/92. http://www.arkeologi.uu.se/digitalAssets/162/162431_fig_011.jpg
Acknowledgements The work was sponsored by the Swedish Research Council, Societas Archaeologica Upsaliensis and the Åke Wiberg foundation. Many thanks to Dr Åsa M Larsson, Dr Karl-Johan Lindholm and Dr Daniel Löwenborg who kindly read and provided valuable comments on the manuscript.
References
Bagge, A. 1951. Fagervik – Ein Rückgrat für die Periodeneinteilung der Ostschwedischen Wohnplatz – und Bootaxtkultur aus dem Mittelneolithikum. Eine vorläufige Mitteilung. Acta Archaeologica XXII. Copenhagen. Bowser B., J. & Zedeño, M., N. & 2009. The archaeology of meaningful places. In: B. J. Bowser & M. N. Zedeño. The archaeology of meaningful places. Salt Lake City: University of Utah Press. Pp 1–14. 23
Carlsson, A. 2011. Gropkeramikerna – några inledande ord. In: P. Bratt & R. Grönwall (eds). Gropkeramikerna. Rapport från ett seminarium 2011 [Arkeologi i Stockholms län Nr. 6]. Stockholms länsmuseum. Pp 6–9. Edenmo, R et al. 1997. R. Edenmo, M. Larsson, B. Nordqvist, & E. Olsson. Gropkeramikerna – Fanns de? Materiell kultur och ideologisk förändring. In: M. Larsson & E. Olsson (eds). Regionalt och Interregionalt. Undersökningar i Syd- och Mellansverige [Arkeologiska undersökningar, skrifter 23]. Stockholm: Riksantikvarieämbetet. Pp. 135–205. Edenmo, R. 2000. Gylleundersökningarna. Förändringar i gravskick och bosättning under sten- och bronsåldern i Skåne. Projekt Uppdragsarkeologi. Rapport nr 2000:2. Riksantikvarieämbetet. Edenmo, R. 2008. Prestigeekonomi under yngre stenåldern. Gåvoutbyten och regionala identiteter i den svenska båtyxekulturen. [OPIA 43]. Uppsala University. Fogelvik, S. 1973. Kulturlandskap i omvandling: en kvantitativ studie av dynamiken och det rumsliga förloppet i de senaste decenniernas kulturlandskapsomvandling baserad på material omfattande Östergötland jämte delar av angränsande län [FAK 8]. Stockholm University. von Hackwitz, K. 2010. What Makes a Place? Feature Perspectives on Site Locations. In: Å.M. Larsson & L. Papmehl-Dufay (eds). Uniting Sea II – Stone Age Societies in the Baltic Sea Region [OPIA 51]. Uppsala University. Pp 195–210. von Hackwitz, K. 2012. The Creation of Regions: An Alternative Approach to Swedish Middle Neolithic Boundaries and Cultures, Norwegian Archaeological Review, 45:1. Pp 52–75. Hallgren, F. 2011. Om gropkeramik och dess relation till äldre keramikhantverkstraditioner kring Östersjön. In: P. Bratt & R. Grönwall (eds). Gropkeramikerna. Rapport från ett seminarium 2011 [Arkeologi i Stockholms län Nr. 6]. Stockholm: Stockholms länsmuseum. Pp 31–44. Holm, et al. 1997. L. Holm, E. Olsson & E. Weiler. Kontinuitet och förändring i senneolitikum. In: M. Larsson & E. Olsson (eds). Regionalt och Interregionalt. Undersökningar i Syd- och Mellansverige [Arkeologiska undersökningar, skrifter 23]. Stockholm: Riksantikvarieämbetet. Pp. 215–264. Lakey, P., N. 2003. Acculturation: a Review of the Literature. Journal of Intercultural Communication Studies XII–2. Pp 103–118. Larsson, M. 2006. A Tale of a Strange People. The Pitted Ware Culture in Southern Sweden [Kalmar Studies in Archaeology vol 2. Report Series No. 96]. University of Lund. Larsson , Å., M. 2009a. Pots, Pits, and People. Hunter-Gatherer Traditions in Neolithic Sweden. In: D. Gheorghiu (ed.) Early Farmers, Late Foragers, and Ceramic Traditions: On the Beginning of Pottery in the Near East and Europe. Cambridge: Cambridge Scholars Publishing. Pp 239–270. Lekberg, P. 2002. Yxors liv – Människors landskap. En studie av kulturlandskap och samhälle i Mellansveriges senneolitikum [Coast to Coast books 5]. Uppsala University. Lindholm, K-J. 2006. Wells of Experience: A pastoral land-use history of Omaheke, Namibia [Studies in Global Archaeology 9]. Uppsala University. Löwenborg, D. 2010. Excavating the Digital Landscape. GIS analyses of social relations in central Sweden in the 1st millennium AD [Aun 42]. Uppsala University. Löwenborg D. In prep. Paleogeography and shore displacement north of the central Lake Mälaren basin deduced from multiproxy studies during the last 3000 years. 24
Malmer, M., P. 2002. The Neolithic of South Sweden TRB, GRK and STR. Stockholm: Royal Swedish Academy of Letters, History and Antiquities. Papmehl-Dufay, L. 2006. Shaping an Identity. Pitted Ware pottery and potters in southeast Sweden [Thesis and Papers in Scientific Archaeology 7]. Stockholm University. Risberg, J. 1999. Strandförskjutningen i nordvästra Uppland under subboreal tid. Appendix 4. In: A. Segerberg. Bälinge mossar: kustbor i Uppland under yngre stenålder [AUN 26]. Uppsala University. Pp 233–241. Risberg, J. 2007. Strandförskjutningen i centrala/norra Uppland i relation till omlandet. In: E. Hjärnet-Holder, H. Ranehed & A. Seiler (eds). Land och samhälle i förändring. Uppländska bygder i ett långtidsperspektiv. [Arkeologi E4 Uppland. Studier 4]. Uppsala: Riksantikvarieämbetet. Risberg et al 2007. J. Risberg, G. Alm, N. Björck & M. Guinard. Synkrona paleokustlinjer 7000–4000 kal. BP i mellersta och norra Uppland. In: N. Stenbäck (ed.). Stenåldern i Uppland. Uppdragsarkeologi och eftertanke [Arkeologi E4 Uppland. Studier 1]. Uppsala: Riksantikvarieämbetet. Schiffer, B & Skibo, J., M.. 1997. The Explanation of Artefact Variability. American Antiquity Vol. 62:1. Pp. 27–50. Segerberg, A. 1999. Bälinge mossar: kustbor i Uppland under yngre stenålder [AUN 26]. Uppsala University. Stenbäck, N. 2003. Människorna vid havet. Platser och keramik på ålandsöarna perioden 3500–2000 f. Kr [Stockholm Studies in Archaeology 28]. Stockholm University. Stenbäck, N & Vogel, P. 2010. Norslunda – en mellan- och senneolitisk fångstboplats i södra Uppland samt stensträng från järnålder [SAU rapport 2009:11]. Uppsala. Sund, C. 2010. Palegrafiska förändringar i östra Svealand de senaste 7000 åren [NKA 16]. Stockholm University. Welinder, S. 1971. Överåda. A Pitted Ware Culture Site in Eastern Sweden. Meddelande från Lunds Universitets Historiska Museum.1969—1970. Pp 5–98. Welinder, S. 1973. The radiocarbon age of the Pitted Ware Culture in Eastern Sweden. Meddelande från Lunds Universitets Historiska Museum 1971–1972. Pp 107–119. Welinder, S. 1978: The Acculturation of the Pitted Ware Culture in Eastern Sweden. Meddelande från Lunds Universitets Historiska Museum 1977–78. Pp 98–110. Welinder, S. 1998. Neoliticum och bronsåldern. In: J. Myrdal (ed). Det svenska jordbrukets historia. Band 1. Jordbrukets första femtusen år: 4000 f.Kr.–1000 e.Kr. Stockholm: Natur & Kultur. Pp 11–236. Zedeño, M.N., 2000. On what people make of places: a behavioural cartography. In: M., B.Schiffer (ed.). Social theory in archaeology. Salt Lake City: University of Utah Press. Pp 97–111.
Web sites: Lantmäteriet. 2012. Produktbeskrivning: GSD-Höjddata, grid 50+. http://www.lantmateriet.se/Global/Kartor%20och%20geografisk%20information/ H%C3%B6jddata/Produktbeskrivningar/hojd50plus.pdf Lantmäteriet. 2012 Product description: GSD-Elevation data, grid 2+ http://www.lantmateriet.se/upload/filer/kartor/kartor_och_geografisk_info/GSDProduktbeskrivningar/eng/e_grid2_plus.pdf 25
Lantmäteriet. 2012 Product description: Laser data http://www.lantmateriet.se/ upload/filer/kartor/kartor_och_geografisk_info/Hojdinfo/Prod-beskrivn/eng/ LiDAR_data.pdf Sveriges Geologiska undersökningar. Kartgeneratorn http://maps2.sgu.se/kartgenerator/maporder_sv.html
26