Urban Ecosyst (2013) 16:763–782 DOI 10.1007/s11252-012-0270-3
Urban ecosystems and sustainable urban development—analysing and assessing interacting systems in the Stockholm region Ulla Mörtberg & Jan Haas & Andreas Zetterberg & Joel P. Franklin & Daniel Jonsson & Brian Deal
Published online: 28 October 2012 # Springer Science+Business Media New York 2012
Abstract In order to build competence for sustainability analysis and assessment of urban systems, it is seen as essential to build on models representing urban form, landuse and transportation, urban metabolism, as well as ecological processes. This type of analysis of interacting sub-systems requires an advanced model integration platform, yet open for learning and for further development. Moreover, since the aim is to increase urban experience with ecosystem management in the wide sense, the platform needs to be open and easily available, with high visualisation capacity. For this purpose, the LEAM model was applied to the Stockholm Region and two potential future scenarios were developed, resulting from alternative policies. The scenarios differed widely and the dense urban development of Scenario Compact could be visualised, destroying much of the Greenstructure of Stockholm, while Scenario Urban Nature steered the development more to outer suburbs and some sprawl. For demonstration of the need for further development of biodiversity assessment models, a network model tied to a prioritised ecological profile was applied and altered by the scenarios. It could be shown that the Greenstructure did not support this profile very well. Thus, there is a need for dynamic models for negotiations, finding alternative solutions and interacting with other models. The LEAM Stockholm case study is planned to be further developed, to interact with more advanced transport and land use models, as well as analysing energy systems and urban water issues. This will enable integrated sustainability analysis and assessment of complex U. Mörtberg (*) : A. Zetterberg Environmental Management and Assessment Research Group, Department of Land and Water Resources Engineering, KTH Royal Institute of Technology, 10044 Stockholm, Sweden e-mail:
[email protected] J. Haas Division of Geoinformatics, Department of Urban Planning and Environment, KTH Royal Institute of Technology, 10044 Stockholm, Sweden J. P. Franklin : D. Jonsson Department of Transport Science, KTH Royal Institute of Technology, 10044 Stockholm, Sweden B. Deal Department of Urban and Regional Planning, University of Illinois at Urbana-Champaign, Champaign, IL 61820, USA
764
Urban Ecosyst (2013) 16:763–782
urban systems, for integration in the planning process in Stockholm as well as for comparative sustainability studies between different cities, with the goal to build more sustainable urban systems and to increase urban experiences in ecosystem management. Keywords Urban ecosystems . Urban development . Interacting urban systems . Biodiversity . Ecosystem services . Model integration
Introduction Major societal concerns today represent a broad array of interests: climatic change, energy systems shifts toward sustainable and renewable sources, halting the rapid loss of biodiversity, and safeguarding ecosystem services. In all cases, cities are central to both our understanding of the problem and its resolution. They are vital to the development of human systems and dominate the flows of energy and materials on a global scale, for instance, cities at present account for more than two-thirds of the global primary energy consumption, of which transport constitutes a major part (International Energy Agency 2008; Keirstead and Schulz 2010). Since half of the world’s population now lives in urban areas, the needs, ideas and abilities of their inhabitants cause and direct these flows through their activities, and the associated impacts have major significance (Grimm et al. 2008). The metabolism, or the flows and storage of energy and materials (Kennedy et al. 2007), of cities are highly dependent on the ecosystem services of urban and periurban landscapes, involving also surrounding regions. The development of energy and transport technology however, has increased the scale and complexity of urban flows to include global resource webs, and has also served to enlarge the size of the urban regions themselves. Current trends such as increasing use of renewable energy sources and decentralised energy supply systems may be increasing dependence on regional ecosystem services and placing a greater focus on local facilities. Subsequently a given urban metabolism can have both global and local impacts and is vulnerable to regional system limits as well as to global change. The organization of energy- and resource efficient cities will therefore put particular demands on the spatial structure of urban systems, with urban form, land use and transport demands as important components (Balfors et al. 2005; Batty 2008; Deal and Pallathucheril 2009). Simultaneously, the ecosystem processes that urban and urbanising landscapes host can deliver essential ecosystem services, such as moderation of micro-climate, water retention and infiltration, as well as cultural and recreational values (Breuste et al. 2011). Ecosystem services are, in turn, intricately linked to resource use and biodiversity, factors that can not only create amenities but actually determine the liveability of the urban landscapes. The importance of biodiversity and ecosystem services in urban areas has been recognized as a priority for sustainable development activities (UNEP 2007; Convention on Biological Diversity, CBD, COP10 Decision). Thus, ecosystem services are fast becoming an issue of concern as urban regions change and the pressure on land from competing land use interests increases. The function of ecosystems depend on the landscape patterns emerging in urban and urbanising regions, which can be seen as complex mosaics of more or less natural habitat and built-up areas (e.g. Wu et al. 2012). Ecological processes that are affected by urban landscape patterns are for instance climatic, hydrologic, geomorphologic and biogeochemical processes as well as biotic interactions, influencing functions such as primary production, hydrologic functions, nutrient cycling, disturbances, habitat provision and biodiversity (Pickett et al. 2001; Alberti 2008).
Urban Ecosyst (2013) 16:763–782
765
For sustaining biodiversity in urban landscapes, not only habitat amount but also connectivity is essential, meaning a property of landscapes that facilitates or limits the movement of resources and organisms (Forman and Godron 1986). Thus, since urbanisation most often imposes decrease in habitat amount and connectivity, while increasing fragmentation and disturbances, and compounded by the fact that cities are often situated in speciesrich regions (Luck 2007) and can host a wide variety of species (McKinney 2008), the ongoing worldwide urbanisation process has been recognised as a major threat to biodiversity (e.g. McKinney 2002; Ricketts and Imhoff 2003). Concurrently cities can, with ecologically informed policy and planning, play an increasingly important role in sustaining the world’s species and associated ecosystem services (Rosenzweig 2003; Dearborn and Kark 2010). Higher emphasis on ecosystem functions in urban policy and planning is therefore urgently needed. Indeed, an ecosystem approach to urban development has been advocated by e.g. van Bueren et al. (2012), trying to find practical solutions to sustainability problems in urban development. In such an ecosystem approach, however, the high complexity of the interactions and feedback between urban systems and ecosystems are not yet fully understood, for instance concerning the spatial dimension, but still would need to be captured. One of the apparent contradictions for sustainable urban development policy, where these interacting systems need to be addressed, concerns the dichotomy between moving towards dense, energy-efficient cities versus cities with a vast greenstructure, designed to host ecosystem services and biodiversity where people live and work. Dense cities are considered to be more energy-efficient through shorter transportation distances and other infrastructural benefits, while urban sprawl, with characteristic low density and high car dependency, leads to high energy and land consumption and has been seen as a result of, among other things, weak and/or decentralised planning systems (European Environment Agency 2006). However, dense cities are of course highly dependent on surrounding ecosystems and other solutions may be necessary for sustainable urban systems. To plan for a greenstructure or ecological network with core nature areas and connectivity zones is one such way (Jongman et al. 2004; Opdam et al. 2006), however often depending on protection of designated areas and thus not very dynamic or flexible as a planning tool. Therefore, models and tools that can embrace and integrate both urban systems and ecosystems on system-wide levels, in a dynamic way, would be necessary to properly address these questions (see e.g. Boone et al. 2012). Moreover, among the rationale for the recognition of the importance of biodiversity and ecosystem services in urban areas (e.g. CBD, COP 10 Decision), is that urbanisation increasingly concentrates decision-making and resource availability in cities, so that urban systems and urban management experiences actually influence policies and strategies at much larger scales. Grimm et al. (2008) considered cities to be microcosms of the kinds of changes that are happening globally, making them informative test cases for understanding social-ecological system dynamics and responses to change. In relation to this, it has been widely accepted that so called technocratic approaches have been largely ineffective in dealing with the challenges of urbanization, whereas new approaches to planning can only be meaningful and effective if they are participatory and inclusive, as well as linked to contextual socio-political processes (e.g. United Nations 2009). Therefore, participatory approaches with stakeholder engagement in policy discussions are necessary for creating sustainable urban development policies.
766
Urban Ecosyst (2013) 16:763–782
Aim The overall objective of this research is to assess the sustainability of urban development policies in the Stockholm Region. To accomplish this, we develop models and tools for integrated sustainability analysis, that can integrate urban systems and ecosystems and that are useful as decision support in participatory policy assessment and planning processes. The aim of this paper is to provide an overview of existing modelling approaches that are useful for policy assessment of alternative urban development scenarios, and to demonstrate these possiblities by an integrated modelling approach in general and the integration of a dynamic landscape ecological model in particular, in a case study for the Stockholm Region. For the case study we used the LEAM modelling framework in this collaborative project between the LEAM laboratory at the University of Illinois, Urbana-Champaign and KTH Royal Institute of Technology in Stockholm, Sweden. Within the LEAM Stockholm case study, two scenarios for future urbanisation were analysed, derived from different urban development policies with different urban growth principles and ambitions for urban nature, and the impacts of these on a prioritised ecological profile were demonstrated. The two scenarios built on policy discussions from earlier regional planning processes and were used in stakeholder discussions in preparation for an updated Regional Development Plan for the Stockholm Region. Thus, the LEAM Stockholm case study aims to be a start of an Urban Sustainability Laboratory, to serve as a decision support node for sustainable urban development of the region, as well as a framework for initiating comparative studies between cities.
Model-based urban sustainability analysis and assessment In order to build more sustainable urban systems and to increase urban experiences in ecosystem management, an integrated analysis and sustainability assessment of complex urban systems is necessary (e.g. Kates et al. 2001; Ruth and Coelho 2007; Alberti 2010). Further, a down-scaling to particular regions and landscapes will be essential for understanding the interaction between urban systems and ecosystems, as well as human perceptions of liveable landscapes (Tzoulas et al. 2007; Wu 2008; Qureshi et al. 2010). Models and tools for analyzing and assessing complex urban systems have taken many different forms and approaches, including: urban metabolic models, urban growth and land use models, transport models and landscape ecological models. All of these have different applications and reach, and take somewhat different approaches to modeling the key phenomena. Further, varying degrees of integration between models have been developed (see e.g. review in Ruth and Coelho 2007). Urban metabolic analyses and models address the flow and storage of energy and materials, and involve a multitude of approaches, applied to (among others): energy systems (e.g. Heaps 2008; Nissing and von Blottnitz 2010; Zhang et al. 2011), urban water systems (e.g. Yates et al. 2005; El-Sayed Mohamed Mahgoub et al. 2010) and urban green infrastructure (e.g. Spatari et al. 2011; Strohbach et al. 2012). Bazilian et al. (2011) developed an integrated modelling approach to the nexus of energy, water and food resources, for effective provision of policy support and increased welfare. These types of metabolic approaches are generally not spatially explicit, hence the down-scaling and linking to specific landscapes remain to be developed. Land use and transport models, for the most part, are based on economic principles of agents making rational choices that optimize their own utilities: in transport, drivers choose the shortest (or cheapest) path to work; while in land use, residents choose to live where they
Urban Ecosyst (2013) 16:763–782
767
can find an optimal balance between access, quality, and affordability. The predominant practices in transport modeling and land use modeling are different, though in many cities there are now operational models that integrate the two (Klosterman 2012; Deal and Pallathucheril 2008). Urban transport models focus on day-to-day operations of the roadway and public transport systems. In the spatial manifestation of transport models, some of the most important aspects are: that travel is generally motivated by a need to move about in a city, and this demand is tied to the location of residences and workplaces; that performance problems in the transport system, especially congestion, occur when many people want to use the same part of a transport network at roughly the same time; and that many of the downstream problems that emerge from transport, such as vehicle emissions, noise and ecological impacts, are tied to the specific use and operation of the transport system across space. Further, downstream concerns that are not necessarily spatial, such as energy consumption, can also be assessed. Most travel behavior is quite dynamic, with travelers responding quickly to changes in the system (see Beser and Algers 2002; Ortúzar and Willumsen 2001) so travel models are important when evaluating policy impacts, such as the energy-efficiency of urban form alternatives. Land use modeling, on the other hand, considers how urban areas evolve over long periods of time, when decisions about zoning, land development, household relocation, and firm relocation can accumulate to such an extent that the basic form of the city is altered (e.g. Rui and Ban 2011). According to classical bid-rent theory, starting with von Thünen (1826), such alterations should be keenly sensitive to the access to jobs and services (for households) and access to labor and business linkages (for firms) that is provided by the transport system. The potential effects of transport decisions on urban development have been priorizited in many regional planning processes, leading to complex models of land use development, the most advanced of which can be considered to be UrbanSim (Waddell et al. 2007), Pecas (Hunt and Simmonds 1992), and LEAM (Deal and Pallathucheril 2008). Both UrbanSim and Pecas have taken substantial time and resources to implement in a particular city, and require significant processing time and maintenance even after implementation, leading many regional planners to resist using integrated land use and transport models (Patterson and Bierlaire 2010). LEAM has focused on loosely coupled modeling techniques to integrate their land use model with existing transportation models (Deal and Pallathucheril 2008). This approach was intended to simplify application. Since urban land use change and transportation systems are key components of urban dynamics, the integration and applicability of these types of models are key to analysing and assessing the socio-physical dynamics of urban systems. Landscape ecological models for analysing and assessing ecosystem services and biodiversity have been developed and applied in various studies in urban and other intensively used landscapes (e.g. Opdam et al. 2006; Opdam and Steingrover 2008; Mörtberg et al. 2007; Zetterberg et al. 2010; Mörtberg et al. 2012). Such landscape scaled models address the relationships between landscape patterns, ecosystem function and biodiversity (Alberti 2010; Johst et al. 2011), including the role of habitat amount and connectivity, which can be measured using different fragmentation indices (McGarigal and Cushman 2002) resulting from e.g. different urbanisation scenarios. Some of these models build on the concept of ecological profiles, representing a selection of prioritised biodiversity components (Vos et al. 2001; Mörtberg et al. 2012). The ecological profiles are constructed from properties of species, such as habitat requirements and dispersal capacity. These properties are considered to be related to ecological processes on landscape scale, and determine how species and the ecological networks they are dependent on, are impacted on by loss of habitat and landscape connectivity. One of the more promising ways forward to analyse and assess ecological
768
Urban Ecosyst (2013) 16:763–782
networks and landscape connectivity is network analysis based on graph theory (Urban et al. 2009; Dale and Fortin 2010). Such models are currently under development and may need further validation especially in complex urbanising settings. Yet they have potential for a more dynamic integration of biodiversity concerns and ecosystem processes as interactive parts of multidisciplinary analyses of urban systems. Existing good examples for analysing and assessing ecosystem services and biodiversity with urban growth and land use models are, for instance, Hepinstall et al. (2008), HepinstallCymerman et al. (2009) and Deal and Pallathucheril (2009). One such approach is the Landuse Evolution and impact Assessment Model (LEAM), a hybrid modelling tool that combines cellular automata with global probability surfaces to project and visualize future patterns of human land-use. The modeling platform is able to asses ‘what-if’ questions of varying policy or investment decision scenarios. Further it is able to test and grasp the magnitude of the scenario impacts in terms of e. g. energy, economics, demographic development, regional infrastructure, resources and regional sustainability on future landuse. It has also been used to test ecological implications of land use decisions over various geographies (Deal and Pallathucheril 2009). LEAM simulations can be run to analyse and assess planning issues and simulated scenario outcomes in order to discuss policy options concerning, for example, economy related to urban sprawl and infrastructure (Deal and Schunk 2004), or to assess how future land-use changes will affect ecosystem services (Deal and Pallathucheril 2009). Once set up, the model is intended to evolve over time and participative approaches are enabled through an interactive web-based planning support tool. LEAM projects have been developed in numerous case studies over the past decade (Deal and Pallathucheril 2008). However, LEAM has been predominately applied to simulate future land-use change in studies in the United States of America. Until now, the modeling approach has not yet been applied to European cities which may require different socio-economic settings and geographies.
The LEAM Stockholm case study The LEAM Stockholm case study was developed to demonstrate the integrated modelling framework and a landscape ecological network tool on two scenarios for the future development of the Stockholm Region. The scenarios were created by the researchers built on policy discussions in the earlier planning process for the Regional Development Plan for the Stockholm Region (RUFS 2010), created by the Office of Regional Planning (ORP 2010). The preparations for the next regional plan is currently starting and an initial workshop was held with stakeholders, among these regional and municipal planners, in order to demonstrate the capabilities of LEAM Stockholm and to start policy discussions. Study area and earlier planning process The study area consisted of the larger parts of Stockholm County, located on the east coast of Sweden, by the Baltic Sea (Fig. 1). It covers the City of Stockholm (59° 20′ N, 18° 05′ E), suburbs and peri-urban areas, with a total population of approximately 2 million inhabitants. The city centre is situated on a series of islands and along the shoreline, and has historically grown along transportation routes inland. This has resulted in a star-shaped urban pattern, leaving wedge-shaped nature and water areas in between. The city is situated in the hemiboreal zone and forest covers almost half of the total study area. The predominant forest type is coniferous forest with Scots Pine (Pinus sylvestris) and Norway Spruce (Picea abies). Oak
Urban Ecosyst (2013) 16:763–782
769
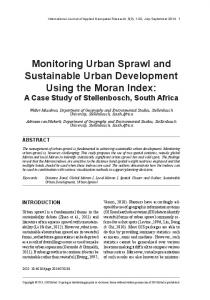
Fig. 1 Study area embracing large parts of the Stockholm County (derived from Landsat TM mosaic)
stands (Quercus robur) and other deciduous trees often grow close to arable land. The oak stands have a long historic continuity in the region and very high biodiversity values, especially concerning the invertebrate fauna tied to this habitat. The clay-filled valleys in more rural areas are often, or have recently been, under cultivation. Although large areas were drained, many small wetlands remain and are scattered over the peri-urban areas. The Stockholm region is expected to grow rapidly over the next few decades with an estimated increase of the urban population of 50 % in Stockholm County by the year 2030 (ORP 2010). This imposes high demands on the planning of housing and infrastructure, for which purpose the RUFS 2010 plan was developed, as mentioned. It attempts to incorporate new housing and infrastructure, within a framework that has the intention to provide knowledge, competence and innovation, nature and cultural values, social integration and international cooperation within the Baltic Sea region (ORP 2010). In Sweden, the municipalities have a planning monopoly but other issues, such as public transport, are planned on regional level. Hence, during a wide-ranging planning process over the course of several
770
Urban Ecosyst (2013) 16:763–782
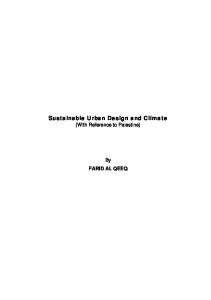
years, all the 21 municipalities of the County were involved in the discussions of RUFS 2010 in cooperation with other stakeholders. This planning process was initially informed by an integrated urban growth and transport model, which however is no longer accessible for additional interaction. Within this planning process, nature and cultural values were supported by the Greenstructure of Stockholm (ORP 2010). The Greenstructure was constructed as a set of core areas with high overall nature and cultural values, connected with, in some parts vast, green and blue corridors derived from expert knowledge and the visual inspection of maps. It has had relatively strong political support in planning across municipal borders. However, large parts of this Greenstructure are not legally protected and the political support is being challenged by the ever-increasing need for urban expansion, either manifested as sprawl or as a development towards a more dense, energy-efficient city. For negotiations with strong actors, more sofisticated tools targeting ecosystem processes more directly may be necessary in the future, allowing for analysis, assessment, multiple solutions and mitigation alongside with the creation of protected areas. Currently, early steps are taken for the next Regional Development Plan, which will again involve the participation of a wide array of stakeholders. Thus, there will be a need for transparent and integrated analysis and assessment of different policy options, which opens for further development of model support for the planning process. Here, the LEAM Stockholm cooperation has taken the initiative to start the discussions, opening up for a more transparent and dynamic modelling framework. Methods for the case study In the case study, urban growth was projected using the LEAM model where different urban development policies resulted in two scenarios for 2030, Scenario Compact and Scenario Urban Nature. Both scenarios involved a 50 % increase of urban population but with different urban form, leading to different transport demands, energy-efficiency, and landscape fragmentation patterns with inherent ecological implications. Further, impacts on a selected, prioritised ecological profile were demonstrated by integrating a landscape ecological network model for biodiversity assessment. The LEAM model Basically, LEAM consists of two different components; a land-use change and an impact assessment component as depicted in Fig. 2. LEAM simulations start with an initial data input to inform the sub-model ‘drivers’. Drivers are typically the human induced driving forces that constitute the main determinants or causal variables of land-use change in any given region. Sub-model drivers interacting with each other during the simulation, finally resulted in a land-use change surface. In LEAM’s probability surface, current land-use is expressed as a lattice of cells. Each cell possesses a finite number of states which are defined from the beginning (T0) but have a probable potential to change with interaction over time. Cells evolve according to predefined rules, affecting cells in the vicinity that in turn influence the state of other cells. At each time step the state of each cell is updated. The rules for calculating probabilities are based on the contextual sub-model drivers that are run simultaneously in each cell of the grid. Since all sub-models influenced all the current cell states, development probabilities were calculated with a Markov chain approach for each cell at each time step to both determine whether a cell was likely to transform or not, and when the transformation threshold was exceeded, to
Urban Ecosyst (2013) 16:763–782
771
Fig. 2 The basic LEAM modeling framework (Deal et al. 2005)
which state (current land-use) a cell was transformed. These transformations were simulated with a Monte Carlo experiment to ensure statistically valid simulation results. In the experiment, potential land uses competed for space based on their calculated probability scores and a random-number generator. The outcome of a simulation varied slightly from run to run due to this implemented probability function. The simulation results impacted on various issues, among these biodiversity indicators. Objectives and additional indicators could then be discussed and further analysed, enabling further sub-model creation, refinements and modification of existing models in interaction with stakeholders. For a more detailed technical description of the model, comprehensive information is given in (Deal et al. 2005). The LEAM modeling environment was made publicly available within the online open-source content management system framework “Plone” with an integrated Google Map Viewer. Plone was customized for matching the requirements of future interactive analysis and assessment for Stockholm, which involved visual customisation, adding initial users and data upload, allowing for initial results to be viewed interactively. Two LEAM scenario runs were performed with different input data and scenario outcomes. As an initial step, the sub-models drivers were defined from the available data sets. The first scenario was called Scenario Compact, taking legally protected and other designated areas into consideration, allowing for a much denser urban pattern than exists today. The second scenario was called Scenario Urban Nature, as it took a complete protection of the Greenstructure of Stockholm into account, along with the municipalities’ comprehensive plans. The following data sets were used in both model runs (Scenario Compact and Scenario Urban Nature):
772
& &
& &
Urban Ecosyst (2013) 16:763–782
Road network: Data on roads (Swedish Transport Agency 2011) was reclassified into the American Tiger CFCC road classification (Proximity 2012) with special emphasis on ramps for accessibility. Land cover: The land cover dataset (Lantmäteriet 2011) comprised 60 different classes was resampled to a lower resolution (25m2 to 30m2) and classes were aggregated to match the NLCD1992 standard (U.S. Environmental Protection Agency 2007) with 21 classes, plus a special class for roads. Demographic information and employment centres: The employment projection (ORP 2001) was calculated from the snapshot of the ratio in 2001 between residential and commercial data with population data per cell data (Statistics Sweden 2006). No growth areas: The cells that fell into nature reserves, national parks, Natura 2000 sites, cultural heritage areas, water protection zones and other designated areas (Länsstyrelsen 2011) were excluded from the development (i.e. their state did not change). In the second run (Scenario Urban Nature), two changes were made:
&
&
Additional no growth areas: A more detailed representation of the shorelines of water courses and water bodies was implemented, adding better protection of these, together with the Greenstructure of Stockholm (ORP 2010) including core areas with high nature and cultural values, and corridors for supporting connectivity Comprehensive plans for boosting the development for residential and commercial areas: The joint comprehensive plans for all 21 municipalities within the study area, with the actual demographic and employment data for 2006 and the estimated amount for the year 2030 per parcel, spread over the whole study area, were used as initial assumption of the model (2006) and projected goal (2030)
The initial model runs predicted cell transformations towards either residential or commercial land-use. Already existing development was explored and compared to the predicted future state of cells in 5 year intervals up to 2030. Apart from 5 year interval comparisons within one particular scenario, inter-scenario comparisons were implemented enabling direct observations and comparisons of the effects of the two scenarios, which could then be assessed. Application of a biodiversity assessment model In order to enhance the representation of ecosystem processes in urban systems, related to biodiversity and ecosystem services on landscape level, integration of recently developed models are planned for the LEAM Stockholm case study. In this paper, one such model is demonstrated, addressing landscape connectivity for a prioritised ecological profile of the region. The landscape ecological network model was based on a set of nodes representing the habitat patches for the selected ecological profile. The profile was based on species properties representing old oak landscapes (Mörtberg et al. 2012). The identified nodes were in turn connected using links, typically representing juvenile dispersal patterns for the species/ profile (e.g. Bunn et al. 2000; Galpern et al. 2011; Urban et al. 2009), but also allowing for different potential dispersal distances to be tested. Landscape patches in this example were created using a metapatch concept introduced in Zetterberg et al. (2010). A metapatch is constructed by grouping all resources within a specific distance of each other, assessing all potential paths between them, and then analyzing the costs for this movement. The costs of movement, in this case, were accounted for by constructing a friciton based raster. Each raster cell represented the cost of moving across that particular cell for a particular species/ profile. Metapatches were then constructed by running a cost distance analysis (ESRI 2009)
Urban Ecosyst (2013) 16:763–782
773
using the selected habitat resource and the fricion raster as inputs and 450 m as the maximum cost-weighted effective distance. In order to construct the network model, the GIS-based tool MatrixGreen was used (Bodin and Zetterberg 2010). MatrixGreen is a landscape ecological network analysis tool, currently available as an ArcGIS-extension, that can be used to create, manage and analyse landscape connectivity and habitat availability using a network analysis. The metapatches described above were used as inputs to create a patch set in MatrixGreen. A Patch-Distance analysis was then run to calculate the percentage of patch area connectivity for a given Euclidean distance between patch centres. The distance was varied from 100 m to 10,000 m in increments of 100 m. We found a center to center distance threshold of approximatley 5,000 m. After the patch-distance analysis, a network was created in MatrixGreen by creating links using the “least cost path”-tool with the friction raster as input for the cost values. This tool generates links representing the spatially explicit least-cost path (LCP) across the friction surface and calculated the cost-weighted distance for each link up to a threshold value. The 5,000 m center to center distance patch-distance threshold was approximated to correspond with a distance along the LCP of about 4,000 m. This was the selected distance used to generate the networks of the current landscape and that of the two scenarios. The analysis of the network structure was also carried out in MatrixGreen by calculating the betweenness centrality (Freeman 1977) of each patch in the 5,000 m network. This metric quantifies how centrally patches are situated in the network from a landscape connectivity perspective. Betweenness centrality is a patch-level metric and has been argued to be a suitable measure of each patch’s stepping-stone importance (Minor and Urban 2007). The network structure and localtion of high betweenness centrality patches for 4,000 m LCP, were finally compared between the current landscape and the two scenarios.
Results and discussion LEAM and urban growth of Stockholm The changes in urban development for the two different scenarios are illustrated in Fig. 3, where the comparison of both scenarios clearly displays a discrepancy between the expected development of commercial and residential areas. In the model run for Scenario Compact, any cells that were not initially classified as commercial/residential areas or water bodies could potentially develop into new urban areas, with only the relatively small protected areas restricted. This resulted in an increasingly centralized cell transition pattern in the vicinity of the city core, mostly transforming remaining urban nature areas into built-up areas. In Scenario Urban Nature, the entire Greenstructure of Stockholm with core areas and corridors was excluded from the cells eligible for transformation. Further, shorelines to water courses and water bodies were better represented and avoided and the municipal comprehensive plans were made especially attractive to urban growth. As can be seen in Fig. 3, these restrictions and attractions resulted in a more decentralized development along major transportation lines, further away from the city centre than in Scenario Compact. Concerning validation of the model results, a comparison of historical urban patterns with the current situation would be a possibility, but of course not completely satisfactory since drivers and circumstances change. Therefore, uncertainties would remain even after thorough model validation. Another source of uncertainties was derived from the fact, that the current model parameters in the LEAM Stockholm case study were calibrated to match data used in previous studies using a US standard resolution and classification scheme. The data
774
Urban Ecosyst (2013) 16:763–782
Fig. 3 Comparison of expected quantitative land-use evolution of two scenarios: Scenario Compact in yellow to red and Scenario Urban Nature in light to dark blue. Red and dark blue represent a higher urban density, i.e. a larger area per cell, than yellow and light blue. Where insignificant changes were projected, cells are transparent
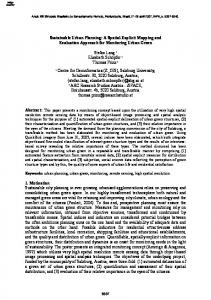
sets used this study had to be converted (spatially resampled, reclassified and aggregated) in order to match model requirements. However, by adaption of a predefined spatial resolution, road network reclassification and most of all aggregation of land cover classes, the information content of the input data was considerably reduced leading to a less accurate outcome. This limitation can be overcome by refining and enhancing the model by enabling input of different data resolutions and classes. Apart from the refinement of the existing data; reclassification of land-use data, road network improvement, accessibility to public transport and accessibility measured in travel time, the integration of additional data sets, knowledge and plans, e. g. updated local land use zoning plans and expert knowledge sub-models, is believed to considerably improve the model results. Yet, for the purpose of the case study, we considered the outcome of the model runs and comparisons with different sustainability indicators highly interesting and worthy of discussion. Integration of a landscape ecological model for biodiversity assessment For enhancing the biodiversity assessment capabilities, a landscape ecological network model was integrated into LEAM and applied to a prioritised ecological profile, which in this case comprised species tied to old oak stands. The model was applied for the current situation and for the two urban growth scenarios. The patch-distance analysis showed that the current ecological network was fully connected into one single component for dispersal distances above 8,200 m (Fig. 4) and that the network would be fragmented into several smaller components below 5,000 m. Thus, for species with dispersal capacities above 5,000 m, the network was almost fully connected. However, at 2,500 m, the total patch area of the largest component was only 10% of the total patch area of the study area, indicating a fragmented habitat network and low landscape connectivity.
Urban Ecosyst (2013) 16:763–782
775
Fig. 4 Percentage of total patch area for the largest metapatch, for each dispersal distance (center to center distance). As the dispersal distance increases, separate components are gradually joined and for distances above 8,200 m, the entire network is connected (i.e. 100% of the patch area can be reached). The network decomposes into smaller components and the total patch area of the largest component decreases rapidly between 5,000 m down to 2,500 m
When mapping the habitat network assuming a dispersal distance of 4,000 m for the current landscape and comparing that with the same network for the two scenarios, several impacts were found. In Fig. 5a), a cluster of patches with high betweenness centrality (i) were identified that uphold spatial redundancy, which may indicate a resilient network. This same cluster was found to be a completely isolated component in Scenario Compact (b). The patches themselves were marginally affected by the scenarios. It should be noted however, that developments in the matrix in between the patches lead to higher friction values, thereby breaking the dispersal links to and from section (i). Section (iii) illustrates an area with high improvement potential in which a link could be restored (see Zetterberg et al. 2010), thereby connecting the central parts of the network through the study area with a large, isolated network component to the east. However, Scenario Compact (b) as well as Scenario Urban Nature (c) show how a supporting cluster for such a restoration (ii) might become isolated. Thus, the main impacts of our two scenarions were not habitat loss as might be expected but rather loss of landscape connectivity, although this can be seen as closely interacting with habitat amount and quality. Some authors have argued that these three entities (habitat amount, quality, and connectivity) cannot individually be managed and must be managed together (Doerr et al. 2011). This work supports that notion. Additionally, information about potential significant habitat impacts as illustrated in cluster (i)–(iii) might be iteratively fed back into the planning process, possibly resulting in policy changes or changes in local plans. For example, protection or zoning of certain critical parts of the landscape might be developed to forego some of the negative implications modeled. These feedbacks are also useful as input into LEAM sub-models for calibration purposes. In our study, the network model was applied to an ecological profile, i.e. only assumed properties of species were modelled instead of the species themselves. The main uncertainties in this type of modelling lie in the accuracy of input data as well as in how well the assumed properties match the needs of the targeted species and populations (see discussion in e.g. Mörtberg et al. 2012). Another concern is the significance of the results. The selected
776
Urban Ecosyst (2013) 16:763–782
Fig. 5 The habitat networks for an ecological profile tied to old oaks, with a maximum dispersal distance of 4 000 m of (a) the current landscape, (b) Scenario Compact, and (c) Scenario Urban Nature for the year 2025. Habitat patches are linked by the Least Cost Paths and the color scale (green-yellow-red 0 low-intermediatehigh) indicates the betweenness centrality of the patch. i) shows an important linking section in (a) that is disconnected in (b) and c). iii) shows an area important for restoring a link and ii) shows a section that would be important in supporting such a restored link but which would be fragmented in (b) and (c)
ecological profile, species tied to old oak stands, represents high biodiversity values also on a national level and is not very abundant in Sweden. In the Stockholm Region, important parts of these oak stands remain in protected and unprotected areas as well as within old residential areas, also close to the city centre, which is a reason for the importance of this habitat also in urban areas. This habitat is though not very well represented by the Greenstructure. By contrast, some of the other habitat types that the Greenstructure host are more abundant in rural and peri-urban areas and therefore in the urban setting mainly represent high recreation values and other ecosystem services, while their importance for biodiversity from a national point of view may be limited. Comparison of the scenarios Both scenarios represent an increased landscape fragementation from an ecological point of view, however they largely differ in policy and in the resulting landscape pattern as well as in the consequences for energy-efficiency and for ecosystem functions. Scenario Compact illustrates a policy that prioritises an energy-efficient, dense urban development that is expected to minimise transport distances. However, this policy would ignore the high biodiversity values and ecosystem services of the Greenstructure areas that are not legally protected which are most of the areas. The political support that the Greenstructure program enjoys however, lies in these values. Liveability and the cultural history of the urban green areas are typically pointed out as major attractors for the City of Stockholm. Also areas outside the Greenstructure can host high values for biodiversity and/or ecosystem services, which are though not considered in this scenario. Scenario Urban Nature is the result of a policy that completely avoids the entire Greenstructure area. It also emphasises municipal comprehensive plans for localising development. This combination resulted in a development pattern which in some parts consisted of low density housing and could be characterised as urban sprawl, causing inefficient transport and energy patterns. However, the dark blue squares in Fig. 3 represent dense development
Urban Ecosyst (2013) 16:763–782
777
nodes close to the main transportation lines, which would rather be characterised as the “poly-centric” development patterns described in the Regional Development Plan (discussed e.g. in Balfors et al. 2005). An advantage of such patterns is that it implies that dense urban developments do not necessarily have to grow from the historical city centre, while opening up for many different solutions to e.g. energy-efficiency problems. The reliance of ecological considerations on a greenstructure may be problematic in the long run. As a planning instrument, it could be considered to be spatially static and dependent on the legal protection of the appointed areas, while surrounding areas take on the brunt of the development pressures, at times reducing the effectiveness of the greenstructure systems. It has been argued that the static nature of these solutions inhibit alternative scales or alternative solutions to the surrounding development pressures (Hostetler et al. 2011), and may thus not provide the most cost-effective solutions to urban ecosystem considerations. In the Stockholm case, exploitation in the Greenstructure is most often avoided even though it is not formally protected, while the development pressure is increasing in the surrounding areas without much consideration of their existing biodiversity and ecosystem services, as illustrated in Fig. 5. At the same time, the policy of dense and energy-efficient cities is strongly gaining support, especially since the need for new housing is urgent, while questioning some of the rationale for the Greenstructure. There are unclear links between landscape pattern and ecological processes, in that even if the core areas of the Greenstructure inevitably has high values, the vast corridors are questioned. Together with the low degree of protection, this may lead to uncontrolled exploitation in the future, of which signs already are visible. In this dichotomy of dense versus green urban development, the need for tools for analysis and assessment of the consequences of different policy options is obvious. Urban growth and transport models are already part of the regional planning process in e.g. Stockholm, while the ecological dimensions need further development and integration, which is where the LEAM Stockholm case study is aiming at. These tools will enable a more system-wide look at urban landscapes in discussions on how to combine the desired resource- and energy-effective urban services with biodiversity and ecosystem services. Stakeholder integration When developing the earlier regional development plan RUFS 2010, a landuse-transport model was applied for developing future scenarios together with stakeholders, which means that valuable experiences working with these types of models already exist in the region. Nevertheless, even if a comprehensive report on the model is available (ORP 2010), the model itself is not easily accessible for further development and sub-model integration. One of the advantages with LEAM is the implementation in the online “Plone” framework with the Google Map Viewer, which considerably enhances interaction and visualisation. The potential to communicate how possible scenarios were derived and their consequences, even from complex models, can counteract the “black box” approach and help participative processes. In the initial workshop with stakeholders which was part of the LEAM Stockholm case study, among others with regional and municipal planners from the region, policy discussions on urban sustainability started and the results were well understood and raised high interest. This probably was a consequence of the fact that the scenarios built on principles that were discussed during earlier planning processes. An important reflection was the recognition of the need for capacity building among a wider range of stakeholders, in order for all to be able to contribute to the policy discussions in the upcoming rounds of the
778
Urban Ecosyst (2013) 16:763–782
regional planning process. This is of particular importance in the Stockholm Region, where the urban system goes far beyond municipal borders (see Fig. 1), although with the execption of transportation, planning typically takes place at subregional scale. This means that land use and urban growth policy formation is typically in the hands of municipal planners, while transport is a regional issue and planned at a regional scale. This leads to the need for tight cooperative processes in order ot effectively manage growth policies. The integrated modelling approach, with capability of creating and evaluating scenarios of future development trajectories, can help in making these cooperative processes more transparent. Stakeholder participation can also improve the realism of the models concerning objective formulation and local system knowledge, among other things, and is a key aspect of sustainability. Future plan for model integration As pointed out by e.g. Alberti (2010) and Wu et al. (2012), it is important to link urban patterns to ecosystem function and to develop strategies to minimize the impacts of urban development. Strategic decisions on issues such as the planning of urban growth and investment in public infrastructure require synthesis of highly complex and rapidly evolving knowledge from a broad range of disciplines. For the LEAM Stockholm case study to move forward, we plan to integrate land use and transport models, urban metabolic models and landscape ecological models in order to analyse interactions within as well as between urban systems and ecosystems. In the LEAM Stockholm case study, the main relationships modelled so far were land use change—leading to landscape change—leading to changes in ecological processes. The main role of the existing transport system in this context was to attract new urban development. However the interaction between transportation and urban growth, other land use and ecosystems is much more complex. Future work will address such issues as alternative infrastructural solutions as drivers of land use change, as well as roads and travel activity as a result of land use change, and as a source for disturbances (noise, pollution, etc.), resulting in changes in ecosystem processes, habitat quality and connectivity. For both transport and land use models, it is necessary to improve the representation of urban form and urban ecosystems, to be able to better understand household activity patterns, including e.g. travel times, the role of walking and bicycling, as well as drivers such as the attraction of wealth to the proximity to water and urban nature, i.e. ecosystem services. A sustainable urban development needs further exploration of the interlink between the ecology in cities, such as the biodiversity of urban landscapes, and the ecology of cities, involving the flows of energy and materials through the urban system. As mentioned, urban systems are highly dependent on energy availability and in the face of climate change, the development and reconfiguration into energy-efficient cities is of highest priority. These changes occur on different scales and will depend on policy decisions as well as technical development. For instance, the shift to using renewable energy sources can be solved by solar, wind or hydropower plants as well as biomass extraction from remote areas, which may be intensively explored. On the other end of the scale are alternative distributed and small-scale solutions with houses being both highly energy-efficient and providing renewable energy themselves. The degree to which these and other solutions will be prioritised in policy and supported by markets will strongly affect urban systems and patterns. Urban regions, for example, may become even larger and region limits more significant. In order to capture some of this dynamics, energy systems might be modelled using metabolic models such as CLEW (Bazilian et al. 2011), integrating both water and energy supply and demands together with other land uses.
Urban Ecosyst (2013) 16:763–782
779
Urban water systems are likewise highly relevant to analyse, both concerning supply and demand for urban metabolic systems (Yates et al. 2005) and as uppholding biodiversity and ecosystem functions in urban landscapes (e.g. Alberti et al. 2007). In general, interactions and feedback between urban systems and ecosystems need further analysis, since functions of urban ecosystems can result both in essential ecosystem services and in unwanted disservices (Deal and Pallathucheril 2009; Breuste et al. 2011; Pataki et al. 2011). Further, impact trade-offs between different sustainability goals, such as energy-efficiency and biodiversity, will need to be addressed. In order to incorporate ecological considerations in policy discussions on sustainable urban development, integration of dynamic ecological models with urban growth and transport models for building and evaluating scenarios is a fruitful way forward. In this way, it will create potential to approach more system-wide knowledge on resource limits and the implications of urban density and sprawl. For instance, it will be possible to address the dichotomy of compact, energy-efficient cities versus cities with high biodiversity values and ecosystem services where people live and work, to find constructive solutions. The LEAM Stockholm case study was seen as the starting point of a wider model development and integration scheme, involving urban growth and land use change, urban metabolic and transport models as well as landscape ecological models. In this way, the model interfaces between the interacting urban systems and ecosystems can be developed in order to find feedbacks and synergies, targeting sustainable development pathways for urban development. Follow on work will use comparative studies of urban systems, participative approaches, and decision support tool development. Thus, the relations between urban systems and ecosystems can be analysed and assessed, in a form that simultaneously can provide planning support for sustainable urban development.
Conclusions In order to build competence for sustainability analysis and assessment of urban systems, it is essential to build on models representing urban form, landuse and transportation, urban metabolism, as well as ecological processes. This type of analysis of interacting sub-systems requires an advanced model integration platform that is open and malleable for further development. Moreover, since there is a great need to include ecosystem management into stakeholders’understanding and management of urban systems, the platform needs to be easily accessible, with high visualisation capacity. The LEAM Stockholm case study served as a start of an Urban Sustainability Laboratory, a decision support node for the region, beginning with the development of two future scenarios resulting from alternative policies. The scenarios differed and the dense urban development of Scenario Compact could be visualised, destroying much of the Greenstructure of Stockholm, while Scenario Urban Nature steered the development more to outer suburbs and some sprawl. For demonstration of the need for further development of biodiversity assessment models, a landscape ecological network model tied to a prioritised ecological profile was applied and altered by the scenarios. It could be demonstrated that the Greenstructure did not support this profile very well. Thus, there is a need for dynamic models for negotiations, finding alternative solutions and interacting with other models. This can be seen as essential for biodiversity and ecosystem services to be treated as resources in urban systems. The LEAM Stockholm case study as well as other comparative LEAM case studies is planned to be further developed to interact with more advanced transport and land use
780
Urban Ecosyst (2013) 16:763–782
models, as well as analysing urban energy and water systems. This will enable integrated sustainability analysis and assessment of complex urban systems, with the goal to build more sustainable urban systems and to increase urban experiences in ecosystem management. Acknowledgements This international cooperation between KTH Royal Institute of Technology, Stockholm, Sweden and University of Illinois, Urbana-Champaigne, USA, was supported by the ABE School Urban Research Cluster at KTH, lead by Professor Vladimir Cvetkovic, to whom we are much obliged. We are also grateful for comments on earlier versions of the manuscript by three anonymous reviewers.
References Alberti M (2008) Urban patterns and ecosystem function. Ch 3. In: Alberti M (ed) Advances in urban ecology —integrating humans and ecological processes in urban ecosystems. Springer US, New York, pp 61–92 Alberti M (2010) Maintaining ecological integrity and sustaining ecosystem function in urban areas. Curr Opin Environ Sustain 2:178–184 Alberti M, Booth D, Hill K, Coburn B, Avolio C, Coe S, Spirandelli D (2007) The impact of urban patterns on aquatic ecosystems: an empirical analysis in Puget lowland sub-basins. Landsc Urban Plann 80:345–361 Balfors B, Mörtberg U, Gontier M, Brokking P (2005) Impacts of region-wide urban development on biodiversity in strategic environmental assessment. J Environ Assess Pol Manag 7:229–246 Batty M (2008) The size, scale, and shape of cities. Science 319:769–771 Bazilian M, Rogner H, Howells M, Hermann S, Arent D, Gielen D, Steduto P, Mueller A, Komor P, Tol RSJ, Yumkella KK (2011) Considering the energy, water and food nexus: towards an integrated modelling approach. Energ Pol 39:7896–7906 Beser M, Algers S (2002) SAMPERS—The New Swedish National Travel Demand Forecasting Tool. Ch. In. Lundqvist L, Mattsson L-G (eds) National transport models: recent developments and prospects: Springer Bodin Ö, Zetterberg A (2010) MatrixGreen v 1.6.4 User's Manual: Landscape Ecological Network Analysis Tool (www.matrixgreen.org). Stockholm Resilience Centre and KTH Royal Institute of Technology: Stockholm Boone C, Cook E, Hall S, Nation M, Grimm N, Raish C, Finch D, York A (2012) A comparative gradient approach as a tool for understanding and managing urban ecosystems. Urban Ecosystems: 1–13 Breuste J, Haase D, Elmqvist T (2011) Urban landscapes and ecosystem services. In: Sandhu H, Wratten S, Cullen R, Costanza R (eds) ES2: ecosystem services in engineered systems. Wiley-Blackwell, Oxford Bunn AG, Urban DL, Keitt TH (2000) Landscape connectivity: a conservation application of graph theory. J Environ Manag 59:265–278 Dale MRT, Fortin MJ (2010) From graphs to spatial graphs. Annu Rev Ecol Evol Syst 41:21–38 Deal B, Pallathucheril V (2008) Simulating regional futures: the land-use evolution and impact assessment model (LEAM). Ch. In: Braill R (ed) Planning support systems for cities and regions. Lincoln Institute of Land Policy, Cambridge, MA, pp 61–84 Deal B, Pallathucheril V (2009) Sustainability and urban dynamics: assessing future impacts on ecosystem services. Sustain 1:346–362 Deal B, Pallathucheril V, Sun Z, Terstriep J, Hartel W (2005) LEAM Technical Document: Overview of the LEAM Approach. University of Illinois at Urbana-Champaign, 76 pp Deal B, Schunk D (2004) Spatial dynamic modeling to urban land use transformation: a simulation approach to assessing the costs of urban sprawl. Ecol Econ 51:79–95 Dearborn D, Kark S (2010) The motivation for conserving urban biodiversity. Conserv Biol 24:432–440 Doerr VAJ, Barrett T, Doerr ED (2011) Connectivity, dispersal behaviour and conservation under climate change: a response to Hodgson et al. J Appl Ecol 48:143–147 El-Sayed Mohamed Mahgoub M, van der Steen NP, Abu-Zeid K, Vairavamoorthy K (2010) Towards sustainability in urban water: a life cycle analysis of the urban water system of Alexandria City, Egypt. J Clean Prod 18:1100–1106 ESRI (2009) ArcGIS Version 10 [GIS Application], Environmental Systems Research Institute, Inc., Redlands, CA European Environment Agency (2006) Urban sprawl in Europe: The ignored challenge. EEA Report. No 10/ 2006. Copenhagen 60 pp Forman RTT, Godron M (1986) Landscape ecology. John Wiley & Sons, New York Freeman L (1977) A set of measures of centrality based on betweenness. Sociometry 40:35–41
Urban Ecosyst (2013) 16:763–782
781
Galpern P, Manseau M, Fall A (2011) Patch-based graphs of landscape connectivity: a guide to construction, analysis and application for conservation. Biol Conserv 144:44–55 Grimm NB, Faeth SH, Golubiewski NE, Redman CL, Wu J, Bai X, Briggs JM (2008) Global change and the ecology of cities. Science 319:756–760 Heaps C (2008) LEAP User Guide. Stockholm Environment Institute. Stockholm Hepinstall-Cymerman H, Coe S, Alberti M (2009) Using urban landscape trajectories to develop a multitemporal land cover database to support ecological modeling. Rem Sens 1:1373–1379 Hepinstall J, Alberti M, Marzluff J (2008) Predicting land cover change and avian community responses in rapidly urbanizing environments. Landsc Ecol 23:1257–1276 Hostetler M, Allen W, Meurk C (2011) Conserving urban biodiversity? Creating green infrastructure is only the first step. Landsc Urban Plann 100:369–371 Hunt JD, Simmonds DC (1992) Theory and application of an integrated land-use and transport modeling framework. Environ Plann Plann Des 20:221–244 International Energy Agency (2008) World Energy Outlook 2008: Technical Report, International Energy Agency/OECD, pp 578 Johst K, Drechsler M, van Teeffelen AJA, Hartig F, Vos CC, Wissel S, Wätzold F, Opdam P (2011) Biodiversity conservation in dynamic landscapes: trade-offs between number, connectivity and turnover of habitat patches. J Appl Ecol 48:1227–1235 Jongman RHG, Külvik M, Kristiansen I (2004) European ecological networks and greenways. Landsc Urban Plann 68:305–319 Kates RW, Clark WC, Corell R, Hall JM, Jaeger CC, Lowe I, McCarthy JJ, Schellnhuber HJ, Bolin B, Dickson NM, Faucheux S, Gallopin GC, Grübler A, Huntley B, Jäger J, Jodha NS, Kasperson RE, Mabogunje A, Matson P, Mooney H, Moore B III, O'Riordan T, Svedin U (2001) Environment and development: sustainability science. Science 292:641–642 Keirstead J, Schulz NB (2010) London and beyond: taking a closer look at urban energy policy. Energ Pol 38:4870–4879 Kennedy CA, Cuddihy J, Engel Yan J (2007) The changing metabolism of cities. J Ind Ecol 11:43–59 Klosterman RE (2012) Simple and complex models. Environment and Planning B: Planning and Design 39:1–6 Länsstyrelsen (2011) Länsstyrelsernas GIS-tjänster. http://www.gis.lst.se/. Accessed 30 May 2011 Lantmäteriet (2011) GSD Landcover Data, Lantmäteriet Luck GW (2007) A review of the relationships between human population density and biodiversity. Biol Rev 82:607–645 McGarigal K, Cushman SA (2002) Comparative evaluation of experimental approaches to the study of habitat fragmentation effects. Ecol Appl 12:335–345 McKinney ML (2002) Urbanization, biodiversity, and conservation. BioScience 52:883–890 McKinney ML (2008) Effects of urbanization on species richness: a review of plants and animals. Urban Ecosyst 11:161–176 Minor ES, Urban DL (2007) Graph theory as a proxy for spatially explicit population models in conservation planning. Ecol Appl 17:1771–1782 Mörtberg UM, Balfors B, Knol WC (2007) Landscape ecological assessment: a tool for integrating biodiversity issues in strategic environmental assessment and planning. J Environ Manag 82:457–470 Mörtberg UM, Zetterberg A, Brokking Balfors B (2012) Urban landscapes in transition: lessons from integrating biodiversity and habitat modelling in planning. Journal of Environmental Assessment Policy and Management: 1250002, 31 pp Nissing C, von Blottnitz H (2010) An economic model for energisation and its integration into the urban energy planning process. Energ Pol 38:2370–2378 Office of Regional Planning 2001. Regional utvecklingsplan 2001 för Stockholmsregionen—RUFS 2001. Stockholm County Council. Stockholm, 152 pp [In Swedish] Office of Regional Planning 2010. Förslag till regional utvecklingsplan för Stockholmsregionen—RUFS 2010. Så blir vi Europas mest attraktiva storstadsregion. Stockholm County Council. Stockholm, pp 262. [In Swedish] Opdam P, Steingrover E (2008) Designing metropolitan landscapes for biodiversity: deriving guidelines from metapopulation ecology. Landsc J 27:69–80 Opdam P, Steingröver E, van Rooij S (2006) Ecological networks: a spatial concept for multi-actor planning of sustainable landscapes. Landsc Urban Plann 75:322–332 Ortúzar JdD, Willumsen LG (2001) Modelling Transport: Wiley, 586 pp Pataki DE, Carreiro MM, Cherrier J, Grulke NE, Jennings V, Pincetl S, Pouyat RV, Whitlow TH, Zipperer WC (2011) Coupling biogeochemical cycles in urban environments: ecosystem services, green solutions, and misconceptions. Front Ecol Environ 9:27–36
782
Urban Ecosyst (2013) 16:763–782
Patterson Z, Bierlaire M (2010) Development of prototype UrbanSim models. Environ Plann Plann Des 37:344–366 Pickett STA, Cadenasso ML, Grove JM, Nilon CH, Poyat RV, Zipperer WC, Constanza R (2001) Urban ecological systems: linking terrestrial ecological, physical, and socioeconomic components of metropolitan areas. Annu Rev Ecol Syst 32:122–157 Qureshi S, Hasan Kazmi SJ, Breuste JH (2010) Ecological disturbances due to high cutback in the green infrastructure of Karachi: analyses of public perception about associated health problems. Urban Forest Urban Greening 9:187–198 Ricketts T, Imhoff M (2003) Biodiversity, urban areas, and agriculture: locating priority ecoregions for conservation. Conserv Ecol 8:1 Rosenzweig ML (2003) Win-win ecology: how earth species can survive in the midst of human enterprise. Oxford University Press, New York Rui Y, Ban Y (2011) Urban growth modeling with road network expansion and land use development. Advances in cartography and GIScience, vol 2. Springer, Berlin Heidelberg, pp 399–412 Ruth M, Coelho D (2007) Understanding and managing the complexity of urban systems under climate change. Clim Pol 7:317–336 Spatari S, Yu Z, Montalto FA (2011) Life cycle implications of urban green infrastructure. Environ Pollut 159:2174–2179 Statistics Sweden (2006) Population data. Statistics Sweden Strohbach MW, Arnold E, Haase D (2012) The carbon footprint of urban green space—a life cycle approach. Landsc Urban Plann 104:220–229 Swedish Transport Agency (2011) The National Road Database. https://lastkajen.trafikverket.se. Accessed 30 May 2011 Tzoulas K, Korpela K, Venn S, Yli-Pelkonen V, Kaźmierczak A, Niemela J, James P (2007) Promoting ecosystem and human health in urban areas using green infrastructure: a literature review. Landsc Urban Plann 81:167–178 UNEP (2007) Report of the Cities and Biodiversity: Achieving the 2010 Diversity Target. United Nations Environment Programme, 25 pp United Nations (2009) Planning sustainable cities—Global report on human settlements. United Nations Human Settlements Programme, UN Habitat, 338 pp Urban DL, Minor ES, Treml EA, Schick RS (2009) Graph models of habitat mosaics. Ecol Lett 12:260–273 van Bueren E, van Bohemen H, Itard L, Visscher H (eds) (2012) Sustainable urban environments, an ecosystem approach. Springer, Dordrecht, p 429 Von Thünen JH (1826) Der Isolirte Staat (The Isolated State) Vos CC, Verboom J, Opdam PFM, ter Braak CJ (2001) Toward ecologically scaled landscape indices. Am Nat 157:24–41 Waddell P, Ulfarsson GF, Franklin JP, Lobb J (2007) Incorporating land use in metropolitan transportation planning. Transport Res Pol Pract 41:382–410 Wu J (2008) Making the case for landscape ecology: an effective approach to urban sustainability. Landsc J 27:41–50 Wu J, Buyantuyev A, Jenerette GD, Litteral J, Neil K, Shen W (2012) Quantifying spatiotemporal patterns and ecological efforts of urbanisation: a multiscale landscape approach. Ch 4 in Richter M, Weiland U (eds). Applied Urban Ecology: A Global Framework: Blackwell Publishing Ltd Yates D, Sieber J, Purkey D, Huber Lee A (2005) WEAP21: a demand, priority, and preference driven water planning model: part 1, model characteristics. Water Int 30:487–500 Zetterberg A, Mörtberg U, Balfors B (2010) Making graph theory operational for landscape ecological assessments, planning, and design. Landsc Urban Plann 95:181–191 Zetterberg A, Mörtberg U, Bodin Ö, Saura S (2011) Sprawl or dense?: Assessing impacts of regional development plans on landscape network connectivity. In: Zetterberg, A. Connecting the dots: Network analysis, landscape ecology, and practical applications. Doctoral thesis, Dept of Land and Water Resources Engineering, KTH Royal Institute of Technology, Stockholm, TRITA-LWR PHD 1062 Zhang Y, Li S, Fath BD, Yang Z, Yang N (2011) Analysis of an urban energy metabolic system: comparison of simple and complex model results. Ecol Model 223:14–19
Online resources Proximity (2012) TIGER/Line File Census Feature Class Codes (CFCC), http://proximityone.com/tgrcfcc.htm US Environmental Protection Agency (2007) NLCD Classification Schemes (Level II) http://www.epa.gov/ mrlc/classification.html