Chapter 11
Urban Heat Island and Bioclimatic Comfort in Warsaw Krzysztof Błażejczyk, Magdalena Kuchcik, Wojciech Dudek, Beata Kręcisz, Anna Błażejczyk, Paweł Milewski, Jakub Szmyd, and Cezary Pałczyński
Abstract This chapter will introduce the UHI phenomena in Warsaw, in particular after a the definition of the pilot area, experimental microclimatic measurements were made in two housing estates, Koło and Włodarzewska, located at a similar distance from the city centre and from the city limits but different in terms of building periods and materials. A specific analysis of vegetation is provided to put in relationship UHI effects and allergenic factors. The case is completed by some solutions in terms of mitigation and adaptation to reduce urban warming impact. Keywords Microclimate • Urban spatial organization • Green areas • Mitigation
11.1
Introduction – UHI as an Effect of Spatial Organization of the City
Warsaw is the largest city in Poland. Its area of almost 515 km2 has significant differentiation of land use. Currently about 248 km2 is built-up area (48 %). Within this the greatest part (about 57 km2) is covered by industry, trade units and transport systems. Forests make up about 15 % of the city. Urban parks and other recreational green areas cover 10 %. 12 % of the city territory is used as arable land, for crops and pasture. The category “heterogeneous agricultural areas” includes sparsely built areas and allotment gardens – 11.3 % (Table 11.1). With 1.7 million residents and K. Błażejczyk • M. Kuchcik (*) • P. Milewski • J. Szmyd Geoecology and Climatology Department, Institute of Geography and Spatial Organization, Polish Academy of Sciences, Twarda 51/55, 00-818 Warszawa, Poland e-mail:
[email protected] W. Dudek • B. Kręcisz • C. Pałczyński Nofer Institute of Occupational Medicine, Łódź, Poland A. Błażejczyk Bioklimatologia. Laboratory of Bioclimatology and Environmental Ergonomics, Warszawa, Poland © The Author(s) 2016 F. Musco (ed.), Counteracting Urban Heat Island Effects in a Global Climate Change Scenario, DOI 10.1007/978-3-319-10425-6_11
305
306 Table 11.1 The land use types in Warsaw, according to Corine Land Cover 2006 (EEA 2007)
K. Błażejczyk et al.
Land use Urban fabric Industrial. commercial and transport units Construction sites Artificial. non-agricultural vegetated areas Arable land Permanent crops Pastures Heterogeneous agricultural areas Forests Scrub and/or herbaceous vegetation Open spaces with little or no vegetation Inland wetlands Inland waters Total
Area [km2] 191.0 56.9
Area [%] 37.1 11.1
3.3 53.4
0.6 10.4
40.0 0.5 21.2 58.3 77.8 0.6
7.8 0.1 4.1 11.3 15.1 0.1
1.6
0.3
0.2 9.9 514.6
0.0 1.9 100.0
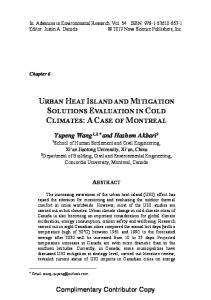
over 3.2 million residents of the greater agglomeration area, it has become the 10th most populous city in the European Union (Eurostat 2014). After the Second World War, the area of Warsaw increased gradually; small villages and rural areas as well as natural forests were included into the city. During the last 20 years, many fields, pastures and meadows were adapted for residential districts. The recent tendency in city development is to build dense settled residential districts (both, small single family buildings and 4–6 floor blocks) as well as to insert new buildings into free spaces in the city centre (which was dramatically destroyed during the II World War). At the administration level of Warsaw there is not one single vision for city development. For the whole city there is only a general overview of investment intentions (Studium… 2010). The shape of UHI in Warsaw resembles a diamond and reflects the distribution of the densest built area. The mean yearly intensity of the UHI-index (difference of the minimum daily temperature for the considered site to the value of the minimum daily temperature for Warszawa-Okęcie station) reaches over 2 °C in the city centre. On the outskirts and in the forest area in south-east Warsaw, the UHI-index is from 0.5 to 1.0 °C lower than at the airport station. During spring and summer, the intensity of UHI is comparable to the average. The most intensive UHI is to be observed in autumn. The very centre of the city is warmer in the night by 2.5 °C comparing to Okęcie station. The lowest UHI-index occurs in winter – only 1.5 °C, but then the spatial extent of UHI is greater than in other seasons. This situation is associated
11 Urban Heat Island and Bioclimatic Comfort in Warsaw
307
Fig. 11.1 Spatial distribution of UHI-index in Warsaw, mean values for the years 2011–2012
with the usage of house heating stoves in places not connected to central heating plants (Fig. 11.1). Thus, the general idea of pilot studies in Warsaw was: (1) to verify how the varying structures of space organization and land cover of selected residential districts influence UHI intensity and perceptible thermal conditions, and (2) how architectural solutions (e.g. planting additional lawns and trees, organizing green roofs) can minimise UHI and affect perceptible thermal conditions. An additional aspect of the pilot studies was to assess the allergenic potential of plant cover (trees and bushes) growing inside the studied residential districts. It allows the validation of the health impact of vegetation and consequently, to give recommendations regarding plant composition which would be more friendly for the local population.
11.2
Pilot Areas Methodology
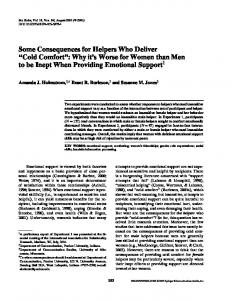
The pilot studies were designed on the basis of a network of microclimatic measurements in Warsaw and its surroundings, working since 2006 as part of climate research carried out in IGSO PAS (Kuchcik et al. 2008; Błażejczyk et al. 2013b). To cope with the aims of research, three small areas in Warsaw were chosen: Twarda (in the centre of the city) as well as Koło and Włodarzewska housing estates (in the western part of the city). As a reference site, representing outside rural conditions, the station situated in the Botanical Garden in Powsin was chosen (Fig. 11.2). For each area a detailed inventory of the greenery, type of surfaces, heights of buildings and horizon limitations was made.
308
K. Błażejczyk et al.
Fig. 11.2 Location of the pilot study areas (Twarda, Koło, Włodarzewska) and peripheral reference station (Powsin)
The Koło estate was established about 50 years ago (in the 1960s). The 4–5 floor buildings are built in low density and the majority are built from clay bricks. Few parking places are located inside the estate. Wide spaces between buildings are covered by lawns and tall, mature, deciduous trees. The RBVA (Ratio of Biologically Vital Areas), i.e. the ratio of areas covered by vegetation or open water (not sealed areas) in the plot size (according to Szulczewska et al. 2014) is 54.3 % and FAR (Floor Area Ratio)1 is 0.8 (Fig. 11.3a). The Włodarzewska estate was built about 15 years ago (1995–2000) and is surrounded by many open spaces and a park, but arranged in a way which effectively precludes the entrance of air from the outside. It is characterized by compact development. The 4–5 floor blocks are very densely built up. They are constructed mostly from concrete and include underground car parks. Parking places are also organized along communication roads inside the estate. Many small flowerbeds and lawns 1
Floor Area Ratio, is calculated as the area of all building contours (Barea) multiplied by the number of floors (fn) and divided by the total area of the plot (Tarea), FAR = Barea⋅fn/Tarea.
11 Urban Heat Island and Bioclimatic Comfort in Warsaw
309
Fig. 11.3 Aerial view of pilot areas: Koło housing estate (a), Włodarzewska housing estate (b), Twarda district (c) and Powsin reference station (d); yellow points indicate sites of microclimatic measurements, the red points indicate sites of permanent microclimatic measurements
with coniferous shrubs grow between the buildings. Only a few young deciduous trees grow there. RBVA is 40.7 % and FAR is 1.25 (Fig. 11.3b). The Twarda district is located in the city centre. It consists of a mixture of 80-year old buildings (from clay bricks), which were not destroyed during II World War as well as of newly constructed compartments (from concrete). 6–7 floor buildings predominate. Vegetation cover is very poor and only few trees and lawns can be found at the bottom of deep courtyards. Almost all the space between buildings is used as parking places. The area is surrounded by streets without any vegetation. The RBVA for this area is only 4 % and the FAR index is 2.74 (Fig. 11.3c). The characteristics of UHI and perceptible thermal conditions in each of the selected studied areas were compared with air temperature (Ta) and Universal Thermal Climate Index (UTCI) values observed at the peripheral reference station in Powsin. The station is situated in the Botanical Garden and represents open area conditions with ground covered by grass. Horizon shading is about 10 % and the station is exposed to sunbeams almost the whole day (Fig. 11.3d).
310
11.3
K. Błażejczyk et al.
Methods
The pilot studies in Warsaw have been composed of two steps. In the first step, experimental microclimatic measurements were made in two housing estates, Koło and Włodarzewska. They are located a similar distance from the city centre and from the city limits. However, they differ in type, density and age of buildings as well as in composition of green areas and the percentage of biologically vital area. The aim of the microclimatic measurements was to assess influence of local space organization on differences of UHI and perceptible thermal conditions. The results of the measurements were compared both with the Powsin reference station and with the city centre represented by Twarda district. During the microclimatic research on 21 and 22 May 2013, the air temperature and humidity, wind speed and global solar radiation were measured in two periods of the day: early morning (5–7 a.m.) and at midday (12 p.m.–2 p.m.). The posts were situated in various micro structures of the housing estates (Fig. 11.3a, b). The perceptible thermal conditions were assessed with the use of the Universal Thermal Climate Index UTCI (Błażejczyk 2011; Bröde et al. 2012; Błażejczyk et al. 2013a, b). The index assesses heat stress in man caused by a complex outdoor environment (air temperature and humidity, solar radiation and wind speed). The spatial variability (in early morning and midday hours) of air temperature and UTCI and differences between microclimatic posts and the reference peripheral station were analysed. As a result of the greenery inventory, all plant species have been divided into four classes according their allergenic potential. The classification was evaluated according to the Polish Society of Allergology guidelines for diagnosis and management of allergic diseases supported additionally by local allergists’ experience. Class 3 – great allergenicity, frequently sensitizing species (Alder, Birch, Hazel) Class 2 – moderate allergenicity, rare sensitizing species (Poplar, Elm, Willow, Beech, Oak, Plane, Ash, Linden) Class 1 – slight allergenicity, very rare sensitizing species or isolated case reports only (Acacia, Hornbeam, Maple, Elder, Spruce, Pine, Jasmine, Ambrosia, Olive) Class 0 – no allergenicity, species with no or unknown allergenic potential (female cultivars of dioeciously plants from higher classes were also included in this class due to no pollen production). If a plant species was not mentioned in any guidelines or local allergists’ statement, the EBSCO scientific journal database was used to determine the potential allergenicity of the plant. If, during the last 15 years, there had been three or more cases or scientific reports published on the possibility of respiratory tract allergy induction, the plant was classified as Class 1; otherwise it was classified as Class 0. Microclimatic measurements became the basis for the second, simulation step of the pilot studies. In this step a few scenarios of possible changes in land cover in Włodarzewska and Twarda, which could reduce UHI, were considered. The simulations of air temperature for 4 days a year representing spring, summer, autumn and
11 Urban Heat Island and Bioclimatic Comfort in Warsaw
311
winter were made with the use of ENVI-Met software in the Vienna University of Technology, Department of Building Physics and Building Ecology, Institute of Architectural Sciences.
11.4
The Role of Urban Vegetation in Reduction of UHI – The Results of Microclimatic Research
The variation of air temperature (Ta) and heat stress (UTCI) inside residential districts was examined on two sunny days, 21–22 May 2013, in two housing estates, Koło and Włodarzewska, which differ in the provision of green areas as well as in the arrangement of buildings (Fig. 11.3a, b). On the measuring days, the wind was weak (