Using Competition to Elicit Cooperation in a Political Public Goods Game: A Field Experiment Ned Augenblick and Jesse Cunha October 2009
Abstract This paper presents evidence from a …eld experiment on the impact of inter-group competition on intra-group contributions to a public good. We sent political solicitations to potential congressional campaign donors that contained either reference information about the past donations of those in the same party (cooperative treatment), those in the competing party (competition treatment), or no information (the control group). The donation rate in the competitive and cooperative treatment groups was 85% and 42% above that in the control, respectively. Both treatments contained a monetary reference point, which in‡uenced the distribution of donations. While the cooperative treatment induced more contributions concentrated near the mentioned reference point, the competitive treatment induced more contributions at nearly twice the level of the given reference point, leading to a higher total contributed amount. This suggests that both cooperative and "pro-social" motives can drive higher contribution rates and total contributions, but the elicitation of competitive behavior can be more pro…table in certain fundraising situations.
Keywords: Contributions, Charity, Pro-Social, Conditional Cooperation JEL Classi…cation Numbers: D71, D72
Both Authors: Address: 579 Serra Mall, Stanford, CA 94305, email:
[email protected] and
[email protected]. The authors are grateful to Muriel Niederle, Doug Bernhiem and Giacomo DeGiorgi for advice and suggestions, and Scott Nicholson and Annika Todd for helpful comments. This research was funded by the George P. Shultz fund at the Stanford Institute for Economic Policy Research and the B.F. Haley and E.S. Shaw Fellowship.
1
1
Introduction
Previous research has demonstrated that positive information about the contributions of other players can increase contributions to a public good, both in the laboratory (Fischbacher et al. (2001)) and in the …eld (Frey and Meier (2004), Shang et al. (2005,2006,2008)). These papers concern donations to a single public good (such as a public radio station), in which all players work towards a commonly-desired goal and suggest that cooperation can a powerful contribution motivator. But, is the impact of competiton in these environments stronger than that of cooperation? Multiple laboratory experiments (Bornstein and BenYossef (1993), Bornstein et al. (2002)) and at one …eld experiment (Erev et al. (1999)) suggest that competition across groups can be a strong driver of cooperative behavior within groups. In this paper, we test this hypothesis in a competitive public goods game by presenting information to people about the contributions of members of their own group or those of the competing group. In the …eld experiment, which was run during the 2008 campaign for the US House of Representatives, 10,000 potential donors to a Democratic candidate were separated into three equal-sized demographically-balanced groups and sent a solicitation postcard. Depending on the group, the postcard contained a non-informative statement ("control" group), or a reference statement about the past donation behavior of either Democrats ("cooperative" group) or Republicans ("competitive" group), such as "small Republican contributions have been averaging $28." Both reference statements mentioned the same monetary reference point, allowing us to identify the di¤erential e¤ect of the e¤ect of the reference point in the treatment groups. Our results suggest that both cooperative and competitive motives can drive higher contribution rates and total contributions, but the elicitation of competitive behavior is more pro…table to the fundraiser. Speci…cally, we …nd that the competitive and cooperative treatment groups contributed at a rate of 85% and 42% more than that of the control, respectively. Furthermore, while the cooperative treatment induced more contributions concentrated near the given reference point ($28), the competitive treatment induced more contributions at nearly twice the level of the given reference point (around $50). As a result, the competitive and cooperative treatment groups yielded 82% and 16% higher total monetary contributions than the control, respectively. Several papers have studied the e¤ect of "social information" on solicitation behavior.1 For example, Frey and Meier (2004) conducted a …eld experiment in which students that are asked contribute to a University fundraising campaign are informed that certain percentages of students have contributed to the campaign in the past. The authors …nd evidence of conditional cooperation - after controlling for past contribution history, there is a signi…cant (although relatively small) 4.6 percentage points increase in the contribution rate between students informed of high (64%) past contribution rates versus low (46%) past contribution
1
There are also many papers in which reference points are used to change contribution behavior in cooperative situations (without explicit social information), such as DeJong & Oopik (1992), Desmet and Feinberg (2003), Fraser, Hite and Sauer (1988), Schibrowsky & Peltier (1995), Smith and Berger (1996), Weyant (1996). Broadly, these papers show that reference points do a¤ect contribution behavior, with high reference points often increasing the amount of contributions but decreasing the contribution rate.
2
rates.2 Shang et al (2005,2006,2008) use multiple …eld experiments with a public radio solicitation drive to study the e¤ect of social information on contribution amounts. Broadly, these papers use a variety of social comparisons ("A member like you just contributed...", "She just contributed...") and an array of reference points to show that social comparisons can a¤ect contribution rates and amounts, particularly for new contributors and when there is a high similarity between the donor and the reference individual.3 There are also multiple papers about the e¤ect of intergroup competition on intragroup cooperation. In the laboratory, Bornstein and Ben-Yossef (1993) show that participants are almost twice as likely to cooperate in a prisoner’s dilemma game when it is embedded in a game with intergroup competition. Similarly, Bornstein et al. (2002) use a laboratory experiment to demonstrate that intergroup competition increases group e¢ ciency in a coordination game. Finally, in a laboratory-like …eld experiment on an orange grove with free-riding inducing group payment schemes, Erev et al. (1999) show that subjects’ productivity increases when there is competition across groups. More generally, there are related papers on the e¤ect of di¤erent incentives in charitable giving, such as matching schemes (Huck and Rasul (2008)), seed money (List and LuckingReily (2002)), rebates (Eckel and Grossman (2005)), and gift exchange (Falk (2007)). There are also many papers pointing to the e¤ect of cooperative motives, both laboratory ((Fischbacher, Gächter and Fehr (2001)) and theory (Rabin (1993)) based. In the next section, we describe the Congressional campaign environment and the …eld experiment. Section 3 describes di¤erential contribution rates and amounts across treatment groups. Section 4 concludes with a discussion.
2
The Field Experiment
2.1
The Congressional Election and the Intervention
The experiment took place during a 2008 campaign for the US House of Representatives in Florida. We worked with the Democratic challenger, who had never run for public o¢ ce in Florida. The district had a high percentage of registered Republicans (62%) and had consistently voted for Republican candidates in previous national races. The Republican candidate was the incumbent and had held the o¢ ce since 1988. Working with the candidate, we identi…ed 10,000 potential donors to receive a solicitation postcard in the …nal weeks of the campaign. These recipients were chosen from a list of past donors to Democratic campaigns and a set of voters identi…ed as strong Democrats from their participation in past primary elections (as determined by public voting records). The majority (over 70%) of the recipients lived in the congressional district contested by our candidate. The recipients were randomly assigned to one of three treatment groups. Each of these 2
The authors are able to present these di¤erent contribution rates without being deceptive by use of vague language in describing the statistics. We employ a similar technique to ensure that the reference contribution amounts are the same across our two treatment groups. 3 In this paper, we show that people contribute more when given information about individuals that are di¤ erent than them because that di¤erence also implies that the person is a competitor.
3
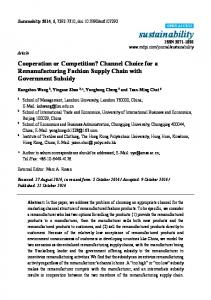
Figure 1: The three solitication postcards sent to (from left to right) the control, cooperative, and competitive groups.
groups received a large postcard with a picture of the candidate and a short message urging them to contribute to the campaign: see Figure 1. The text of the postcard was written to convey the message that the race was close and that marginal contributions could be pivotal. The only di¤erence between the groups was a single emphasized sentence in the center of the message:4 Control Group: "Your contribution can make a big di¤erence." Cooperative Treatment: "Small Democratic contributions have been averaging $28" Competitive Treatment: "Small Republican contributions have been averaging $28" We performed the experiment with two broad hypotheses: Hypothesis 1: Social Information, whether cooperative or competitive, will induce higher rates of donation. Hypothesis 2: The distribution of donations will be a¤ected by the reference point, as well as the social group mentioned in the treatment
2.2
Data and Identi…cation
After the mailing were send out, the candidate began to receive contributions in the mail and online, which were recorded by campaign sta¤. Before we discuss the data and demonstrate that the sample is balanced across treatment groups, it is necessary to address two issues concerning the data. First, during the time of the mailings, the candidate was involved in other campaign activities (such as a fund-raising concert) which might have also prompted donations from recipients of the postcard. In most cases, these donations were marked by the campaign and are excluded from our sample. Still, there are a handful of questionable cases. Luckily, the number of these cases is relatively small as the mailing was sent out 10 days before election day. In the analysis, we only use donations by mailing recipients that occurred one week after the receipt of the mailing and are not clearly due to any other campaign event. The results are robust to changes in the window of acceptance. Second, although we attempted to remove duplicates from our mailing list (people who had given to multiple Democratic campaigns might appear on our master list more than 4
Note that these are true statements given that "small" contributions are de…ned as those less than $75.
4
once), we discovered that three recipients were placed in multiple treatment groups after the mailings were sent out. We removed these recipients from the list, leaving a total of 9,992 recipients. Once we determined our …nal list, we obtained several demographic characteristics of the recipients by matching their names and addresses with Florida voter …les. This publicly available information contains the name, address, sex, age, race, and registered party a- iation for all registered voters in the state. We were able to match 8,750 of the 9,992 recipients, including all of the actual donors.5 In order to include non-matched recipients in the regression analysis below, we assume that they have the average characteristics of the matched recipients. The …rst column of Table 1 characterizes the recipients as a whole. The recipients are mostly older and white, re‡ecting the demographic make-up of the district. As expected, most of the sample consists of Democrats, although 6% are Republicans who contributed to Democratic races in the past. Columns 2-4 of Table 1 contain mean demographic characteristics of each group, while columns 5-7 contain p-values of F-tests of the equality of the means. Note that the only signi…cant di¤erence at the 5% level is between the Cooperative and Control groups with respect to age: a 0.7 year di¤erence. Given that the sample is presumably also balanced in other outcome-relevant chacteristics that are unobservable and that we control for all observable demographic variables in the analysis, our randomization allows for the identi…cation of the di¤erential e¤ects of the treatments.
3
Results
3.1
Donation Rates
Our …rst main result concerns the donation rate. Table 2 details donation rates for the sample as a whole and across groups, as well as the p-value of tests of equality across groups. Overall, the donation rate was 1.1%, which was slightly above the expectation of the campaign. This table suggests our …rst main …nding in this paper: Finding 1: The use of social information and a reference point increased the donation rate. The donation rate in the competitive treatment was 85% higher than that of the control treatment, and signi…cant (p-value=0.02). The cooperative treatment was 42% higher than the control, although not signi…cant (p-value=0.23). As would be expected in a balanced random experiment, a Probit regression which controls for demographic variables does not change the point estimates or signi…cance in a dramatic way, as shown in Table 3. While our results suggest that the competitive treatment led to a higher donation rate than the control, the e¤ect of the cooperative treatment is less clear. This is due to the small number of donations and the location of the point estimate (nearly exactly between the estimate of other groups).
5
The unmatched recepients likely had signi…cant misspellings in their names and addresses or had moved.
5
3.2
Donation Distribution
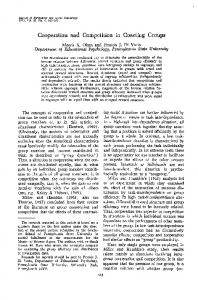
Our second main result concerns the donation distribution of the di¤erent treatment groups. The bottom panel of Table 2 shows the descriptive statistics for the sample as a whole and for each group, as well as the p-value of a test of the mean equality to the control group. While there is a di¤erence in the unconditional donation amount, the di¤erence is driven by the donation rates observed above. In fact, there is no signi…cant di¤erence in the means of donations conditional on donating (the intensive margin of donating). The mean donation conditional on donating across all groups is $62.75. However, while there is no di¤erence in the conditional mean contribution amount, visual inspection of the frequency distributions (shown in Figure 2) suggests that the treatments did have an e¤ect on the distribution of amounts. Furthermore, the common reference point of $28 in the Cooperation and Competition treatments appears to have induced a di¤erential e¤ect on the distribution. The cooperative treatment appears to have a larger concentration in the $20-$30 range, while the competitive treatment appears to have a much larger spike at the $50 level. Note that the reference point had an absolute e¤ect as well, in that there are multiple donations of $28 for the Competitive and Cooperative treatment groups and none for the Control group.
Control Group
Cooperative Treatment
Competitve Treatment
25
50
75
100
150
200
250
300
Amount Figure 2: Histogram of the Donation Amounts of the Control (top), Cooperative (middle), and Competitive (bottom) Groups.
To demonstrate these di¤erences more clearly, the plot in Figure 3 displays the di¤erences between the frequency distribution of the two treatments and the control for donations at 6
or less than $100, which represents the vast majority (94%) of donations. This …gure could be interpreted as the additional e¤ect of the cooperative and competitive treatments above the control, given that all groups would have contributed with the exact same distribution if they received the control mailing. Clearly, the majority of "additional" contributions in the cooperative treatment appear to be centered in the $20-$30 range, whereas there are multiple "additional" contributions in the competitive treatment at $28, $50, and $100, with the majority located at $50.
Difference between Cooperative and Control Distributions
0
25
50
75
100
Dollar Amount Difference between Competitive and Control Distributions
0
25
50
75
100
Dollar Amount
Figure 3: The Di¤erence between the Ally/Rival Treatments and the Control Contribution Distributions for all Contributions less than $100. To test this e¤ect statistically, we run a probit regressions on the probability of contributing between $20-$30, $50, and $100, with the results reported in Table 4. This leads to our second set of results: Finding 2: The members of the cooperative treatment were more likely to contribute $20-$30 than those in the control, but not more likely to contribute $50 and $100. Finding 3: The members of the competitive treatment were more likely to contribute $50 than those in both other groups, but not more likely to contribute $20-$30 and $100. Note that the members of the competitive treatment were more likely to contribute $50 than those in the cooperative group, but the members of the cooperative group were not more likely to contribute $20-$30 than those in the competitive group. Finally, note that 7
there is no other $10 interval (such as $10-$20) that does not include $25 or $50 in which either group contributes at a signi…cantly higher rate than the control. Thus, it appears that the "additional" donations are concentrated at these points. While the interpretation of this result is open, it appears that the cooperative treatment induces people to donate around (or slightly lower) than the reference point, whereas the competitive treatment induces people to donate nearly twice as much the reference point.
4
Discussion and Conclusion
This paper presents the results of a …eld experiment in which a political solicitation was sent to a large group of potential donors that contained information about previous donations of those on the same political side ("cooperative"), those on the other side ("competitive"), or no information about past donations ("control"). We …nd that both treatments induced changes in the donation rate and distribution amounts in comparison to the control group, but the competitive treatment was more e¤ective overall. Interestingly, while members of the cooperative group were more likely to contribute around the stated reference point of their peers, the members of the competitive group were more likely to contribute nearly an amount of nearly twice the stated reference point. The behavior elicited in our experiment is consistent with a variety of explanations, which we cannot distinguish with our experimental design. In their experiment, Frey and Meier (2007) mention three potential explanations for people to contribute more to a public good as a result of social information about their peers: People may desire to conform to social norms; people may exhibit some level of fairness-based preferences; and contributions by others may signal the quality of the public good (the candidate). In a competitive public goods framework, players also have reasons to change their behavior when given information about contributions of players on the opposing group. For example, as demonstrated in past research, people appear to receive utility from winning, particularly in competitive settings, perhaps leading them to contribute a higher amount. However, even a purely outcomefocused person might be induced to contribute more as a result of social information if it changes her perception about the distribution of potential total contributions of the opposing group in a certain way (of course, another change might could also induce her to contribute less). We believe that understanding the precise way that these motivations interact could clarify our result and its potential impact on pro…t-maximizing solicitation behavior.
References Bornstein, G. and Ben-Yossef, M. (1994). Cooperation in Intergroup and Single-Group Social Dilemnas. Journal of Experimental Social Psychology 30, 52-67. Bornstein, G., Gneezy, U., and Nagel, R. (2002). The e¤ect of intergroup competition on group coordination: an experimental study. Games and Economic Behavior 41, 1–25
8
DeJong, W., and Oopik, A. (1992). E¤ect of legitimizing small contributions and labeling potential donors as helpers on response to a direct mail solicitation for charity. Psychological Reports 71, 923–928. Desmet, P. and Feinberg F. (2003). Ask and ye shell receive: the e¤ect of the appeals scale on consumers’donation behavior. Journal of Economic Psychology 24, 349-376. Erev, I., Bornstein, G., and Galili, R. (1993). Constructive Intergroup Competition as a Solution to the Free Rider Problem: A Field Experiment. Journal of Experimental Social Psychology 29, 463-478. Falk, A. (2007) Gift-Exchange in the Field. (Working Paper). Fischbacher, U., Gächter, S., and Fehr, E. (2001): Are People Conditionally Cooperative? Evidence from a Public Goods Experiment, Economics Letters, 71, 397-404 Fraser, C., Hite, R. and Sauer, P. (1988). Increasing contributions in solicitation campaigns: the use of large and small anchor-points. Journal of Consumer Research 15, 284-287. Frey, B. and Meier, S. (2004). Social comparisons and pro-social behavior: testing “conditional cooperation” in a …led experiment. American Economic Review 94 (5), 1717- 1722. Huck, S. and Rasul, I. (2008) Comparing charitable fundraising schemes: evidence from a natural …eld experiment. (Working Paper). List, John and Lucking-Reiley D. (2002). The E¤ects of Seed Money and Refunds on Charitable Giving: Experimental Evidence from a University Capital Campaign. Journal of Political Economy 110, pp.215-233. Rabin, M. (1993). Incorporating Fairness into Game Theory and Economics. American Economic Review 83(5), pp. 1281-302. Schibrowsky, J., and Peltier, J. (1995). Decision frames and direct marketing o¤ers: A …eld study in a fundraising context. Journal of Direct Marketing 9(1), 8–16. Shang, J. and Corson, R. (2005). Field Experiments in Charitable Contribution: The Impact of Social In‡uence on the Voluntary Provision of Public Goods. (Working Paper). Shang, J., Corson, R., and Reed, A (2006). "I" Give, But "We" Give More. (Working Paper). Shang, J. and Croson, R. (2008). The Impact of Social Comparisons on Nonpro…t Fundraising. Research in Experimental Economics, Forthcoming. Smith, G. and Berger, P. (1996). The impact of direct marketing appeals on charitable marketing e¤ectiveness. Marketing Science 24, 219-231. Weyant, J. (1996). Application of compliance techniques to direct-mail requests for charitable donations. Psychology and Marketing 13(2), 157–170.
9
Table 1: Pre-Treatment Balance of Groups All
Treatment Group
(1)
P-value on Tests of Equality of Means (5) (6) (7) Comp=Coop Comp=Cont Coop=Cont 0.48 0.51 0.17
(2) (3) (4) Comp Coop Contr Male 0.47 0.47 0.48 0.46 (0.01) (0.01) (0.01) Age 61.4 61.2 61.1 61.9 0.82 (0.26) (0.26) (0.26) Democratic 0.91 0.90 0.91 0.90 0.24 (0.01) (0.01) (0.01) Republican 0.060 0.062 0.054 0.065 0.17 (0.004) (0.004) (0.004) White 0.84 0.85 0.84 0.85 0.22 (0.01) (0.01) (0.01) Black 0.11 0.10 0.11 0.11 0.49 (0.01) (0.01) (0.01) Note: Level of signi…cance: *** p