Using Data Mining Techniques for Predicting Future Car market Demand DCX Case Study Mouhib Al-Noukari
Wael Al-Hussan
Arab International University Damascus, Syria
[email protected]
The Arab Academy for Banking and Financial Sciences Damascus, Syria
[email protected]
Abstract—Data mining techniques provide people with new power to research and manipulate the existing large volume of data. Data mining process discovers interesting information from the hidden data which can either be used for future prediction and/or intelligently summarizing the details of the data. There are many achievements of applying data mining techniques to various areas such as marketing, medical, financial, and car manufacturing. In this paper, a proposed data mining application in car manufacturing domain is explained and experimented. The application results demonstrate the capability of data mining techniques in providing important analysis such as launch analysis and slow turning analysis. Such analysis help in providing car market with base for more accurate prediction of future market demand. Keywords: Data mining; car market; launch analysis, slow turning analysis, knowledge discovery.
I. INTRODUCTION The aim of this paper is to provide a proposed data mining solution that can be used for automotive market, as well as many other areas. This solution can provide inventory managers with important analysis such as launch analysis and slow turning analysis. The use and benefits of these two analyses will be identified, and explained. A DCX1 case study will be presented in detail in order to demonstrate the capability of data mining techniques in the field of car manufacturing. Such techniques will help manufacturers finding answers for questions like: which vehicle models sell slowly? Which vehicle packages for a given body model sell slower? Which packages and options for a body given model sell slower?. Launch analysis will provide manufacturers with comparison analysis between “what the customer wants” and “what supply chain is providing”. II.
THEORETICAL FRAMING
It is noted that the number of databases keeps growing rapidly because of the availability of powerful and affordable database systems. Millions of databases have been used in business management, government administration, scientific and engineering data management, and many other 1
DCX includes: DaimlerChrysler, Dodge, and Jeep.
applications. This explosive growth in data and databases has generated an urgent need for new techniques and tools that can intelligently and automatically transform the processed data into useful information and knowledge, which provide enterprises with a competitive advantage, working asset that delivers new revenue, and to enable them to better service and retain their customers [24]. Data mining application are characterized by the ability to deal with the explosion of business data and accelerated market changes, these characteristics help providing powerful tools for decision makers, such tools can be used by business users (not only statisticians) for analyzing huge amount of data for patterns and trends. Consequently, data mining has become a research area with increasing importance and it involved in determining useful patterns from collected data or determining a model that fits best on the collected data [7, 17, 21]. Different classification schemes can be used to categorize data mining methods and systems based on the kinds of databases to be studied, the kinds of knowledge to be discovered, and the kinds of techniques to be utilized [4, 15, 25]. A data mining task includes pre-processing, the actual data mining process and post-processing. During the pre-processing stage, the data mining problem and all sources of data are identified, and a subset of data is generated from the accumulated data. To ensure quality the data set is processed to remove noise, handle missing information and transformed it to an appropriate format [20]. A data mining technique or a combination of techniques appropriate for the type of knowledge to be discovered is applied to the derived data set. The last stage is post-processing in which the discovered knowledge is evaluated and interpreted. Data mining techniques used in business-oriented applications are known as Business Intelligence (BI). BI is a general term to mean all processes, techniques, and tools that gather and analyze data for the purpose of supporting enterprise users to make better decisions [13]. The difficulty of discovering and deploying new knowledge in the BI context is due to the lack of intelligent and complete data mining system. The measure of any business intelligence solution is its ability to derive knowledge from data. The challenge is met with the
ability to identify patterns, trends, rules, and relationships from volumes of information which is too large to be processed by human analysis alone. III. A PROPOSED DATA MINING APPLICATION IN AUTOMOTIVE MANUFACTURING DOMAIN: DCX CASE STUDY Automotive manufacturing are markets where the manufacturer does not interact with the consumer directly, yet a fundamental understanding of the market, the trends, the moods, and the changing consumer tastes and preferences are fundamental to competitive. The information gathered in order to produce DCX’s automotive data mining solution are the following:
summarization, and dependency modeling methods in our suggested analysis. A. Launch Analysis The basic idea of the Launch Analysis is to make the webactivity of “Build and Price” facility (A tool provided at DCX web site helping visitors building their own car models), consider each configuration made and draw an early measure of the customers’ interest for a specific vehicle(s) then compare it to the production plan, inventory sales and dealers’ orders to find out any possible issues in the supply chain. For example, customers may have higher demands/capacity in configurations for some models more than what dealers request or what production plan offers. So, this analysis can provide the brand managers and inventory managers with metrics during the launch of a new vehicle by using the “Build and Price” activity as the early indication of future customer demand.
•
Supply chain process (sales, inventory, orders, production plan).
•
Manufacturing information configurations/packages/options codes description).
•
Marketing information (dealers, business centers… etc).
Launch analysis is getting their base data for analysis from DCX data warehouse which integrates multiple data sources including supply chain data (Order, Production Plan, Inventory and Sale) and web click-stream “Build and Price” data (Car configuration).
•
Customers’ activities).
This analysis provides DCX with important knowledge about:
trends
information
(websites
(car and
web-
An enterprise data warehouse is built to hold web data, inventory data, car demand data and sales data to better analyzing and predicting car sales, managing car inventory and planning car production. Sales and marketing managers are interested in better leveraging data in support of the enterprise goals and objectives. Managers envision an analytic environment that will improve their ability to support planning and inventory management, incentives management, and ultimately production planning, in addition to enable them to meet the expectations of their decision-making process which is supported by appropriate data and trends. Regardless of functional boundaries and type of analysis needed, their requirements focus on improving access to detailed data, more consistent and more integrated information. Managers are interested especially in integrated data spanning DCX’s relationship with its customers and prospects regardless of whether the systems are online or offline. Having a data warehouse that combines online and offline behavioral data for decision-making purposes is a strategic tool which business users can leverage to improve sales demand forecasting, improve model/trim level mix planning, adjust body model/trim level mix with inventory data, and reduce days on lot. DCX wants to help the inventory managers to move vehicles faster. In order to do this it needs to identify which vehicles stay long in stock as well as which vehicles move faster. DCX also wants to make early indication on which vehicle configurations are likely to sell well during new vehicles launching. These analyzes are related because they all require gathering data, scrubbing it, storing it, mapping it and finally aggregating it for the purpose of research and analysis. Among different data mining methods, we used classification,
•
Early indicator of the customers’ interest of newly launched vehicles (“what the customer wants”).
•
Comparison analysis between “what the customer wants” and “what supply chain is providing” by comparing websites web-activity to inventory, order, sale and production plan.
DCX uses this knowledge to predict consumer purchasing behavior, and provide actionable vehicle launch, sales and inventory insight. B. Slow Turn Analysis This analysis aims to identify vehicles which do not sell in fast way (as a result we can also know the vehicle that sell faster). We can identify the vehicles at different levels of the vehicle configuration hierarchy. In other words we answer questions like: Which vehicle models sell in slow way? Which vehicle packages for a given body model sell slower? Which packages and options for a body given model sell slower?. C. Solution Overview DCX data mining solution starts by processing Stock/Sale/Order data, web data, dealer data and GAQ (Get a Quote) data and store them in a data warehouse named “Vehicle Demand Data Warehouse”. The data warehouse was designed in order to support analysis that aim to use web data, inventory data, car demand data and sales data to better analyzing and predicting car sales, managing car inventory and planning car production. Inventory managers, brand managers and sales managers are demanding more metrics for analyzing
ETL the data sources to the data warehouse.
•
Processing the data warehouse to generate the required data marts.
•
Building the required data marts and OLAP cubes.
•
Generating the reports.
•
Delivering the analysis in the form of Excel workbooks, and PowerPoint slides.
The data sources used for this solution are the followings: •
”Stock/Sales/Orders” data sources are snapshots at the (exact) date of data.
•
“Production Plan” data source is a list of models quantities that are planned to be produced for a specific period.
•
“TOPs” data source is a structured data which is used to map all car configurations under production.
•
“SPOT” data source is used to list dealers, in addition to their rating and their geographic information.
•
“Web Activity” data source is used to track all user web hits/requests on DCX websites.
The ETL was designed for transforming heterogeneous data sources formats into flat file format in order to load it as bulk insert, to gain higher performance.
•
Geographic dimension is used to map “ZipCode” to “Zone/Business Center/State”.
•
Dealer dimension id used to map DCX dealers.
The data warehouse maintains also the following fact tables: “CarConfig” is used to store “Build and Price” configurations made on DCX web-sites. “Stock/Sales/Order” are used to store orders, sales and stock made on DCX vehicles. “Production Plan” is used to store production of DCX plans intending to achieve. Data in a warehouse is typically updated only at certain points in time (Weekly/Monthly/Yearly in our case). In this way, there is a tradeoff exists between the correctness of data and the substantial effort required to bring the data into the
Data Sources
Stock
Sales
Orders
ETL packages
CarConfig Processing
TOPs Processing
Final Stage Processing
Stock Processing
Sales Processing
Orders Processing
ST data mart
LA data mart
LA OLAP Cube
Report Metadata Report Generator
Reports
TOPs dimension used to map all car configurations under production. This dimension is used to map vehicles “Franchise/Year/Model/Package/Option” to their “Codes/Descriptions/OptionTypes/DefaultOptions”.
TOPs
Report Request Metadata
The data warehouse maintains the following dimensions: •
Production Plan
ETL
•
Web Activity
ST/LA DW
Receiving and validating the data sources.
Processing
•
Data Marts
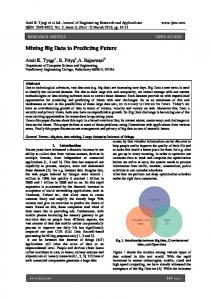
The main steps for providing the Slow Turn/Launch analysis are the following (Figure 1):
Reporting
the past (i.e. inventory) and predicting the future (i.e. vehicle sales, mix and launches). These metrics need to be delivered seamlessly with high quality and in a timely fashion. This will get DCX closer to better understanding consumer demands and better managing the customer relationship.
Figure 1: Slow Turn/Launch Analysis Pipeline
warehouse. Data warehouses also provide a great deal of opportunities for performing data mining tasks such as classification and summarization [3, 26]. Typically, updates are collected and applied to the data warehouse periodically in a batch mode, (e.g., during the night). Then, all patterns derived from the warehouse by some data mining algorithm have to be updated as well. Processing is the stage where data is processed, summarized and aggregated in order to create the required reporting data marts. The processing stages are:
•
TOPs stage: generates the reporting version of the TOPs, in order to have a centralized mapping schema that provides the latest version on the TOPs.
XML-based metadata used to store the reporting parameters for each report request made by the customer (report name, start date, end date, franchise, family, etc.).
•
CarConfig stage: generates the reporting CarConfig data mart (this data mart serves number of reports for launch analysis, where the study is only for customers trends on web “Build and Price” activities).
•
Inventory stage: generates the reporting inventory data mart. The inventory data is a snapshot of the inventory stock on the cutoff date.
•
Order stage: generates the reporting order data mart. The order data is a snapshot of the dealer orders on the cutoff date.
A report metadata object library is used to encapsulate the reporting metadata repository and present the interface to read/manipulate it. The launch analysis report generator is the core reporting automation engine. It drives all reporting process, coordinates the internal and underlying components jobs and delivers the final reports. This component is primarily made to automate generating a huge number of reports requested on a regular basis (daily/weekly/monthly/yearly). This component encapsulates the pivot reporting component, PowerPoint generating component, and workflow component.
• •
Sale stage: generates the reporting sale data mart that covers the studied period. Final stage: generates the final reporting data mart that combines all the data marts created previously in order to serve the Slow Turn/Launch analysis reporting needs (note that Slow Turn analysis works on OLAP cubes built above this data mart).
As a result of the processing pipeline, number of data marts created to cover the reporting needs over time. Data marts are data stores which are subordinated to the data warehouse [8, 12, 23, 26]. The main two data marts created are: Launch analysis data mart, and Slow Turn analysis data mart. Slow turn analysis is not performed against the data marts directly; instead it is performed against OLAP cubes built above Slow Turn data mart, such OLAP cubes provide analytics with aggregations, drilldowns, and slicing/dicing of data [23, 24, 27].
The reports deployed cover a wide range of ST/LA analysis. Such reports include: •
Models web car configurations through business centers, early indications of the customers’ interest in newly launched vehicles through Business Centers.
•
Models web car configurations, open dealer orders, production plan, K-stock and sales comparison, gives a comparison analysis between “what the customer wants” (web car configuration) and “what supply chain is providing” by comparing inventory, order, sale and production plan with the model web car configurations.
•
Models slow turn analysis: identify vehicles that do not sell fast (help also knowing the vehicle that sell fast) by: identifying inventory slow-turning options or option combinations, and studying dealer awareness of such issues, analyzing performance by determining slow or fast turning options or option combinations, analyzing inventory by validating the results of performance analysis and determining the options or option combinations having stock problems, analyzing sales by validating the results of performance analysis and determining the need for drilling down to more detailed analysis, and analyzing orders by studying dealer awareness of the results of the performance analysis.
The last stage in our solution pipeline is the reporting stage. It uses the data stored in the ST/LA data marts, and OLAP cubes created for slow turning analysis in order to finally arrive to a strategic data reporting solution, which supports the entire organization needs of information at the highest possible degrees of flexibility and customizability that allows addressing changeful reporting needs such as ST/ LA analysis and other types of analysis.
IV.
CONCLUSIONS AND FUTURE WORKS
Powerful business intelligence and reporting solution should have the capabilities to handle the complexities and diversity of data information in the data warehouse and data marts [6, 8]. ST/LA analysis solution addresses the custom development of an enterprise-wide data warehouse solution, thus it can be used for many other analysis besides slow turn and launch analysis, such as prediction analysis.
We provided in this paper, a survey on the data mining techniques developed in car market area. A classification of the available data mining techniques was also provided, based on the kinds of databases to be mined, the kinds of knowledge to be discovered, and the kinds of techniques to be adopted. This survey is organized according to one classification scheme: the kinds of knowledge to be mined.
The approach is focusing on being able to deliver a big number of multi-dimensional pivot reports (for all DCX vehicles models) in a short time frames based on the incremental ST/LA analysis data marts. The core engine for delivering the ST/LA multi-dimensional pivot reports is the report generator. It’s designed to be able to read from multiple data warehouse schemas (a simple Ad-Hoc query, a data mart and OLAP cubes). The reporting layer contains a report metadata which is an XML-based metadata used to store the reports templates, and a report request metadata which is an
A DCX case study was presented in order to demonstrate the capability of data mining techniques in providing important analysis such as launch analysis and slow turning analysis. Future work can be done using the same architecture includes: •
Market demand forecasting, down to “micro-market” segmentation and predicting of sales, loyalty rates, and market share forecasting.
•
Incentive effectiveness analysis and tracking and scoring of special marketing investment such as rebates, financing offers, and other incentives issues to dealers, agents, or distributors.
•
Market segmentation and precise targeting to the segment and the individual as appropriate.
•
Optimizing on-line interaction systems and tracking and understanding on-line consumer behavior to predict market trends off-line.
Sales prediction by individual item model tailored to each individual “micro-market” and accounting for general market trend information including a modeling of changing consumer trends. REFERENCES [1]
S. Bongsik, “An exploratory investigation of system success factors in data warehousing”, Journal Of The Association For Information Systems, vol. 4, pp. 141-168, 2003. [2] L. Cabibbo and R. Torlone, “An architecture for data warehousing supporting data independence and interoperability: an architecture for data warehousing”, International Journal Of Cooperative Information Systems, vol. 10, no. 3, 2001. [3] D. Calvanese, G. D. Giacomo, M. Lenzerini, D. Nardi, and R. Rosati, “Data integration in data warehousing”, International Journal Of Cooperative Information Systems, vol. 10, no. 3, pp. 237, 2001. [4] N. Chan, H. Wong, “Data mining of resilience indicators”, IIE Transactions, vol. 39, no. 6, pp. 617-627, 2007. [5] S. Elkaffas and A. Toony, “Applications of genetic programming in data mining”, Enformatika; vol. 17, pp. 1-5, 2006. [6] M. Ester, H. P. Kriegel, J. Sander, M. Wimmer, and X. Xu, “Incremental clustering for mining in a data warehousing environment”, Proceedings Of The 24th Vldb Conference, New York, USA, 1998. [7] U. Fayyad, G. Piatetsky-Shapiro, and P. Smyth, “From data mining to knowledge discovery in databases”, American Association For Artificial Intelligence. AI Magazine, pp. 37-54, 1996. [8] J. Fong, Q. Li, and S. Huang, “Universal data warehousing based on a meta-data modeling approach”, International Journal Of Cooperative Information Systems, vol. 12, no. 3, pp. 325, 2003. [9] L. Greiner, “Data warehousing”, Computing Canada, vol. 28, no. 16, pp. 12, 2002. [10] M. Hauben, V. Patadia, and D. Goldsmith, “What counts in data mining?”, Drug Safety, vol. 29, no. 10, pp. 827-832, 2006. [11] W. Hugh, A. Thilini, Jr. Matyska, and J. Robert, “Data warehousing stages of growth”, Information Systems Management; vol. 18, no. 3, pp. 42-51, 2001.
[12] N. Jukic, “Modeling strategies and alternatives for data warehousing projects”, Communications Of The ACM, vol. 49, no. 4, pp. 83-88, 2006. [13] N. Kerdprasop, and K. Kerdpraso, “Moving data mining tools toward a business intelligence system”, Enformatika;, vol. 19, pp. 117-122, 2007. [14] A. Kumar, “Interpretability and mean-square error performance of fuzzy inference systems for data mining”, International Journal Of Intelligent Systems In Accounting Finance & Management, vol. 13, no.4, pp. 185196, 2005. [15] K. Lange, “Differences between statistics and data mining”, DM Review, vol. 16, no. 12, pp. 32-33, 2006. [16] S. Lee, S. Hong, and P. Katerattanakul, “Impact of data warehousing on organizational performance of retailing firms”, International Journal of Information Technology & Decision Making, vol. 3, no. 1, pp. 61-79, 2004. [17] H. Mannila, “Methods and problems in data mining”, Proceedings Of International Conference On Database Theory, Delphi, Greece, 1997. [18] G. Liqiang and J. Howard, “Interestingness measures for data mining: a survey”, ACM Computing Surveys, vol. 38, no. 3, pp. 1-32, 2006. [19] D. Mukherjee and D. D'souza, “Think phased implementation for successful data warehousing”, Information Systems Management, vol. 20, no. 2, pp. 82, 2003. [20] R. Nayak and T. Qiu, “A data mining application: analysis of problems occurring during a software project development process”, International Journal Of Software Engineering & Knowledge Engineering, vol.15, no. 4, pp. 647-663, 2005. [21] K. Okuhara, H. Ishii, and M. Uchida, “Support of decision making by data mining using neural system”, Systems & Computers In Japan; 10/1/2005, vol. 36, no. 11, pp. 102-110, 2005. [22] M. J. Parzinger, “Creating competitive advantage through data warehousing”, Information Strategy: The Executive's Journal, vol. 17, no. 4, pp. 10-15, 2001. [23] A. Sen and A. P. Sinha, “A comparison of data warehousing methodologies”, Communications of The ACM, vol. 48 Issue 3, pp. 7984, 2005. [24] N. Stolba and A. M. Tjoa, “The relevance of data warehousing and data mining in the field of evidence-based medicine to support healthcare decision making”, Enformatika, vol. 11, pp. 12-17, 2006. [25] W. Smith, “Applying data mining to scheduling courses at a university“, Communications Of AIs; vol. 2005, no. 16, pp. 463-474, 2005. [26] A. Vaduva and T. Vetterli, “Metadata management for data warehousing: an overview”, International Journal Of Cooperative Information Systems, vol. 10, no. 3, pp. 273, 2001. [27] X. Youzhi and S. Jie, “The agent-based model on real-time data warehousing”, Journal Of Systems Science & Information, vol. 2, no. 2, pp. 381-388, 2004.