CAR-TR-734 ISR-TR-94-69 CS-TR-3344
Sept 1994
USING INTERACTION OBJECT GRAPHS TO SPECIFY GRAPHICAL WIDGETS David A. Carr1, Ninad Jog2, Harsha Prem Kumar, Marko Teittinen, and Christopher Ahlberg3 Human-Computer Interaction Laboratory, Department of Computer Science, & Institute for Systems Research University of Maryland, College Park, MD 20742 Copyright 1994, 1995 David A. Carr, Ninad Jog, Harsha Prem Kumar, Marko Teittinen, and Christopher Alberg. All rights reserved. email:
[email protected],
[email protected],
[email protected],
[email protected], &
[email protected] 1 2 3
also RMS, Inc., Code 520.9, NASA Goddard Space Flight Center, Greenbelt, MD 20771. Dept. of Electrical Engineering, University of Maryland Dept. of Computer Science, Chalmers Univ. of Technology, S-412 96 Göteborg, Sweden
ABSTRACT
This paper describes a new method for specifying widgets, the Interactive Object Graph (IOG). IOGs are an extension of statecharts designed for widget specification. They add special states which represent changes in the widget's appearance. These states enhance the readability of IOG diagrams. In addition, IOGs have the ability to represent and modify widget attributes. IOGs are described, and their use illustrated by specifying five new widgets: a range-selection slider, the AlphaSlider, a tree viewer, a treemap viewer, and a secure switch. For each widget there is a brief description of its operation and a specification. Our experience using IOGs to communicate the designs when implementing the above widgets is also described. Note: The application program interface (API) is defined in an appendix to this report. This appendix is not normally included with the report and must be requested. Copyright 1994, 1995 Carr et al.
1
05/16/95
The 11-year old Human-Computer Interaction Laboratory (HCIL) is an interdisciplinary effort within the Center for Automation Research. The main participants are faculty, staff, and students from the Department of Computer Science, Department of Psychology, and College of Library and Information Services at the University of Maryland, College Park, MD.
For single copies or a list of all HCIL technical reports please write to: Teresa Casey Human-Computer Interaction Laboratory A.V. Williams Building University of Maryland College Park MD 20742 email:
[email protected]
Copyright 1994, 1995 Carr et al.
2
05/16/95
USING INTERACTION OBJECT GRAPHS TO SPECIFY GRAPHICAL WIDGETS David A. Carr University of Maryland Department of Computer Science, University of Maryland Human-Computer Interaction Laboratory, and RMS, Inc., Code 520.9 NASA Goddard Space Flight Center Greenbelt, MD 20771
[email protected] Ninad Jog Department of Electrical Engineering & Human-Computer Interaction Laboratory University of Maryland
[email protected]
Harsha Prem Kumar Institute for Systems Research & Human-Computer Interaction Laboratory University of Maryland
[email protected]
Marko Teittinen Department of Computer Science, Human-Computer Interaction Laboratory & Institute for Systems Research University of Maryland
[email protected]
Christopher Ahlberg Department of Computer Science Chalmers University of Technology S-412 96 Göteborg, Sweden
[email protected]
ABSTRACT
This paper describes a new method for specifying widgets, the Interactive Object Graph (IOG). IOGs are an extension of statecharts designed for widget specification. They add special states which represent changes in the widget's appearance. These states enhance the readability of IOG diagrams. In addition, IOGs have the ability to represent and modify widget attributes. IOGs are described, and their use illustrated by specifying five new widgets: a range-selection slider, the AlphaSlider, a tree viewer, a treemap viewer, and a secure switch. For each widget there is a brief description of its operation and a specification. Our experience using IOGs to communicate the designs when implementing the above widgets is also described. KEYWORDS
User interface widget specification, User interface widget design
Copyright 1994, 1995 Carr et al.
1
05/16/95
1
INTRODUCTION
The University of Maryland Human-Computer Interaction Laboratory (HCIL) has designed and developed a number of new widgets. These widgets were generally developed as part of a prototype application. However, recent developments in platform-independent, User Interface Development Systems (UIDS) has made it possible to build these widgets for all major computer systems. Therefore, we decided to re-implement our more recent widgets using a commercial system. At the same time, we wanted to incorporate improvements discovered when these widgets were tested by users. These widgets include: 1. A range-selection slider that allows the user to set a range of values in the display space needed for a conventional slider. 2. An AlphaSlider that allows the user to select one item from a list of thousands with minimal display space. 3. A node-link tree viewer that along with the treemap viewer presents two different views of the same data and share a common data structure. 4. A treemap viewer that uses a space-filling algorithm to reduce the display space required to view a hierarchy. 5. A secure toggle switch that requires the user to drag the switch between positions to reduce the chance of accidental operation. An immediate need of this project was a method to communicate the new widget design. We wanted a system which was compact and formal. While not immediately required, we desired that this method could be the basis for rapid prototyping. In order to fulfill these needs the Interaction Object Graph was developed. 2
THE IOG SPECIFICATION METHOD
Specification of user interfaces has been used to aid in the design of user-computer dialog and software. This work has led to the development of User Interface Management Systems or UIMSs. These systems significantly reduce the work required to design and specify a usercomputer dialog. They also allow non-programmers to prototype and design complex user interfaces. However, current UIMSs assume that a set of widgets exist and manipulate the presentation of these widgets. If none of the interaction objects are quite what the designer wants, then either the designer must compromise and redesign the dialog with the interaction objects provided, or the desired dialog must be coded in a programming language and integrated into the UIMS. This section presents the Interaction Object Graph (IOG) as an approach to this widget-building problem. IOGs can be used to specify interaction objects at a higher level than programming languages. In succeeding sections IOGs have been used to specify the University of Maryland widgets. 2.1 Previous Research
Over the years a number of methods have been used to specify user interfaces. These include grammars, algebraic specifications, task description languages, transition diagrams, statecharts, interface representation graphs, rule-based systems and by demonstration.
Copyright 1994, 1995 Carr et al.
2
05/16/95
Shneiderman's [1982] multiparty grammars are an example of a grammar-based specification. A multiparty grammar divides non-terminals into three classes: user-input, computer, and mixed. User-input and computer non-terminals represent user actions and computer responses, respectively. Mixed non-terminals represent sequences in the human-computer dialogs. Multiparty grammars are good for modeling keyboard-based command language interactions, but are very awkward for direct-manipulation interfaces. Multiparty grammars do not model the inherently non-sequential nature of direct manipulation well. For example, consider a directmanipulation interface with two forms. The user can, and probably will, interleave completing the forms. In order to specify such an interface, the notation must support some way of describing interleaved action. While this is possible with a grammar the number of productions tends to increase as a product of the number of widgets. Thus, the number of productions quickly becomes unmanageable. Algebraic specification of window systems was introduced by Guttag and Horning [1980]. They proposed the design of a windowing system based on axiomatic specification of abstract data types. This method permits formally proving properties of the user interface. However, algebraic specifications have serious drawbacks. They are very difficult to read and require considerable time and training to understand. They are even more difficult to write. This makes them unsuited for communicating interface behavior. Task description languages concentrate on describing user actions. They were originally developed to model user performance, and most do not have any provision for describing system actions. Siochi and Hartson's User Action Notation (UAN) [1989; Hartson and Gray, 1992] is one language which also makes a contribution by specifying computer feedback and the internal state of the interface. Another paper [Hartson et al., 1990] corrected a major shortcoming by adding a link to the application computation. However, UAN concentrates heavily on describing user actions and is not well adapted to describing software state. In addition, UAN suffers from its task-description heritage. Traditionally, these languages have concentrated on specifying error-free behavior. Specifying system responses to unexpected user actions is awkward. Often the designer must explicitly consider every possible user input sequence and write an explicit system response. Unlike multiparty grammars, UAN does not have a symbol which matches all unspecified sequences. Finally, UAN's tabular notation does not readily show interactions between tasks which are governed by interface state variables. Another approach to modeling user interfaces is the transition diagram [Wasserman, 1985]. In this approach the transitions represent user inputs, and the nodes represent states of the interface. Computer outputs are specified as either annotations to the state or transitions. However, transition diagrams suffer from a combinatorial explosion in the number of states and transitions as system complexity increases. Jacob [1986] solved part of this problem by allowing concurrent states to coexist as parallel machines or co-routines. Co-routines did not completely solve the transition complexity problems for specifying interfaces with modal dialog boxes. Harel's [1987 & 1988; Wellner, 1989] statecharts were designed as a formal solution to the combinatorial problems with transition diagrams. The statechart adds the concept of a meta-state. Meta-states group together sets of states with common transitions that are inherited by all states enclosed in the meta-state. Since meta-states may enclose other meta-states, a complete inheritance hierarchy is supported. A special history state is supported to return the meta-state to its previous status on return transitions from events such as invoking help. Meta-states are divided into two types: parallel or AND-states and sequential or XOR-states. Meta-states
Copyright 1994, 1995 Carr et al.
3
05/16/95
enclosed within AND-states may execute in parallel and fulfill the function of co-routines. As originally defined, statecharts do not incorporate data flow or abstraction. Interface Representation Graphs (IRGs) were used by Rouff [1991; Rouff and Horowitz, 1991] as the underlying representation for their Rapid Program Prototyper. IRGs extend the statechart to represent dialog. These extensions are: IRG nodes represent a physical or logical component of the interface as well as a state. Data flow as well as control flow can be specified in an IRG. IRGs support inheritance of interface objects, data flow, control flow, and attributes. Constraints on data and control flow are supported. Finally to support UIMS functionality, IRGs permit specification of semantic feedback between the application and the user interface. However, the IRG specifies interaction between "widgets" and is not designed to specify new ones. The User Interface Design Environment (UIDE) uses pre- and post- conditions to control userinterface dialog [Gieskens and Foley, 1992]. Each widget in the user interface has two preconditions associated with it. One specifies when it is visible, and the other specifies when it is active. Each functionally separate action of the widget has a post-condition associated with it. As the user operates the interface, the post-conditions modify a blackboard representation of the user interface state. While expressed in a different style than state diagrams, the precondition/post-condition notation can be mapped into a state diagram. (Take the power set of all possible conditions which may be posted to the blackboard and use the precondition/postcondition pairs as the transition function.) The UIDE system does not provide for definition of new interaction objects. Both Olsen's PPS [1990; 1992] and Hill's Sassafras [1986] use rulebased systems which are similar to the precondition/post-condition method. A final technique used for specifying human-computer dialog is to do so by demonstration. Using this technique the designer places widgets on the screen, and the system makes inferences about the intended design. "Druid" [Singh et al., 1990] and "Peridot" [Myers, 1988] are two systems which build user interfaces by demonstration. Druid provides for interactive layout and dialog definition. However, its dialog model does not include constraints between interface objects or the modification of interface objects. Peridot is a similar system which includes constraints and modification by redrawing. Myers states that Peridot has two limitations. First, it does not support text input. Second, specifying operation sequences requires research. The above specification methods concentrate on describing interface behavior. However, interface layout and spatial relations between objects are also important. One approach to layout is simply to draw the interface. This method does not do very well when run-time re-sizing is allowed. Drawing the interface provides an absolute layout of the objects in the interface without any information about which spatial relationships can be adjusted when the interface is re-sized. Constraint grammars [Vander Zanden, 1989] solve this problem by using equations to specify the position of interface objects relative to a few, designer-defined positions in the interface. (e.g., the upper-left corner of a window or the window's midpoint.) Hudson's [1989] "Apogee" UIMS has a particularly clever method for graphically setting layout constraints. Galaxy™ [Visix, 1994] uses a springs and struts model for layout constraints. 2.2 Interaction Object Graphs
Interaction Object Graphs (IOGs) [Carr, 1994] are designed to add widget specification to Interface Representation Graphs. They combine the data flow and constraint specifications of Copyright 1994, 1995 Carr et al.
4
05/16/95
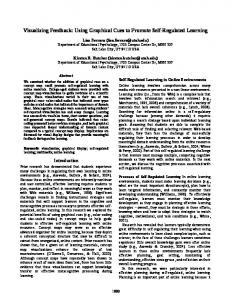
IRGs with the statechart, transition-diagram, execution model. This expands the statechart to show data relationships as well as control flow. It also permits specification of low-level interaction objects which cannot be specified by Interface Representation Graphs. Below is a brief description of the IOG state diagram, and a transition description language used to specify transition conditions. The IOG state diagram traces its lineage from UAN, statecharts, and IRGs. Statecharts added four new state types to the traditional state diagram. These states are used in IOGs. They are: the XOR meta-state, the AND meta-state, and two types of history state. The meta-states can contain both normal states and other meta-states. Transitions from metastates are inherited by all contained states. This helps reduce the problem of arc explosion. The XOR meta-state contains a sequential transition network. Exactly one state inside of an XOR meta-state is active when the XOR state is active. On the other hand, an AND meta-state contains more than one transition network. Each of these networks executes in parallel. A history state can only be contained in an XOR meta-state. Whenever a transition transfers control from a meta-state, the history state remembers which state was active immediately before the transition. If a later transition returns control to the history state, the meta-state is returned to the remembered state. History states help control state explosion. To see this, consider a specification of a help system which is independent of the user interface. An ordinary transition network would require replicating the help-system specification once for every state in the user interface. Otherwise, there would be no way to return to the user interface state that was active before help was requested. A statechart history state could receive the return transition from the help system, and only one copy would be required. There are two types of history states. They differ in how they treat a return when the last active state was a meta-state. The H state restarts meta-states at their start state and provides one level of history. On the other hand, the H* state restarts meta-states at their history state when they have one thereby allowing multilevel history. Figure 1 shows the representation of the new states. IOGs add two additional node types to the statechart, data objects and display states. Data objects were present in IRGs. However, their meaning is slightly different in IOGs. In IRGs, data objects represented communication between the user interface and the rest of the application. In IOGs they represent the storage of a data item, and control is never passed to them. They can Standard State
Display State
H History States
object name
Data Object
H*
AND Meta-state
XOR Meta-state
Start State
Figure 1 -- IOG node symbols.
Copyright 1994, 1995 Carr et al.
5
05/16/95
Condition
Condition
event name
Condition
Control Arc
data value D
E
Data Flow Arc
Event Arc
Figure 2 -- IOG arc symbols.
only be destinations for the data arcs discussed below. Display states are control states that have a change in the display associated with them. In IOG diagrams a picture of the display change is used whenever possible instead of a program-like statement such as "draw(ActiveON)". Data objects are represented as parallelograms. (Figure 1.) IOGs also add two special arc types: the event arc and the data arc. Events allow the designer to define "messages" which may be lacking in the underlying specification model. For example when specifying the trash can in the MacIntosh interface, one needs to know when a file is being dragged over it as opposed to when the pointer is being dragged over it. One way to do this would be for the file icon to generate a "dragging started" event and a "dropped" event. The trash can would then be highlighted whenever the pointer was over it between a "dragging started" event and a "dropped" event. An event is represented by a special transition passing through an E in a diamond. (Figure 2). Minimalists will argue that event arcs are not needed for internal widget control, and that they can be simulated by data. While none of the widgets specified here show it, sometimes the size of a widget's IOG diagram can be significantly reduced by splitting its behavior into two parallel XOR states and using an event to communicate between them. Also, replacing an event arc with data requires at least one data object and two data arcs. Furthermore, the data arcs are constrained to end at the data object while the event arcs need only pass out of the widget diagram. The net effect of this substitution is to increase diagram clutter and decrease diagram readability. Data flow is represented in a manner similar to events – an arc passing through a D in a circle (Figure 2). A data flow arc may have any state as a source and can only terminate at a data object or have an unspecified termination. In addition, at least one end must be attached to a data object. Data flow arcs with data objects as a source, whose destination arrow is unspecified, and whose destination is outside of the containing interaction object, indicate externally-readable data (Figure 3). This data may be used by the application or attached to other user interface components as a more complete specification is constructed. Data flow arcs with data objects as destinations represent updating the data object. If the arc's source is a control state, it represents a change in the value when the arc conditional is satisfied. In this case, the data flow arc is labeled
GenericWidget
D
Externally Writable
...
attribute
D
...
Externally Readable
Figure 3 -- A readable and writable widget attribute in an IOG.
Copyright 1994, 1995 Carr et al.
6
05/16/95
with the new object value. An arc without a source represents externally-writable data. Constraints are useful in specifying one attribute of the user interface in terms of others. With constraints it is simple to restrict an icon to be contained within a window or to map the values of a slider to a specific range. IOG data arcs support a form of one-way constraints by expressing the data value as an equation in terms of other attributes. Together with the condition on the data arc, these equations provide a means to constrain one attribute in terms of another with a Boolean guard. For example, specifying that in a given state (call it S) the image of a widget will follow the mouse cursor can be done with a constraint. This is accomplished by drawing a data arc from S to the data object representing the widget's location. Now, specify that the new value for the location is "old location + the change in the mouse position". The condition for the arc would be: "the mouse position changes". This results in the widget following the mouse while the widget control is in state S. 2.3 IOG Transition Descriptions
In order to describe the transitions between states, an abstract model of the user interface and a description language for that model are required. IOGs abstract the interface into the following objects: Booleans, numbers, strings, points, regions, icons, view ports, windows, and user inputs. A brief description of these objects follows. Booleans, numbers, and strings (BNS) are the usual abstractions with the usual operations. It should be noted that numbers contain both the real and integer data types. In addition, any of these may be converted into an icon representation by the operator icon(BNS, point, font, fontsize) or icon(BNS, region, font). Both operators convert the Boolean, number, or string BNS to a text representation, and then convert the text representation into a picture. If specified with a point, the resulting icon is as big as it needs to be to hold the picture of the text representation. If a region is specified, the icon is the size of the region. Fonts and font sizes may be omitted. In this case defaults will be used. Points are an ordered pair of numbers (x,y). Points have the algebraic operators which are normally associated with them. A point may be assigned a value by writing p=(x,y). In addition, p.x and p.y represent the x and y coordinates from the point p. A region is a set of display points defined relative to an origin called the location. The location of the region is always the point (minx,miny) where minx and miny are the smallest x and y coordinates in the region. Regions have a size operator which returns the height and width of the smallest rectangle which covers the region. Regions also have an in operator which tests if a point is in the region. This is written Region.in(pt) and returns a Boolean value. Although regions are not restricted to be rectangular, rectangles are most commonly used. Note, a region cannot be visible on the display. There is no drawing operation associated with a region. Icons are regions with pictures. That is, some points in the region have a color number attached to them and are shown on the display. Icons add the operations draw and erase. In addition, if the origin of the icon is changed, there is an implicit erase-draw operation sequence. Unless otherwise specified the region associated with an icon is a rectangle. So, icon("text", pt, default, default) would product an icon with the upper-left corner at pt. The picture would be the word "text" in the default font and size. There would be a region associated with the icon. This region would be a rectangle with its upper-left corner at pt and covering the text.
Copyright 1994, 1995 Carr et al.
7
05/16/95
A view port is a region with an associated mapping function for some underlying application data. The mapping would be in two parts: conversion to a world-coordinate-system graphics representation and projection onto the display. For example, text would first be converted from ASCII to a font representation and a location on a page. The page would then be projected onto the display. The mapping is controlled by a projection function (proj), a translation point (translate), and a scale-change point (scale). If convert is the conversion function for some object in some view port, then the function translate + proj(scale, (convert(object))) would be the view port mapping. Parts of objects projected to points not in the region are not displayed, and objects in view ports are addressed relative to the view port location. Windows group the above objects together. They add a level attribute which determines window stacking relative to other windows. They can be viewed as view ports containing only objects already mapped to display coordinates. A window with a lower level obscures an overlapping window with a higher level. Objects are addressed in the specification using a dot notation. For example, "win.icon1.location.x" would be the x coordinate of the location of icon, "icon1", in window, "win". User inputs are mapped to IOG events, numbers, points, and Boolean variables. Keyboard input is represented by quoted strings when the text is important ("quit↵" when the word quit is typed and followed by a carriage return) or key events similar to those in UAN when the event is important (LShiftv for left shift key pressed). The mouse is mapped into a point for location ∆ ), a Boolean indicating it moved (∆ ∆ M), button change (M@), a point for relative change (M∆ events (Mv, M^, M2v, ...), and button status variables (Mdn, Mup, M2dn, ...). Since the value of the mouse location is tested frequently, in[Region] is written as a shorthand for Region.in(M@). The special notations ~[Region] and [Region]~ mean the event of the mouse entering and leaving the Region. These symbols can be combined in expressions. Throughout the rest of this paper the operators from the 'C' language will be used for these expressions. (Most commonly, "&&" for logical and, "||" for logical or, and "!" for logical not.) 2.4 Example Widget Specification (Draggable* Icon)
In order to get a better idea of how an IOG specification is constructed and interpreted, a simple basic widget, a draggable icon, will be specified and explained. The draggable icon is a basic building block for later widgets such as the AlphaSlider and the range selector. Now, let's begin the draggable icon example. The draggable icon widget moves in both the horizontal and vertical directions. It returns a value which is related to its location. To operate it the user places the mouse over the icon and presses the button. This action will shift the widget from the non-tracking to the tracking state. The icon then follows the mouse as long as the mouse stays within a predefined region, called FreeArea (Figure 5). FreeArea will be used in subsequent widgets to confine slider indicators to the slider. Once the mouse leaves FreeArea the icon stops following the mouse. If the mouse is moved outside of a second larger region, called ActiveArea, the icon jumps back to its original position when the mouse button is released. ActiveArea lets the user stray outside the FreeArea without canceling the value change of the *
A word coined here to mean an icon that follows the mouse whenever the cursor is within the icon and then the left button is pressed.
Copyright 1994, 1995 Carr et al.
8
05/16/95
Idle
Active
Figure 4 -- Example icons for a draggable icon widget.
ActiveArea FreeArea
Figure 5 -- Example layout for ActiveArea and FreeArea.
widget, but still allows the user to cancel the value change by moving far enough outside the FreeArea. In order that the user may distinguish between the tracking and non-tracking states of the widget, there are two icons Active and Idle associated with the widget (Figure 4). The behavior of a draggable icon depends on four attributes. Two of these, location and old_value, are only accessible within the widget. One, selected, is read only. The last, value, is both externally readable and externally writable. The attribute, value, stores the setting of the widget and would be used by the application portion of a program. The attribute, location, is a point and represents the display coordinates of the icon. The programmer is not allowed to set this attribute because value determines the location, and it is externally writable. The old_value attribute stores value so that it may be restored if the user cancels the action by lifting the mouse button outside of ActiveArea. The selected attribute indicates whether or not the user is operating the draggable icon. The IOG specification for a draggable icon is shown in Figure 6. The widget specification starts with an AND meta-state named DragIcon that holds the four data attributes, and an XOR meta-state named behavior. The state, behavior, should be interpreted as follows. When started, the widget displays the Idle icon. Moving the mouse into the region defined by the Idle icon and pressing the mouse button causes value to be saved in old_value, sets selected TRUE, and displays the Active icon (via the Mv && in[Idle] arc). While in this state and in the FreeArea region, the cDrag constraint applies. (This constraint relates the mouse position to the value attribute of the draggable icon.) The cChg constraint between value and location always applies. Releasing the mouse button will cause selected to be set to FALSE and redisplay the Idle icon (via the M^ arc). Moving the mouse outside the ActiveArea region will transfer to the cancel? state (via the [ActiveArea]~ arc). Releasing the mouse button in this state will return the icon to its original position, update selected to FALSE, and display the Idle icon (via the M^ arc). Moving back into ActiveArea re-activates the icon tracking the mouse (via the ~[ActiveArea] arc).
Copyright 1994, 1995 Carr et al.
9
05/16/95
DragIcon behavior
value
old_value
D
Mv && in[Idle]
TRUE D
selected
D
M^ tracking
cDrag ~[ActiveIcon]
// cancel? M^
D
FALSE
[ActiveArea]~
D
∆Μ && in[FreeArea]
D
value D
D
old_value
D
cChg
location
Figure 6 -- Specification of a draggable icon.
All that remains is to specify the values of the two constraints, cDrag and cChg. These values are application specific. If there was to be a one-to-one correspondence between pixels in FreeArea and value with value ranging between (0,0) and FreeArea.size (less the icon size), then the following relationships would hold: cDrag: { value = min(max( value + M∆ - FreeArea.location, point(0,0)), FreeArea.size - Idle.size); } cChg: { location = value + FreeArea.location; } It should be noted that both a horizontal-slider indicator and a vertical-slider indicator are simple modifications of the draggable icon. In order to convert the draggable icon into a horizontal-slider indicator, one must make the following changes: 1. The type of value changes from Point to Number. 2. Two new attribute numbers are added: min and max, represent the extremes of slider values. For convenience an internal attribute, range, is added and constrained to be (max - min). 3. cDrag is rewritten to be dependent on the x-value of the mouse and the slider range. So cDrag becomes: value = min + range * (M.x - FreeArea.location.x) / FreeArea.size.x 4. The cChg constraint changes so that only the x-coordinate of the location is variable. 5. The FreeArea and ActiveArea are defined in relation to the slider boundary. (Figure 7.) Example Slider Regions
FreeArea ActiveArea
Figure 7 -- Example definition of FreeArea and ActiveArea for horizontal slider.
Copyright 1994, 1995 Carr et al.
10
05/16/95
3
THE UNIVERSITY OF MARYLAND WIDGET LIBRARY™
The following sections describe each widget in the University of Maryland Widget Library™. An IOG specification and an operational description is presented for each widget. 3.1 The Range-Selection Slider
Most existing sliders let the user set a single value. This makes it impossible to specify a range of values. One solution would be to use two sliders - one each for setting the lower and upper boundaries. This approach has a problem - the lower boundary can be erroneously set to a higher value than the upper boundary. The range-selection slider (Figure 8) prevents this. It uses two indicators that can be moved independently of each other, letting the user select a range by fixing both its lower and upper bounds [Becker et. al., 1989 & 1991]. Thus, the range-selection slider allows selection of a range of values in the same space as a conventional slider. Our rangeselection slider was first used in the HomeFinder [Williamson and Shneiderman, 1992].
Each indicator in the range-selection slider operates like a single, horizontal-slider indicator. The only difference is that the other indicator is the boundary of the motion on one side. An indicator is activated by the user pointing at it and pressing the mouse button. The indicator will then track the mouse as long as the mouse stays in the corresponding FreeArea. As long as the user doesn't leave the ActiveArea, the new value of the indicator will be set when the user releases the mouse button. If the user does leave the ActiveArea, then the indicator will return to the starting point when the user releases the mouse button (Figure 9). The dot-dash-dot line corresponds to FreeArea for the high indicator, and the dashed line corresponds to FreeArea for the low indicator. Unlike the regions for the horizontal slider, these regions are dynamic -moving one indicator alters the region for the other. A constraint maintains the FreeArea of the low indicator so that the indicator stops when its right-hand edge abuts the high indicator. Similarly, another constraint maintains the FreeArea of the high indicator so that it stops when its left-hand edge abuts the low indicator.
Figure 8 -- The range-selection slider
Copyright 1994, 1995 Carr et al.
11
05/16/95
Example Range Selecter Regions
low.FreeArea
high.FreeArea
ActiveArea
Figure 9 -- Sample definitions for FreeArea(s) and ActiveArea for the range-selection slider.
hSliderIndicator behavior
value
old_value
D
Mv && in[Idle]
TRUE
JumpCond
D
TRUE
D
selected
D
M^ tracking ~[ActiveIcon]
cDrag
D
D
cJumpUpdate
D
// cancel? M^
FALSE
[ActiveArea]~
∆Μ && in[FreeArea]
D
value D
D
old_value
D
cChg
location D
cJump
JumpArea
Figure 10 -- Adding "jump to value" behavior to a horizontal slider.
The range-selection slider also implements three, positioning short cuts. Clicking to the left of the low-range indicator and in the low FreeArea causes that indicator to jump to the indicated value. Clicking to the right of the high-range indicator and in the high FreeArea causes the high indicator to jump. Adding this jump behavior requires a slight modification to the horizontalslider widget already defined (Figure 10). For a single-indicator slider, the jump condition could be Mv && in[FreeArea] && !in[Idle]. However, the indicators in the range slider are more complex. The jump condition is modified to Mv && in[JumpArea] where JumpArea is a rectangular region dynamically constrained by cJump. For the low range indicator the rectangle is the area between the left indicator and its leftmost possible position, or: low.JumpArea.location.x = low.FreeArea.location.x (left limit of indicator travel.) low.JumpArea.location.y = low.FreeArea.location.y (copy the top.) low.JumpArea.size.y = low.FreeArea.size.y (copy the height.) low.JumpArea.size.x = low.location.x - FreeArea.location.x (set right edge to indicator.)
Copyright 1994, 1995 Carr et al.
12
05/16/95
The high JumpArea would be similarly constrained to be to the right of the high indicator. The cJumpUpdate constraint would be a function relating the location of the mouse press to the slider value. This function would be different for each slider and would be an inverse of the cChg constraint function. The final short cut applies to drag motions on the button between the two indicators (Figure 8). This causes both indicators to move while retaining the same relative range size. The region between the two indicators is defined by the high indicator FreeArea.location as an upper-left corner, a vertical size equal to that of the FreeArea, and a horizontal size equal to the difference between the x-location of the high indicator and its FreeArea.location.x. In the range slider this area is represented as a variably sized button. When specifying it, only the constraints on the widget are shown. A state-based system like IOGs is not particularly efficient for specifying arbitrary graphics. These are hidden in the view port abstraction. The cMidLoc and cMidSize constraints in Figure 11 dynamically control the button size and location. The dragging behavior itself is defined in the DragBoth meta-state. It specifies that the constraints, low.cDrag and high.cDrag, apply when the middle button is pressed. These constraints are the constraints for the slider indicators individually. The range-selection-slider specification shows how earlier IOGs can be used to build a definition for a new widget. The range selector is an example of a widget built from two copies of a previously defined one. Therefore, its IOG includes two copies of the modified hSliderIndicator IOG (Figure 10). The copies are not shown in full detail to reduce the clutter in the IOG diagram. Only those parts of the hSliderIndicator which are relevant to the new behavior are shown. (The notation low::hSliderIndicator indicates that this AND meta-state is of type hSliderIndicator and named low.) In order to adjust the control regions of each indicator, two new constraints must be introduced. These constraints, cOnlow and cOnhigh, are on the FreeArea regions. (These regions were not shown in the original specification as they did not affect behavior.) The cOnlow constraint would set the value of low.FreeArea.size.x so that the low indicator would stop when it abuts the high indicator. Similarly, cOnhigh stops the high indicator when the user drags it against the low indicator. In addition, a variably sized button, mBoth, is present in this specification. The detailed specification of mBoth is not given. It is of type ButtonViewPort and could be specified as a series of constraints on the rectangles and lines which are used to draw it. Two constraints are used to define it, cMidSize and cMidLoc. The constraint, cMidSize, sets the size of the button. It depends on both the location of the high indicator which is the button's rightmost edge and the FreeArea of the high indicator which is button's leftmost edge. The constraint, cMidloc, sets the button's location from the high indicator's FreeArea. (Note, since the FreeArea is constrained by the location of the low indicator, movements of the low indicator will change the button size and location.) Finally, there are four new data objects required for this specification. The data objects, lowval and highval, store the low and high end of the user-selected range. RangeMin and RangeMax store the minimum and maximum values for either lowval or highval.
Copyright 1994, 1995 Carr et al.
13
05/16/95
RangeSelector Background
100
900 mBoth::ButtonViewPort
cMidSize D
size
cMidSize
low::hSlideIndicator
cMidLoc
location
D
high::hSlideIndicator
D
behavior
behavior
cOnhigh D
cOnlow location
FreeArea
value
D
selected
low.selected
FreeArea
selected
value
high.selected D
DragBoth
cLowChg
D
D
cLowVal
lowval D
Mv && in[mBoth] low.cDrag D
DragBothCond
// drag
RangeMax
¬high.selected high.cDrag
M^
cHighChg
cHighVal D
// don't drag
¬low.selected D
location
D
highval
DragBothCond
D
D
RangeMin
DragBothCond = ∆Μ && in[mBoth] && (lowval > RangeMin) && (highval < RangeMax)
Figure 11 -- Specification of the range-selection slider.
3.2 The AlphaSlider
The AlphaSlider (Figure 12) is a descendant of the single-level alpha-slider designed by Osada, Liao, and Shneiderman [1993]. The idea is to provide rapid access to a single text item in a list. This item should be small, usually a line or two. The user slides the indicator, and the system displays a text item such as a hotel name and telephone number. The axis of the slider is calibrated from A-Z instead of numerically. Osada's original design works well as long as there are not more items in the list than pixels available in the slider. However with thousands of items, there are not enough pixels in the screen. The two-level AlphaSlider was designed to overcome this limitation. It provides a coarse and a fine level of selection. The coarse level provides a mapping of many items to one pixel. (e. g., for a 10,000-item list, a 300-pixel slider would provide a 33-to-1 mapping.) This lets the user rapidly select the approximate point in the slider. The fine level maps one mouse increment to one item. This lets the user select the exact item. The AlphaSlider was used in the FilmFinder [Ahlberg and Shneiderman, 1994a&b] to display the contents of five different lists of names in an area of 7 cm. by 12.5 cm. Copyright 1994, 1995 Carr et al.
14
05/16/95
Figure 12 -- The AlphaSlider
The AlphaSlider is operated in three different ways. First, the user may make a coarse selection by clicking in the slide area. This causes the slider indicator to jump to the location of the click. Second, the user may point at and drag in the upper half of the slider indicator. This causes the AlphaSlider to enter the coarse-adjustment mode. In coarse-adjustment mode, each pixel movement of the slider indicator causes the list to jump in proportion to the ratio between the length of the slider and the number of items in the list. The third method of operation is fine positioning. To activate fine positioning the user points to and drags the bottom half of the slider indicator. This causes the slider to change one list item for each pixel of mouse movement. The specification for the AlphaSlider begins with a refinement of the hSliderIndicator specified in Figure 10. This refinement adds two levels of granularity to the horizontal-slider indicator. We need two "active" icons to give the user feedback about which granularity is being used (Figure 13). To select each granularity we need two different activation regions to replace the region associated with the Idle icon in the draggable icon. These regions, FineArea and
Idle
Active - Fine
Active - Coarse
Figure 13 -- Example icons for a horizontal AlphaSlider.
Regions for 2-Level Alpha Slider Text Output Here CoarseArea A
Z
ActiveArea FineArea FreeArea = FineArea U CoarseArea
Figure 14 -- Example definition of regions for a horizontal AlphaSlider.
Copyright 1994, 1995 Carr et al.
15
05/16/95
CoarseArea, determine whether fine or coarse granularity is used (Figure 14). To complete the specification for the two levels of granularity, we need to modify how the slider behaves. We replace the single active state and the cDrag constraint with an XOR metastate and two constraints. By comparing Figure 6 with Figure 15, we can see that the single Active display state of the draggable icon has been replaced with an XOR meta-state. This metastate contains two display states, one for fine-grain adjustment and one for coarse-grain adjustment. The active state depends on where the mouse was pointing when the user pressed the mouse button. From each state there is a constraint (cCoarse or cFine) which specifies the relationship between mouse movement and the indicator's value. The meta state also contains a history state so that the indicator will return to the proper granularity from the "cancel?" state. The final step in specifying the AlphaSlider requires showing the display output. Figure 16 shows the IOG for this function. The value of the indicator is mapped into the value of the slider through the expression "psval[int(Indi.value)]". This expression assumes an array of strings, psval, which is the list of possible AlphaSlider values. The indicator value is converted to an index into this array, and that value is displayed in a text-output view port. 2Level_hSliderIndicator behavior:
value
old_value
D
Mv && in[Idle]
TRUE D
selected
Mv && in[FreeArea] && !in[Idle]
D
FALSE D
TRUE D
M^ D
active:
// cancel?
~[ActiveArea]
M^
cJumpUpdate
old_value D
[ActiveArea]~ ∆Μ &&
H
cCoarse D
in[ActiveCoarse] && in[FreeArea] D
in[CoarseArea] cFine D
in[FineArea]
∆Μ && in[ActiveFine] && in[FreeArea]
D
value D
cChg
location
Figure 15 -- Behavior of 2-level horizontal slider indicator.
Copyright 1994, 1995 Carr et al.
16
05/16/95
2Level_AlphaSlider 2Level_hSliderIndicator::Indi value
psval[int(Indi.value)] D
value::string D
selected
D
Figure 16 -- Specification of 2-level AlphaSlider.
3.3 The Treeview Widget
The treeview widget provides a node-link visualization of any tree structure. It was developed for use in configuring satellite networks [Kumar et al., 1994]. Treeviews have traditionally been used for a number of applications, for example: 1. Hierarchy Visualization Applications: Treeviews have been used to visualize hierarchical information such as geographical data, computer file systems, satellite communications networks and organizational structures. Various other tools such as Treemaps [Shneiderman, 1992] and Cone-Trees [Robertson et al., 1992] are also used. 2. Non-Hierarchy Visualization Applications: Treeviews are widely used in the areas of probability and set theory, reliability engineering and systems engineering. Event trees and fault trees are two examples. The treeview widget and the treemap widget make use of the same tree data structure. They may be thought of as two different view-port mappings of the same data. The design of the tree and treeview data structures was done in such a way as to be flexible, so that it could be extended depending on the specific application. For example, a tree can have multiple treeviews. The treeview widget takes a tree as input, generates the layout, and draws the treeview. Any arbitrary tree (m-ary tree) can be visualized. The treeview is laid out horizontally, and the user can choose the orientation (left-to-right or right-to-left). The treeview can be browsed in X and Y directions using the horizontal and vertical scroll bars, respectively (Figure 19). This widget has been used in the Tree-browser application (Figure 19). This application is a visualization tool for hierarchical data that makes use of dynamic queries [Williamson and Shneiderman, 1992] and pruning. The Tree-browser uses two coordinated or tightly-coupled treeviews of the same tree, one a detailed view and the other a miniature view or overview (Figure 18). The user can select attributes (both numerical and textual) for querying nodes at each level in the hierarchy. Nodes at higher levels in the hierarchy that do not match the query cause their subtrees to be pruned out of the visualization. Thus, one can reduce a huge data set (with thousands of nodes) to a much smaller set, from which a good selection can be made. The treeview widget operates as a standard window which scrolls the node-link representation of the tree. Thus, the specification (Figure 17) consists of a view port with two scroll bars. Since scroll bars are supplied by the window-system tool kit, they are represented by a "black box" in our specification system. (One can also build them from the horizontal slider already defined.) The view itself is visualized as a view port over a canvas which contains the entire tree already
Copyright 1994, 1995 Carr et al.
17
05/16/95
Treeview Widget Horizontal Scroll Bar Viewport
Value cHloc D
Vertical Scroll Bar
translate
cVloc D
Value
Figure 17 -- Treeview widget specification.
drawn. View ports have associated with them a mapping function which is controlled by a translation point (translate) and scale (magnification). Since the treeview uses a constant scale, translate is specified by two constraints, one from the horizontal scroll bar and one from the vertical scroll bar. The coordination between the two viewers may also be specified using IOGs. The left-hand treeview widget is the overview. The Viewbox in the overview is just a draggable icon. It is constrained to be located within the overview by assigning the FreeArea and ActiveArea inside of the overview. The values of the Viewbox use the same range as the scroll bars for the righthand treeview widget or detailed view. Finally, constraints are assigned between the Viewbox value and the detailed-view scroll bars (Figure 18). Note, the data arcs assigning these constraints have Boolean conditions which limit updating to the widgets not being manipulated. Coordination Viewbox
Detailed View Treeview Widget Horizontal Scroll Bar selected
cVHCoord D
Value selected
Value
cSHCoord D
!Viewbox.selected Vertical Scroll Bar cVHCoord D
Value
cSHCoord selected
D
!Viewbox.selected
Figure 18 -- Specification of treeview coordination in the Tree-browser application.
Copyright 1994, 1995 Carr et al.
18
05/16/95
Overview Detailed View
Viewbox
Figure 19 -- Two treeview widgets used in the Tree-browser application.
Copyright 1994, 1995 Carr et al.
19
05/16/95
3.4 The Treemap Widget
The treemap viewer uses a space-filling algorithm to reduce the display space required to view a hierarchy [Shneiderman 1992]. The treemap has been used to visualize file directories [Johnson and Shneiderman, 1991], budgets, stock portfolios [Jungmeister and Turo, 1992], satellite network links [Kumar et al., 1994], and other tree-structured hierarchies. Many applications handle vast amounts of data. It is often difficult to present this data to the user in a way that would give the user a good overview of the data and at the same time allow easy access to the details of the information. The Treemap is a data visualization tool developed for this purpose. Treemaps (Figure 20) are best suited for viewing hierarchical data, and when necessary, a hierarchy can be created for almost any kind of data. Instead of displaying a conventional tree structure where most of the display space remains unused (Figure 19), treemaps take the spacefilling approach of nested-circle diagrams and divide the parent node area among its child nodes (Figure 21). The area of a treemap is divided among the nodes corresponding to their weights, so a treemap displays more information than a conventional tree diagram. Therefore, treemaps display hierarchically-structured information in relatively small screen space. The basic attributes of a treemap are the tree, root node, selected node, child node offset, orientation in which the nodes are divided, number of levels displayed, node name display, size attribute, and color attribute. The size attribute values can be filtered, which is very useful if the variation in node sizes is small. The size attribute can also be inverted, so that nodes with small values appear large on the screen, and nodes with large values appear small. The color palette used for coloring the nodes can also be changed.
Figure 20 -- Screen snapshot of a treemap.
Copyright 1994, 1995 Carr et al.
20
05/16/95
Figure 21 -- a) Nested-circle diagram b) Corresponding treemap
A tree map is constructed by first selecting a display root node that can be any node in the tree. The root node covers the entire treemap display area. Changing the display root node is a good way to zoom into the hierarchy. The area of the display root node is divided between its children according to their size-attribute value. The division is done either horizontally or vertically depending on the orientation attribute. The direction of division is alternated on successive levels of the tree. If the treemap offset attribute is greater than zero, a border of offset pixels is left around the divided node area. The node name can be displayed in the upper-left corner of the node if needed. The deeper levels of the hierarchy can be left out to display higher levels more clearly. The selected node is highlighted with a (colored) wide border. The sizes of the nodes are determined by any numerical attribute of the nodes. The nodes with large values are displayed large. If there are lots of the nodes, the smallest ones do not necessarily get any screen space. If many nodes have approximately the same size, the size attribute can be filtered through a function to exaggerate the size differences making it easier to find the largest node. If the hierarchy contains a huge (uninteresting) node that covers most of the screen space, this node can be closed, and its area given to other nodes. The leaf nodes of the tree can be colored according to any numerical attribute they have. The number of colors and the color values in the palette can be selected by the programmer. The user can select any node on the treemap by clicking it with mouse button 1. The selected node is indicated by highlighted borders. If the user holds the mouse button down and moves the pointer around, the selection follows pointer movement. The user can zoom into the treemap by double clicking a node with mouse button 1. This causes the selected node to fill the entire treemap display space. The user can zoom out one level at a time by clicking mouse button 2. The parent node of the displayed root node becomes the new root for the treemap display thereby filling the entire area. In addition to the complex graphics, the treemap viewer presents an additional specification problem -- where is the line between the application and the interface? Clearly, the interface should handle events like pointing and clicking. But, what about closing nodes, zooming-in, zooming-out, and changing the attribute mapped to size? Each of these actions changes the treemap being viewed and is more properly part of the application. The specification presented here will assume that the application handles changes to the treemap and will concentrate on generating events which the application needs to change the view.
Copyright 1994, 1995 Carr et al.
21
05/16/95
TreemapNode NodeId D
Mv
~[TreemapNode]
M^ [TreemapNode]~ && Mdn NodeId
Figure 22 -- Specification of treemap node.
The treemap viewer consists of two component types: a treemap node and a treemap viewer. The node IOG would be created for each tree item by the application. For each node the application would also create an identifier. This identifier will be assumed to be an index into arrays for the three attributes of the treemap (Name, Size, and Color in the example in Figure 20). Now, whenever the user points to a node with the mouse button pressed, the node identifier is exported from the TreemapNode (Figure 22). The treemap itself (Figure 23) consists of a group of TreemapNodes, a currently selected node attribute, and displays for the Name, Size, and Color mappings. The group of nodes is depicted as the stack of meta-states on the left. They all are connected to CurrentNode which in turn connects to the displays. The CurrentNode-to-display connection is an index into a string array initialized by the application. The displays are of the standard, single-height, list display found in all window systems and have not been specified in order to save space. The zooming operations have been attached to the entire treemap. A double click (Mv^v^) generates the ZoomIn event. Similarly, clicking the second (right) mouse button generates the ZoomOut event. It is assumed that an implementation would attach these events to semantic functions in the application. TreeMap NodeId CurrentNode
D
TreemapNode Mv^v^
D
ZoomIn E
NameDisplay
M2v^
ZoomOut E
SizeDisplay
ColorDisplay
Figure 23 -- Specification of treemap viewer.
Copyright 1994, 1995 Carr et al.
22
05/16/95
3.5 Secure Toggle Switch
Most existing buttons in computer applications give no indication of the current state - novice users get confused as to whether the label on a button portrays its current state or is an indication of the action it performs. The lever toggle uses direct manipulation and visual feedback to perform the following functions: 1. Indicate the current state of the device in an unambiguous manner. 2. Make obvious how the user can change the state of the toggle. 3. Acknowledge the user’s actions by providing appropriate visual feedback. Additionally, a secure lever toggle (Figure 24) guards against an accidental change of state by requiring a deliberate user action. Physical secure-lever toggles find extensive use in heavy industry - for example in controls that should not be switched on or off by the accidental push of an operator, like aircraft autopilot/manual settings. In computer applications the secure toggle can be used in machinery simulators, such as an aircraft simulator, and in any application that requires a deliberate user action. They can also be used in computer-controlled machinery, for example the control panel of various home appliances such as air conditioners, security systems, ovens, etc. The "secure" switch is based on the designs by Plaisant and Wallace [1990 & 1992]. The switch requires that the operator point at its current state and drag the switch to its new state in order to operate it. This prevents inadvertently changing the switch position (and the controlled system). In order to turn the switch on, the operator would have to move the mouse to the "Off" region of the switch, press the mouse button, drag the mouse into an intermediate region, drag the mouse into the "On" region, and release the button. Releasing the mouse button in any region other than "On" will return the switch to the off state. Turning the switch off requires similar manipulation. Each step in the operation sequence corresponds to a similar state in the user interface. In order to specify the user interface, we need to define three regions (Figure 24) and five icons. The regions relate the mouse position to the corresponding side of the switch image. The icons provide feedback to the user about the switch value and about its operation. Figure 25 shows the specification and the icons.
On
Mid
Off
Figure 24 -- The secure switch (shown with specification regions).
Copyright 1994, 1995 Carr et al.
23
05/16/95
SecureSwitch Static States (switch==ON)
(switch==OFF)
in[On] Mv
in[Off] Mv M^ Operating States
~[Mid]
~[Mid]
~[On]
~[Off]
in[On] M^
in[Off] M^ D
ON
OFF
switch
D
D
Figure 25 -- Specification of a secure switch.
To get a better idea of how the specification is interpreted let's trace a user turning the switch on. At startup, Static States is entered at the start state. A test is made on the initial value of switch, and either the "on" image or the "off" image is displayed. In this case, assume the system starts with the value of switch as OFF. So, the IOG initially moves to the Static States - Off and displays the icon shown. The user now positions the mouse in the Off region and presses the mouse button. This satisfies the in[Off] Mv condition, and the IOG moves to Operating States - Off. This move causes the switch display to light up. Next, the user drags into the middle of the switch. This activates the ~[Mid] event and causes the transition to Operating States - Mid to be taken. Again the display changes when this occurs. The user continues and drags into the On region, the ~[On] event occurs, and the transition to Operating States - On occurs. At this point the user releases the mouse button. This enables two transitions: in[On] M^ on the data arc to switch and M^ from Operating States to Static States. By convention all data arcs are evaluated first. So, the value of switch changes to ON. Since the M^ transition is to the metastate and not to a contained state, Static States is restarted at its start state. The transition to Static States - On is taken, and the display updated to the "on" switch which is not lit up. If the user had moved the mouse out of the On region before releasing the mouse button, only the M^ transition would have been enabled. Thus, when Static States was restarted the switch would have been OFF, and the display would have returned to the off state.
Copyright 1994, 1995 Carr et al.
24
05/16/95
4
SUMMARY OF EXPERIENCES
In addition to the widgets described in this paper, IOGs have been used to specify a number of other widgets. 4.1 Implementing the Widgets
Specification of the widgets was part of an effort to improve and reimplement the widget library. We wanted to run the widgets on Unix, PC, and Macintosh platforms. In order to accomplish this we decided to use the Galaxy multi-platform, user-interface, development system from Visix and to use the Interaction Object Graphs as a paper-design tool. We found the specifications helpful in implementing the widgets. In the case of the secure switch, the programmer raced ahead before the specification was completed and programmed from a verbal description and a working prototype of the original toggle switch. The result was that the programmer misinterpreted the secure feature, and the switch changed states when the user entered the "On" or "Off" regions as long as the user had completed a sequence through the middle. (e.g. ~[On] Mv ~[Mid] ~[Off] would turn the switch off before the user released the mouse button.) Reprogramming from the specification produced correct behavior and reduced the size of the code. The specifications were also helpful in answering questions like, "What happens when the range-selection-slider indicators meet?" There were problems implementing from the specifications. Galaxy abstractions are not the same as the IOG abstractions - there was a certain amount of translation required. Translation of IOG components into 'C' is fairly straightforward. For instance, an arc is simply an "if CONDITION then ACTION" construct. A data object is simply a variable associated with the widget. Modeling the IOG-state hierarchy is more complicated, but with small specifications, modeling the XOR states through a function with a case statement and a state variable works well. Using this scheme, AND states are just a function which calls all of their component XOR states. With this model special handling is required for arcs from one meta-state to another. As with all manual translations, keeping the diagrams updated was a problem. As a method for communicating designs, we found that for widgets like the secure switch or the AlphaSlider, the IOG method gave clear visualizations of the widget behavior. On the other hand, more complex widgets such as the tree viewer and tree map viewers were very abstract and required careful reading to extract meaning. We found that specifying complex graphical relationships for these widgets was very awkward. In the end, we decided that we would use the view-port mechanism and code the graphics without an IOG specification. There was also a trade-off between the level of detail required for an operating widget and the level of detail required for a "readable" specification. Real widgets have lots of attributes which don't affect the runtime behavior of the widget. A complete specification requires their presence. However, they clutter the diagrams with data objects and make the diagrams harder to read. We settled on the convention that the diagrams would only show data objects involved in behavior. Hierarchically organizing the widget specification and reducing some details to a "black box" helped readability. Adding data arcs and data object nodes to IOGs help tremendously in visualizing the relationships between the data and widget behavior. The one-way constraints were useful for expressing relationships between attributes. This was so, even though the implementation system did not directly support constraints. However, one drawback of constraints is that they are Copyright 1994, 1995 Carr et al.
25
05/16/95
deceptively simple. The first constraint written usually results in sliders which can slide out of their borders and values which are outside the desired ranges. We found that many constraint equations needed to be guarded by minima and maxima. We also found that "good" specifications do not necessarily make "good" interaction. For instance, when specifying a draggable icon (Figure 6) one first tends to write the tracking condition as "∆M && in[ActiveIcon]". However, this condition causes problems on the border of the icon. If the user is on the left edge and moves the mouse left, the mouse immediately leave the region of the icon. This interrupts the tracking. In slower systems the mouse can move in jumps of several pixels, and this increases the width of the problem region. A more relaxed condition of "∆M && in[FreeArea]" fixes this. There were two other problems with condition specification to guard against. First, events should not be linked in conjunction. Our model of events is that only one may occur at a time, and so the conjunction of two events never occurs. The second problem is with specifying two control arcs into the same XOR meta-state from a single state. (Parent states of both the source and destination must be considered.) If these arcs do not have mutually exclusive conditions, an ambiguous specification results. We decided that this condition was an illegal IOG. 4.2 Interaction Object Graphs in Relation to Other Specification Methods
IOGs have proven superior to other specification methods that have been used to specify widgets. They have the following advantages: 1. More Compact. Specifying the behavior of the secure switch requires 9 control arcs, 6 states, and 2 meta-states with IOGs. A transition diagram takes 20 arcs and 9 states. As behaviors get more complex, transition diagrams become more complex faster than IOGs. Even the statechart specification for the secure switch is slightly more complex. Statecharts do not directly represent data, and this means that a statechart specification uses a history state and two extra arcs to specify returning the switch to the original setting. User Action Notation can be used to specify the secure switch as well. A direct comparison is difficult, but a secure switch specification with UAN takes about a full page as compared to the half page with an IOG. We have also found that the specification of handling for unexpected user behavior is difficult when using UAN. 2. Direct Representation of Data. While seemingly a small addition, the direct representation and modification of data greatly increases the specification power. Specifying a slider with either statecharts or transition diagrams is difficult. The tracking constraint must be handled outside of the specification system. UAN provides a single operator (>~) to represent tracking. However, this operator relates icon position to the mouse position and not to the value of the slider. Finally, UAN is unable to represent the effect of computer-initiated data change in the interface. Its user orientation limits its usefulness when specifying widgets that display computer feedback. 3. Visualization of Widget Behavior. None of the other specification methods give their readers an idea of how the widget will appear on the display. IOGs are unique in this respect.
Copyright 1994, 1995 Carr et al.
26
05/16/95
Since IOGs are superior for specifying widgets, we considered using them to specify the entire interface. For user interfaces, it seems to us that IOGs may be too detailed. At the user-interface level the designer-completed actions, such as changing a switch value, are more important than the details of how the switch operates. We see IOGs as a complement to existing user-interface specification systems. Bodart, et al. (1995) reached a similar conclusion in their study of specification techniques at four different levels of abstraction (inter-presentation unit, intrapresentation unit, intra-window, and intra-object). They found IOGs very convenient for intraobject dialog specification. For the other levels of abstraction, they found that while it was possible to use IOGs, modifying them to express the relationships of that level of abstraction worked better. 5
FUTURE RESEARCH
One feature that was sorely missed was being able to execute the specification directly. This would have saved considerable time. Also, testing the specifications directly would reveal errors and usability problems before committing to code. After the widgets were implemented, a C++ class library which implements the IOG abstraction was programmed with an interface into the Microsoft Windows system. With this class library, a programmer who had not taken part in the original project was able to implement operating widgets from IOG diagrams in less than a day. Extending this library to a system which allowed the designer to draw the widget IOG and then directly execute it would be a valuable tool for prototyping. Another area which shows promise for future work is algorithms to detect common errors. While we feel it would be impossible to prove a widget error free, some common errors should be detectable. For example, many widgets have a direct mapping between a display state (display node in IOGs) and the value of a widget attribute. At least for those states which represent the widget when the user is not manipulating it, it would be desirable to verify that the attribute value could be guaranteed. Verifying the attribute value is closely related to the usability concept of visibility of underlying system state. Forgetting a data arc is the most common cause for this error. Other properties to check could include freedom from "sink states" and "dialog completion". A sink state is one which, once entered, cannot be left and is a violation of the reversibility principal of direct manipulation interfaces. Dialog completion would insure that the widget returned to "non-operating" states when the user stopped manipulating it. "Nonoperating" states represent the widget when the user is not manipulating it. For example, in the secure switch, releasing the mouse button should result in the widget entering one of the display states in the top group (Figure 25). Any other state would be an error and might give the user incorrect feedback. (e.g., displaying the switch in the on-active position when it was off and not being operated, might cause the user to conclude the switch was on.) 6
ACKNOWLEDGMENTS
We would like to acknowledge the advice of Richard Chimera, Ben Shneiderman, Catherine Plaisant, and the other HCIL members for both widget design and help in preparing this paper. Sylvia Sheppard and Chris Rouff of NASA Goddard Space Flight Center provided
Copyright 1994, 1995 Carr et al.
27
05/16/95
encouragement and support. Finally, we would like to thank Carl Rollo for tirelessly proofreading the drafts of this paper. 7
REFERENCES
Ahlberg, C. and Shneiderman, B. 1994a. The Alphaslider: a compact and rapid selector. Proceedings of the ACM CHI'94 Conference on Human Factors in Computing Systems, pp. 365-371. Ahlberg, C. and Shneiderman, B. 1994b. Visual information seeking: tight coupling of dynamic query filters with starfield displays. Proceedings of the ACM CHI'94 Conference on Human Factors in Computing Systems, pp. 313-317, 479, & 480. Becker, R., Eick, S., Miller, E., and Wilks, A., 1989. Dynamic graphical analysis of network data. in ISI Conference Proceedings, Paris, France. Becker, R., Eick, S., and Wilks, A. 1991. Basics of network visualization. IEEE Computer Graphics and Applications, Vol 11(3), pp. 12-14. Bodart, F., Hennebert, A.-M., LeHeureux, J.-M., Provot, I., and Vanderdonckt, J. 1995. Reaching a high-level dialogue specification from task analysis. to appear in Abridged Proceedings of 6th International Conference on Human-Computer Interaction HCI International '95, Yokohama, July 9-14, 1995, Elsevier Science Publishers, Amsterdam. Carr, D. 1994. Specification of interface interaction objects. Proceedings of the ACM CHI'94 Conference on Human Factors in Computing Systems, pp. 372-378. Gieskens, D. and Foley, J. 1992. Controlling user interface objects through pre- and postconditions. Proceedings of the ACM CHI'92 Conference on Human Factors in Computing Systems, pp. 189-194. Guttag, J. and Horning, J. J. 1980. Formal specification as a design tool. Proceedings of the Seventh ACM Symposium on Principles of Programming Languages, pp. 251-261. Hartson, H. R., Siochi, A. C., and Hix, D. 1990. The UAN: a user-oriented representation for direct manipulation interface designs. ACM Transactions on Information Systems, Vol. 8, No. 3, (July), pp. 181-203. Hartson, H. R. and Gray, P. D. 1992. Temporal aspects of tasks in the user action notation. Human-Computer Interaction, Volume 7, Lawrence Erlbaum Associates, Inc. pp. 1-45. Harel, D. 1987 Statecharts: a visual formalism for complex systems. Science of Computer Programming, vol. 8, pp.231-274. Harel, D. 1988. On visual formalisms. Communications of the ACM, 31(5), (May), pp. 514-530. Hill, R. D. 1986. Supporting concurrency, communication, and synchronization in humancomputer interaction - the Sassafras UIMS. ACM Transactions on Graphics, Vol. 5, No. 3, (July), pp. 179-210. Hudson, S. E. 1989. Graphical specification of flexible user interface displays. Proceedings of the ACM SIGGRAPH Symposium on User Interface Software and Technology, pp. 105-114. Jacob, R. J. K. 1986. A specification language for direct-manipulation user interfaces. ACM Transactions on Graphics, vol. 5, no. 4, (October), pp. 283-317. Johnson, B. and Shneiderman, B. 1991. Tree maps: a space-filling approach to the visualization of hierarchical information structures. Proceedings of the 2nd International IEEE Visualization Conference, San Diego, (Oct.), pp. 284-291.
Copyright 1994, 1995 Carr et al.
28
05/16/95
Jungmeister, W.-A. and Turo, D. 1992. Adapting treemaps to stock portfolio visualization, University of Maryland, Center for Automation Research technical report CAR-TR-648 (also CS-TR-2996, SRC-TR-92-120). Kumar, H. P., Plaisant, C., Teittinen, M., and Shneiderman, B. 1994. Visual information management for network configuration, University of Maryland, Institute for Systems Research technical report, ISR-TR-94-45 (also CAR-TR-716, CS-TR-3288). Myers, B. A. 1988. Creating User Interfaces by Demonstration, Academic Press, Boston. Olsen, D. R. Jr., 1990. Propositional production systems for dialog description. Proceedings of the ACM CHI'90 Conference on Human Factors in Computing Systems, pp. 57-63. Olsen, D. R. Jr. 1992. User Interface Management Systems: Models and Algorithms, Morgan Kaufmann Publisher, San Mateo, California. Osada, M., Liao, H., and Shneiderman, B. 1993. Alphaslider: development and evaluation of text retrieval methods using sliders, Ninth Symposium on Human Interface, Kobe, Japan, Oct. 18-20, 1993, pp. 91-94, (also University of Maryland, Center for Automation Research technical report CAR-TR-673). Plaisant, C. and Wallace D. 1990. Touchscreen toggle switches: push or slide? design issues and usability study, University of Maryland, Center for Automation Research technical report CAR-TR-521 (also CS-TR-2557). Plaisant, C. and Wallace D. 1992. Touchscreen toggle design. Proceedings of the ACM CHI'92 Conference on Human Factors in Computing Systems, pp. 667-668 and the CHI'92 Formal Video Program. Robertson, G. G., Mackinlay, J. D., and Card, S. K. 1991. Cone trees: animated 3d visualizations of hierarchical information. Proceedings of the ACM CHI'91 Conference on Human Factors in Computing Systems, pp. 189-194. Rouff, C., Specification and Rapid Prototyping of User Interfaces, University of Southern California Ph.D., 1991, 219 pages. Rouff, C. and Horowitz, E. 1991. A system for specifying and rapidly prototyping user interfaces. in Taking Software Design Seriously, J. Karat, editor, Academic Press, 1991, pp. 257-272. Shneiderman, B. 1982. Multiparty grammars and related features for defining interactive systems. IEEE Transactions on Systems, Man, and Cybernetics, 12(2):148-154, (March/April). Shneiderman, B. 1992. Tree visualization with tree maps: a 2-d space-filling approach. ACM Transactions on Graphics, Vol. 11, No. 1, (January), pp. 92-99. Singh, G., Kok, C. H., and Ngan, T. Y. 1990. Druid: a system for demonstrational rapid user interface development. Proceedings of the ACM SIGGRAPH Symposium on User Interface Software and Technology, pp. 167-177. Siochi, A. C., and Hartson, H. R. 1989. Task oriented representation of asynchronous user interfaces. Proceedings of the ACM CHI'89 Conference on Human Factors in Computing Systems, pp. 183-188. Vander Zanden, B. T. 1989. Constraint grammars -- a new model for specifying graphical applications. Proceedings of the ACM CHI'89 Conference on Human Factors in Computing Systems, pp. 325-330. Visix Software Inc. 1994. Galaxy Application Environment Version 2.0.
Copyright 1994, 1995 Carr et al.
29
05/16/95
Wasserman, A. I. 1985. Extending state transition diagrams for the specification of humancomputer interaction. IEEE Transactions on Software Engineering, vol. SE-11(8), (August), pp. 699-713. Wellner, P. D. 1989. Statemaster: a UIMS based on statecharts for prototyping and target implementation notation for specification. Proceedings of ACM CHI'89 Conference on Human Factors in Computing Systems, pp. 177-182. Williamson, C. and Shneiderman, B. 1992. The dynamic HomeFinder: evaluating dynamic queries in a real-estate information exploration system. Proceedings of the 1992 ACM SIGIR Conference, Copenhagen, pp. 338-346.
Copyright 1994, 1995 Carr et al.
30
05/16/95