Apr 24, 2012 ... Vadilal Industries Limited (Vadilal) was incorporated in 1982 in Gujarat. ...
Through franchisee network, Vadilal has set up “Happinezz” retail.
GICS Industry : Food Products | Sub Industry : Packaged Foods & Meats | Website : www.vadilalgroup.com Report Date: 24 Apr 2012
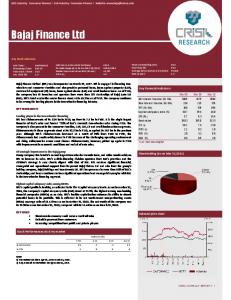
Vadilal Industries Ltd Key Stock Indicators NSE Ticker : Bloomberg Ticker : Face value per share : Div.Yield (%):
VADILALIND VDI:IN 10.0 1.2
CMP as on 23 Apr 2012‐Rs/share : 52 week range up to 23 Apr 2012 (Rs)(H/L) : Market Cap as on 23 Apr 2012 (Rs mn) : Enterprise Value as on 23 Apr 2012 (Rs mn) :
126.0 185.1/90.2 905 2,306
Shares outstanding (mn) : Free Float (%) : Average daily volumes (12 months) : Beta (2 year) :
Vadilal Industries Limited (Vadilal) was incorporated in 1982 in Gujarat. Part of the Vadilal group, the company is engaged in manufacturing and selling ice cream and frozen desserts. The company diversified into processed foods in 1991; it also provides forex advisory services.
KEY HIGHLIGHTS Established brand name in Indian ice cream market The company has an established distribution network and cold storage capacities. Vadilal operates through a wide network of 26 clearing and forwarding agents, 350 distributors, and ~25,000 retailers. The company claims to offer the largest range of ice creams in the country with over 150 flavours in more than 250 packs and forms. Through franchisee network, Vadilal has set up “Happinezz” retail outlets for selling ice creams. The company has 75 parlours in Gujarat and over 225 parlours in India. Launches ready‐to‐eat frozen snacks in India The company in FY11 launched ready‐to‐eat snack items such as plain and stuffed parathas, samosas a n d kachoris. These frozen foods were earlier being exported to the US a n d Europe. The company’s frozen foods have a presence in Gujarat, Maharashtra and Rajasthan; Vadilal plans to expand its reach to Delhi and Bengaluru. Expanding market of its new mango pulp brand Vadilal has launched its mango pulp brand “Garden Fresh Kerino Ras” in the Mumbai and Rajasthan markets. The company has various brands under mango pulp including “Alphanso Mango Pulp” and “Kesar Mango Pulp” across India. The company exports frozen mango pulp and mango milk shake to the US, Canada, Australia, New Zealand, the UK, Germany, Netherlands Saudi Arabia, Kuwait, Oman, Dubai and other countries.
7.2 38.2 8,237 1.1
Key Financial Indicators
Revenue (Rs mn) EBITDA margins (%) PAT (Rs mn) PAT margins (%) Gearing (x) EPS (Rs/share) PE (x) P/BV (x) RoCE (%) RoE (%) EV/EBITDA (x)
MAR‐09
MAR‐10
MAR‐11
1,555.5 9.0 11.1 0.7 1.9 1.5 20.8 0.7 10.5 3.2 6.2
1,918.7 10.4 55.2 2.9 2.4 7.7 10.2 1.5 13.5 15.3 7.3
2,361.6 10.6 50.8 2.2 3.4 7.1 21.3 2.6 11.9 12.7 9.9
n.m. : Not meaningful
Shareholding (As on March 31, 2012)
KEY RISKS l l l
Pricing pressure due to intense competition in the ice cream market Volatility in raw material prices Strengthening of the rupee will affect export realisations
Stock Performances vis‐Ã ‐vis market
VADILALIND NIFTY
Indexed price chart
YTD
Returns 1‐m
‐14 ‐11
0 ‐1
EPS:
3‐m
12‐m
8 3
‐13 ‐11
Note: 1) YTD returns are since Apr 1, 2011 to Apr 23, 2012. 2) 1m, 3m and 12m returns are up to Apr 23, 2012
Growth Trends
NET SALES:
PAT:
Indicates CAGR for 3 years is greater than 10% Indicates CAGR for 3 years is between ‐10% to 10% Indicates CAGR for 3 years is less than ‐10%
CRISIL COMPANY REPORT |1
Vadilal Industries Ltd BACKGROUND Vadilal was incorporated as Vadilal Oxygen Pvt Ltd in 1982, and was in the business of purification and refilling of oxygen gas. Vadilal Ice‐cream Pvt Ltd, which was incorporated in 1981, was amalgamated with Vadilal Oxygen in 1985. Consequently, the name of the company was changed to Vadilal Industries Ltd. The company manufactures and markets ice cream under the “Vadilal” brand. Vadilal’s primary business is manufacturing ice cream and frozen desserts. The company also exports processed food products such as frozen fruits and vegetables, canned fruit pulp and ready‐to serve products. Its processed foods are marketed under the "Quick Treat" brand. The company exports nearly 60 products to the US, Canada, the UK, Kuwait, the UAE, Singapore, New Zealand and Australia. The company has a forex division dealing in current account‐related transactions and money changing business such as buying and selling traveller's cheques and currency notes. Vadilal has three ice cream manufacturing plants — at Pundhra and Dudheshwar in Gujarat and Bareilly in Uttar Pradesh, having total installed capacity of 106,080 kilolitres per annum. The processed foods plant is located at Dharampur in Gujarat and has an installed capacity of 32,500 mn tonnes per annum. Vadilal Enterprises Ltd serves as the marketing and sales arm for ice creams and processed foods manufactured by the company in India. In FY10, the company incorporated a wholly‐owned subsidiary company Vadilal Industries (USA) Inc, in the US.
COMPETITIVE POSITION Peer Comparison
Revenue (Rs mn) EBITDA margins (%) PAT (Rs mn) PAT margins (%) Gearing (x) EPS (Rs/share) PE (x) P/BV (x) RoCE (%) RoE (%) EV/EBITDA (x)
Vadilal Britannia Heritage Foods Industries Ltd Industries Ltd (India) Ltd. Mar‐11 Mar‐11 Mar‐11 2,361.6 46,116.2 10,818.9 10.6 5.3 3.8 50.8 1,342.8 10.0 2.2 2.9 0.1 3.4 3.0 2.2 7.1 11.2 0.9 21.3 33.1 202.4 2.5 18.9 2.4 11.9 24.3 16.9 12.7 63.8 2.4 9.9 20.7 8.7
n.m: Not meaningful
Key Financial Indicators FINANCIAL PROFILE Volumes drive top line, however PAT shrink in FY11
Top line grew ~23% year‐on‐year to Rs 2.36 bn in FY11 from Rs 1.91 bn in FY10, as volumes rose 11% in the ice cream segment. Production of frozen desserts jumped following the increase in number of deep freeze machines to 1,815 from from 418 during FY11.
EBITDA margin increased to 10.6% in FY11 from 10.4% over FY10, owing to decrease in material cost and employee cost as a percentage of total revenue.
PAT declined to Rs 50.8 mn in FY11 from Rs 55.2 mn over FY10, mainly due to increase in interest and depreciation charges and higher provision for deferred tax.
Revenue EBITDA margins PAT PAT margins Revenue growth EBITDA growth PAT growth Gearing RoCE RoE
Units Rs million Per cent Rs million Per cent Per cent Per cent Per cent Times Per cent Per cent
Mar‐09 1,555.5 9.0 11.1 0.7 14.8 4.5 ‐71.7 1.9 10.5 3.2
Mar‐10 1,918.7 10.4 55.2 2.9 23.4 42.7 399.6 2.4 13.5 15.3
Mar‐11 2,361.6 10.6 50.8 2.2 23.1 24.9 ‐8.0 3.4 11.9 12.7
INDUSTRY PROFILE Branded Foods The branded foods industry includes units manufacturing bakery products, dairy and milk products, confectioneries and ready‐to‐eat products. While India ranks among the largest food producers in the world, its share in the processed food industry is miniscule. Demand growth in the branded foods industry depends on the ability of manufacturers to offer a wide range of products that meet regional tastes at competitive prices. The introduction of innovative products to suit local tastes is expected to change consumer preferences and drive volume growth. Increase in volumes, especially in urban areas, will depend primarily on the growth in income levels and the number of working women. Government policies do not have a large bearing on the branded foods industry. In the Union Budget 2011‐12, a 1% duty was imposed on 130 articles which were earlier duty free. Many of them were in the branded foods segment. The industry was accorded priority status for bank lending in 1999. Players cater to various segments, with some being leaders in those segments. However, they face some competition from regional brands. Imported food products are costlier than local equivalents and are, therefore, not competitive in the domestic market.
CRISIL COMPANY REPORT |2
Vadilal Industries Ltd ANNUAL RESULTS
Income statement
Balance Sheet
(Rs million)
Mar‐09
Mar‐10
Net Sales
1,533.0
1,898.3
2,338.7
Operating Income
1,555.5
1,918.7
2,361.6
EBITDA
140.2
200.0
249.8
9.0
10.4
10.6
EBITDA Margin
(Rs million)
Mar‐11
Depreciation
48.8
57.1
79.9
Interest
82.3
75.9
118.5
Mar‐09
Mar‐10
Equity share capital
71.9
71.9
71.9
Reserves and surplus
268.9
307.7
349.8
Tangible net worth
340.7
379.6
421.7
57.8
54.9
78.3
Long‐term debt
244.7
389.1
632.0
Short‐term‐debt
414.5
523.1
782.0
Total debt
659.2
912.3
1,414.0
Current liabilities
280.9
482.3
380.6
Deferred tax liablity:|asset|
Total provisions Total liabilities
Mar‐11
24.7
45.3
24.6
1,363.3
1,874.4
2,319.2
Other Income
10.9
21.8
26.1
Gross block
954.4
999.8
1,479.8
PBT
22.6
86.1
75.6
Net fixed assets
548.0
829.1
1,208.1
50.8
Investments
19.1
0.7
22.0
Current assets
796.2
1,044.5
1,089.1
2.2
Receivables
296.4
327.6
349.5
7.2
Inventories
370.0
559.8
558.9
16.5
26.6
7.7
1,363.3
1,874.3
2,319.2
PAT
11.1
PAT Margin
55.2
0.7
No.of shares(Mn No.)
2.9
7.2
7.2
Cash Earning per share(EPS)
1.5
7.7
7.1
Cash flow
Total assets
(Rs million) Pre‐tax Profit Total tax paid
Mar‐09
Mar‐10
Mar‐11
Mar‐09
Mar‐10
Mar‐11
20.0
88.8
77.5
Revenue growth(%)
14.8
23.4
23.1
‐1.4
EBITDA growth(%)
4.5
42.7
24.9
PAT growth(%)
‐71.7
399.6
‐8.0
9.0
10.4
10.6
19.3
39.2
1.8
0.7
2.9
2.2
Dividend payout(%)
78.0
19.5
21.2
Dividend per share(Rs) BV(Rs)
1.2 47.4
1.5 52.8
1.5 58.7
Return on Equity(%) Return on Capital employed(%)
3.2 10.5
15.3 13.5
12.7 11.9
Gearing(x) Interest coverage(x)
1.9 1.7
2.4 2.6
3.4 2.1
‐4.4
‐33.7
Depreciation
48.8
57.1
79.9
Change in working capital
‐87.1
‐16.3
‐185.9
Cash flow from operating activities
‐22.7
95.9
‐29.9
Capital expenditure Investments and others Cash flow from investing activities
Ratios
‐80.5
‐338.1
‐458.9
0.0
18.4
‐21.3 ‐480.2
EBITDA margins(%) Tax Rate(%) PAT margins(%)
‐80.5
‐319.7
0.0
0.0
0.0
Debt raised/(repaid)
112.4
253.0
501.7
Dividend (incl. tax)
‐10.1
‐12.6
‐12.5
2.4
‐6.6
1.9
104.7
233.8
491.1
Debt/EBITDA(x)
4.7
4.6
5.7
1.5
10.0
‐19.0
Opening cash
15.0
16.5
26.6
Asset turnover(x) Current ratio(x)
1.7 1.1
2.0 1.0
1.9 0.9
Closing cash
16.5
26.6
7.7
Gross current assets(days)
185
196
153
Equity raised/(repaid)
Others (incl extraordinaries) Cash flow from financing activities Change in cash position
n.m.: Not meaningful
QUARTERLY RESULTS Profit and loss account
(Rs million) No of Months Revenue EBITDA Interest Depreciation PBT PAT
Dec‐11 3 511.8 21.5 39.8 29.9 ‐48.2 ‐33.0
% of Rev 100.0 4.2 7.8 5.8 ‐9.4 ‐6.5
Dec‐10 3 429.5 ‐0.1 21.3 20.7 ‐42.1 ‐28.8
% of Rev 100.0 0 5 4.8 ‐9.8 ‐6.7
Sep‐11 3 636.1 79.7 40.6 27.8 11.3 7.6
% of Rev 100.0 12.5 6.4 4.4 1.8 1.2
Dec‐11 9 2,220.6 289.3 117.0 81.0 91.3 61.2
% of Rev 100.0 13 5.3 3.6 4.1 2.8
Dec‐10 9 1,873.7 221.4 61.5 55.5 104.4 69.1
% of Rev 100.0 11.8 3.3 3 5.6 3.7
CRISIL COMPANY REPORT |3
Vadilal Industries Ltd
FOCUS CHARTS AND TABLES
Shareholding pattern (Per cent)
Directors Name
Designation
Virendra R. Gandhi
Managing Director
7.0
Ramchandra R. Gandhi
Chairman
0.1
0.1
Rajesh R. Gandhi
Managing Director
31.1
26.5
Devanshu L. Gandhi
Managing Director
Jun 2011
Sep 2011
Dec 2011
Mar 2012
61.9
61.8
61.8
66.4
Fll
7.0
7.0
7.0
Dll
0.1
0.1
31.0
31.1
Promoters
Others
Board of Directors
Additional Disclosure This report has been sponsored by NSE ‐ Investor Protection Fund Trust (NSEIPFT). Disclaimer This report is based on data publicly available or from sources considered reliable. CRISIL Ltd. (CRISIL) does not represent that it is accurate or complete and hence, it should not be relied upon as such. The data / report is subject to change without any prior notice. Opinions expressed herein are our current opinions as on the date of this report. Nothing in this report constitutes investment, legal, accounting or tax advice or any solicitation, whatsoever. The subscriber / user assume the entire risk of any use made of this data / report. CRISIL especially states that, it has no financial liability whatsoever, to the subscribers / users of this report. This report is for the personal information only of the authorised recipient in India only. This report should not be reproduced or redistributed or communicated directly or indirectly in any form to any other person ‐ especially outside India or published or copied in whole or in part, for any purpose. CRISIL is not responsible for any errors and especially states that it has no financial liability whatsoever to the subscribers / users / transmitters / distributors of this report. For information please contact 'Client Servicing' at +91‐22‐33423561, or via e‐mail:
[email protected].
CRISIL COMPANY REPORT |4