software solution for three-dimensional (3D) image fusion of SPECT-MPI and ... 0.0001) and very good for the 3D distance between the two landmarks (r=0.94 ...
Eur J Nucl Med Mol Imaging (2007) 34:1097–1106 DOI 10.1007/s00259-006-0342-9
ORIGINAL ARTICLE
Validation of a new cardiac image fusion software for three-dimensional integration of myocardial perfusion SPECT and stand-alone 64-slice CT angiography Oliver Gaemperli & Tiziano Schepis & Victor Kalff & Mehdi Namdar & Ines Valenta & Laurent Stefani & Lotus Desbiolles & Sebastian Leschka & Lars Husmann & Hatem Alkadhi & Philipp A. Kaufmann
Received: 3 July 2006 / Accepted: 17 November 2006 / Published online: 24 January 2007 # Springer-Verlag 2007
V. Kalff Department of Nuclear Medicine, Alfred Hospital, Melbourne, Australia
patients with a single perfusion defect and a single significant coronary artery stenosis (≥50% diameter stenosis). 3D fused SPECT/CT images were analysed by two independent observers with regard to superposition of the stenosed vessel onto the myocardial perfusion defect. Interobserver variability was assessed by recording the X, Y, Z coordinates for the origin of the stenosed coronary artery and the centre of the perfusion defect and measuring the distance between the two landmarks. Results SPECT-MPI revealed a fixed defect in seven patients, a reversible defect in five patients and a mixed defect in three patients and CTA documented a significant stenosis in the respective subtending coronary artery. 3D fused SPECT/CT images showed a match of coronary lesion and perfusion defect in each patient and the fusion process took less than 15 min. Interobserver variability was excellent for landmark detection (r=1.00 and r=0.99, p< 0.0001) and very good for the 3D distance between the two landmarks (r=0.94, p65 beats per minute were pretreated intravenously with 5–10 mg of metoprolol tartrate (Lopresor, Sankyo Pharma AG, Switzerland) directly before the scan. For optimal heart phase selection, retrospective ECG gating was used. Retrospective reconstruction of the image data was performed for acquisition of phase images starting from early systole (5% of the R-R interval) and ending at late diastole (95% of the R-R interval) using 10% increments. All images were reconstructed with an effective slice thickness of 0.625 mm at an increment of 0.625 mm. Reconstructed image data were transferred to a remote workstation (Advantage Workstation 4.3, GE Healthcare). The CTA data sets were analysed using axial source images, multiplanar reformations (MPR) and thin-slab maximum intensity projections (MIP). Image quality was determined for each segment and for the whole image set and was graded as excellent (no motion artefacts present), good (minor motion artefacts present), moderate (substantial motion artefacts present, but luminal assessment of significant stenoses still possible), heavily calcified (vessel lumen obscured by calcifications) or blurred (only contrast visualization inside the vessel possible). The coronary arteries were evaluated according to a 15-segment model proposed by the American Heart Association [19]. Segments with heavy calcifications or severe motion artefacts were excluded as they were not amenable to reliable luminal interpretation. Coronary lesions were visually assessed with regard to vessel delineation, and a diameter stenosis ≥50% was considered significant. Image fusion Integration of SPECT perfusion findings with CTA images was performed on a designated workstation (Advantage Workstation 4.3, GE Healthcare) using the CardIQ Fusion software package (GE Healthcare). This software allows the overlay of functional information over the CT anatomy of a patient’s heart. It includes several tools and protocols for optimized image fusion that are described in detail below. Image coregistration The Fusion QC protocol is the first step of the fusion workflow. It allows the user to align the images on axial,
1099
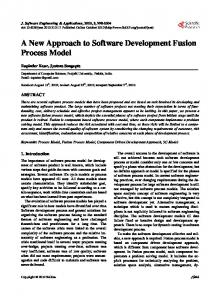
sagittal and coronal image planes in order to obtain a better matching of structural and functional information (Fig. 1a). The protocol further includes automatic orientation of both anatomical and functional data sets using the standard cardiac orientations [20]. In addition to translational alignment, this protocol allows for manual correction of the left ventricular (LV) rotation along its long axis (Fig. 1a) using the transition of right to left ventricle as a hinge point (arrow in Fig. 1a). Definition of left ventricular epicardium The LV Epicardium QC protocol displays a view containing the segmented CT LV epicardium using conventional volume-rendering technique [21], allowing addition or removal of structures from the LV epicardium if needed (Fig. 1b). The aim of this protocol is to visually check the segmentation of the epicardium from CT and the accuracy of the registration and of the mapping of the perfusion information. Every voxel of the volume has an opacity value and a colour. The opacity ramp is based on the Hounsfield units of the CT data. The colour of the surface is generated based on the perfusion information. In each point of the surface of the volume-rendered image the colour is computed as being the maximum perfusion intensity on a ray going from the particular point to the centre of the heart on CT, as illustrated in Fig. 1b. The window presets for the colour scale were adopted from the corresponding separate SPECT images and remained unchanged during the fusion process. Coronary tree segmentation The coronary artery segmentation is performed using the last protocol of the fusion software, the Hybrid Display protocol. This protocol allows one to grow the coronary arteries from the ascending aorta using automatic vessel tracking or manual segmentation. The algorithms used for adding or removing coronary arteries are based on morphological techniques for segmentation, using the density value of the pixels and local shape parameters (tube likeliness for vessels). The protocol further extracts the ascending aorta and the coronary arteries from its surrounding tissue, allowing them to be viewed in isolation using a 3D volume-rendered coronary tree (Fig. 1c). 3D volume-rendered fusion images As the final step, the Hybrid Display protocol displays a volume rendering containing the LV epicardial volume segmented in the LV Epicardium QC protocol, the volumerendered coronary tree obtained with the Hybrid Display protocol, and the left and right heart chambers acquired by
1100
Eur J Nucl Med Mol Imaging (2007) 34:1097–1106
Fig. 1 Illustration of the main protocols in the CardIQ Fusion software (a–d). The main protocols include tools for image coregistration, epicardial contour detection, coronary artery segmentation and are discussed in detail in the text
an automatic segmentation algorithm (Fig. 1d). Implementation of a cardiac transparency tool enables the user to render any of these structures transparent, for example the right ventricle, allowing for better visualization of the septal wall as shown in Fig. 1d. The Hybrid Display protocol includes a 3D toolbox for display of the 3D images in multiple projections, including anterior, posterior, left anterior oblique, right anterior oblique, left posterior oblique, right posterior oblique, left lateral, right lateral and apical.
Coronary angiography In patients referred for conventional CA, the angiographic results were used for comparison with CTA findings. Invasive coronary angiograms were visually evaluated by a single observer using the same 15-segment model as was implemented in the CTA analysis [19]. Stenosis severity was visually assessed according to the maximal luminal
diameter stenosis present in each segment. A stenosis ≥50% was considered a significant coronary lesion. Data interpretation and statistical analysis All fused 3D SPECT/CT images were processed and analysed by two independent experienced nuclear cardiologists with regard to the relation of the perfusion defect and the corresponding coronary artery stenosis. The relation of perfusion defect and coronary artery stenosis was classified as match or mismatch. Superposition of the stenosed vessel onto the myocardial perfusion defect was considered a match. Because of a paucity of distinct anatomical landmarks, measurement of interobserver variability in image coregistration is difficult if this is done by comparing the differences in overlap of the contrast and scintigraphic left ventricular outlines. Thus the coronary artery tree was substituted for the contrast left ventricular study. Reproducibility of image coregistration was then assessed by
Eur J Nucl Med Mol Imaging (2007) 34:1097–1106
1101
measuring the X, Y, Z components of the origin of the stenosed coronary artery and of the centre of the perfusion defect on the fused images. The X, Y, Z values were obtained by positioning the cursor over each landmark and recording the spatial coordinates of a 3D grid inherent in the CT data set (X-axis = laterolateral axis, Y-axis = dorsoventral axis, Z-axis = craniocaudal axis) using the CardIQ Fusion software. The coordinates of the first landmark (origin of the stenosed vessel) were recorded on axial slices, and for the coordinates of the second landmark (centre of the perfusion defect) the cursor was positioned on the epicardial surface of the volume rendering and its position confirmed on the axial slices. Furthermore, the distance between the two landmarks was calculated from the corresponding X, Y, Z components. Statistical analysis was performed using the SPSS software (version 12.0.1 for windows, SPSS Inc., Chicago, IL). All numerical values are given as mean±SD. Linear regression analysis and Bland-Altman limits of agreement were applied to assess reproducibility. The reproducibility coefficient was calculated as 1.96 times the SD of the differences as proposed by Bland and Altman [22]. p values