Methods Report
Validation of the CDC-RTI Diabetes Cost-Effectiveness Model Thomas J. Hoerger, Joel E. Segel, Ping Zhang, and Stephen W. Sorensen
September 2009
RTI Press
About the Authors Thomas J. Hoerger, PhD, is a Senior Fellow at RTI and director of the RTIUNC Center of Excellence in Health Promotion Economics. Joel A. Segel, BA, was an associate economist at RTI before entering the doctoral program in health economics at the University of Michigan School of Public Health in the fall of 2009. Ping Zhang, PhD, is a health economist in the Division of Diabetes Translation at the Centers for Disease Control and Prevention. Stephen W. Sorensen, PhD, is a mathematical statistician in the Division of HIV/AIDS Prevention at the Centers for Disease Control and Prevention.
RTI Press publication MR-0013-0909 This PDF document was made available from www.rti.org as a public service of RTI International. More information about RTI Press can be found at http://www.rti.org/rtipress. RTI International is an independent, nonprofit research organization dedicated to improving the human condition by turning knowledge into practice. The RTI Press mission is to disseminate information about RTI research, analytic tools, and technical expertise to a national and international audience. RTI Press publications are peer-reviewed by at least two independent substantive experts and one or more Press editor. Suggested Citation
Hoerger, T.J., Segel, J.E., Zhang, P., and Sorensen, S.W. (2009). Validation of the CDC-RTI Diabetes Cost-Effectiveness Model. RTI Press publication No. MR-0013-0909. Research Triangle Park, NC: RTI International. Retrieved [date] from http://www.rti.org/rtipress.
This publication is part of the RTI Press Methods Report series. RTI International 3040 Cornwallis Road PO Box 12194 Research Triangle Park, NC 27709-2194 USA Tel: Fax: E-mail: Web site:
+1.919.541.6000 +1.919.541.5985
[email protected] www.rti.org
©2009 Research Triangle Institute. RTI International is a trade name of Research Triangle Institute. All rights reserved. Please note that this document is copyrighted and credit must be provided to the authors and source of the document when you quote from it. You must not sell the document or make a profit from reproducing it. doi:10.3768/rtipress.2009.mr.0013.0909 www.rti.org/rtipress
Validation of the CDC-RTI Diabetes Cost-Effectiveness Model Thomas J. Hoerger, Joel E. Segel, Ping Zhang, and Stephen W. Sorensen
Contents Introduction
2
Methods
2
The CDC-RTI Diabetes CostEffectiveness Model
2
Validation Procedures
2
Results
3
Microvascular Complications
7
Macrovascular Complications
7
Development of Diabetes from Prediabetes 7 Mortality Discussion
Abstract The purpose of this study was to assess the validity of the CDC-RTI Diabetes CostEffectiveness Model by comparing rates of diabetes incidence and complications to existing published results. We performed 47 internal and external validation exercises comparing the model-simulated outcomes with the outcomes from 24 published trials. To simulate the outcomes for each published study, we input a cohort with similar baseline characteristics and treatment and then modeled the development of diabetes and its complications for the same follow-up duration as in the trial. Outcomes measured included diabetes incidence, renal disease, neuropathy, retinopathy, cardiovascular disease, and mortality. The results of our model simulations were generally close to published outcomes. To determine how well our model was able to simulate the published outcomes, we ran three sets of simple regressions (actual outcome = b0 + b1 × simulated outcome)— one for the internal validation studies, one for the external validation studies, and one for the external validation studies of diabetes incidence. For the 17 internal validation analyses, the R2 value was 0.992 and the slope of the regression line was 1.001. For the 24 external validation analyses that did not include diabetes incidence, the R2 value was 0.969 and the slope of the regression line was 0.991; the six external validation analyses of diabetes incidence had an R2 value of 0.913. In conclusion, the CDC-RTI Diabetes Cost-Effectiveness Model accurately models the development and progression of diabetes and can be used to evaluate the cost-effectiveness of potential diabetes prevention and treatment programs.
7 8
Conclusions
9
References
10
Appendix A
13
Acknowledgments Inside back cover
2
RTI Press
Hoerger et al., 2009
Introduction The CDC-RTI Diabetes Cost-Effectiveness Model was designed to simulate the development and progression of type 2 diabetes to assess the costeffectiveness of various prevention and treatment interventions. To provide results useful for guiding public health policy, the model should accurately represent the experience of the diabetes population. Model validation helps ensure the accuracy of the model and is an important step in the construction of any disease model. The American Diabetes Association (ADA) Consensus Panel1 described the importance of validating diabetes models and provided steps to guide researchers in the validation process. The model has undergone informal and formal validation exercises, but these exercises have not been presented systematically. In addition, the model has been revised over the years to incorporate new data, revised parameters, and new functions. For example, we have incorporated the United Kingdom Prospective Diabetes Study (UKPDS) risk engines for coronary heart disease (CHD) and stroke in place of Framingham equations, and we have added a module for prediabetes (defined here as persons with impaired fasting glucose or impaired glucose tolerance who are at high risk of developing diabetes). Recently, we updated the model to incorporate recent data on costs, diabetes incidence, and mortality. Therefore, the objective of this analysis is to present the results of the validation of the CDC-RTI Diabetes CostEffectiveness Model, Version 6.2.
Methods The CDC-RTI Diabetes Cost-Effectiveness Model The CDC-RTI Diabetes Cost-Effectiveness Model is a Markov simulation model of disease progression and cost-effectiveness for type 2 diabetes. To reflect the chronic nature of diabetes, the model follows patients from diagnosis to either death or age 95 years. The model simulates development of diabetesrelated complications on three microvascular disease paths (nephropathy, neuropathy, and retinopathy) and two macrovascular disease paths
(CHD and stroke). The model also contains modules for diabetes screening and prediabetes. Model outcomes include disease complications, deaths, costs, and quality-adjusted life years (QALYs). In the model, progression between disease states is governed by transition probabilities that depend on risk factors—including glycemic level (measured by HbA1c levels), blood pressure, cholesterol, and smoking status—and duration of diabetes. Interventions affect the transition probabilities and resulting complications. For example, tight glycemic control lowers HbA1c, slowing progression on the microvascular complication paths. With slower progression, fewer microvascular complications occur, deaths are delayed, QALYs increase, and the costs of complications are reduced. The model has been used to estimate the cost-effectiveness of treatment interventions for patients with diagnosed diabetes,2 evaluate optimal resource allocation across interventions,3 assess whether screening for diabetes is cost-effective,4 show that lifestyle modification is cost-effective in delaying or preventing diabetes among persons with prediabetes,5 and estimate the cost-effectiveness of screening for prediabetes.6 Additional details about the model can be found in the study of the cost-effectiveness of treatments for patients with diagnosed diabetes2 or in the technical report accompanying the model (available upon request).
Validation Procedures We follow general validation procedures outlined by the International Society for Pharmacoeconomics and Outcomes Research (ISPOR) Task Force7 and by the ADA Consensus Panel1 on computer modeling in diabetes as well as methods used in validation studies of the Archimedes Diabetes Model8 and the CORE Diabetes Model.9 For the validation, we input baseline model parameters from studies that were used to create the model (internal validation) and those that were found from a review of the literature (external validation). We then ran the model and compared the overall outcomes in the model to those reported by the validation studies. We performed internal and external validation using 47 outcomes/complications from a mix of 24 published randomized trials and cohort studies, and one disease progression and cost-effectiveness model. For internal
3
Validation of a Cost-Effectiveness Model
validation, we included only those studies that were used to construct the model; for external validation, we examined the existing literature to find studies that were not used to design the model parameters. For external validation, we first examined the studies used to validate the Archimedes Diabetes Model8 and the CORE Diabetes Model.9 For each of these studies, we included only those studies where the study population was appropriate to use in the CDCRTI Diabetes Cost-Effectiveness Model, namely the population with type 2 diabetes. To supplement the studies used in the validation of the Archimedes and CORE Models, we performed a PubMed search of diabetes and each of the model complications (microalbuminuria, macroalbuminuria, end-stage renal disease [ESRD], neuropathy, lower extremity amputation [LEA], blindness, myocardial infarction [MI], angina, stroke, all-cause mortality, and progression from prediabetes to diabetes). For each of the diabetes complications, we included only studies that had outcomes for persons with type 2 diabetes. For prediabetes, we included only studies that measured the incidence of diabetes within a population with impaired glucose tolerance (IGT). We performed internal and external validation by comparing complications and outcomes from the model to those observed in each study included in
the validation exercises. For each validation exercise, we created a cohort with descriptive statistics similar to those of the population in the comparison study. Based on the existing structure of our model, we used the following variables to create the cohorts: age, sex, race/ethnicity, blood pressure, total cholesterol, and smoking status. After running the model for the simulated cohort, we compared the model outcomes/ complications to the outcomes/complications described in the comparison study. Some of the comparisons included conventional glycemic control, while others involved intensive glycemic control. We assessed the goodness-of-fit for the model by plotting model results against the published results and then calculating R2 values to measure how much of the actual variance our model can explain.
Results Information on each study and the comparison between model outcomes/complications and validation study results are shown in Table 1.10-34 The results in Table 1 show that, overall, the model accurately simulates the natural history of the diabetes population and predicts the progression from prediabetes to diabetes. For the majority of complications, the model results closely match the published results.
Table 1. Summary comparison of published study results with results from the CDC-RTI Diabetes Cost-Effectiveness Model
Study
Population Studied
Treatment Group—Type of Glycemic Control
Years of Outcome Follow- [n] = identifier number Up for Figures 1–3
Study Result
Model Result
28%
26.3%
Internal Validation Studies UKPDS 33,10 UKPDS 6411
Ages 25–55 with newly diagnosed type 2 diabetes recruited between 1977 and 1991
Combined intensive and conventional glycemic control
15
Microalbuminuria (survivor incidence) [1]
15
Macroalbuminuria (survivor incidence) [2]
Intensive
12
Conventional
7.1%
5.7%
Neuropathy (survivor incidence) [3]
30.2%
27.1%
12
Neuropathy (survivor incidence) [4]
32.8%
31.0%
Intensive
15
Photocoagulation (events per 1,000 patient years) [5]
7.9
8.4
Conventional
15
Photocoagulation (events per 1,000 patient years) [6]
11.0
10.7
4
RTI Press
Hoerger et al., 2009
Table 1. Summary comparison of published study results with results from the CDC-RTI Diabetes Cost-Effectiveness Model (continued)
Study
Population Studied
UKPDS 33,10 UKPDS 6411 (continued)
Ages 25–55 with newly diagnosed type 2 diabetes recruited between 1977 and 1991 (continued)
UKPDS 8012
Diabetes Prevention Program (DPP)13
Long-term UKPDS follow-up
Over age 25, body mass index (BMI) > 24, elevated plasma glucose, recruited from 27 health centers, 1996–1999
Treatment Group—Type of Glycemic Control
Years of Outcome Follow- [n] = identifier number Up for Figures 1–3
Study Result
Model Result
Intensive
15
Myocardial infarction (MI) (events per 1,000 patient years) [7]
14.7
16.9
Conventional
15
MI (events per 1,000 patient years) [8]
17.4
18.0
Intensive
15
Angina (events per 1,000 patient years) [9]
6.8
8.8
Conventional
15
Angina (events per 1,000 patient years) [10]
6.7
8.8
Intensive
15
Stroke (events per 1,000 patient years) [11]
5.6
4.7
Conventional
15
Stroke (events per 1,000 patient years) [12]
5.0
4.4
Intensive
17.7
MI (events per 1,000 patient years) [13]
16.5
17.0
Conventional
17.7
MI (events per 1,000 patient years) [14]
20.0
21.4
Intensive
17.7
Stroke (events per 1,000 patient years) [15]
6.3
7.7
Conventional
17.7
Stroke (events per 1,000 patient years) [16]
6.9
7.4
Conventional
4
Cumulative incidence of diabetes [17]
37%
35.0%
Conventional
25
Cumulative incidence of microalbuminuria [18]
40%
47.7%
25
Cumulative incidence of macroalbuminuria [19]
27%
22.1%
25
Cumulative incidence of endstage renal disease (ESRD) [20]
6%
6.7%
25
Cumulative incidence of blindness [21]
17%
19.1%
External Validation Studies Eastman et al.14
Model of ages 25–74 with type 2 diabetes
Ravid et al.15
Ages 40–65 in Tel Aviv with type 2 diabetes of less than 5 years’ duration, beginning in 1990–1991
Conventional
8
Cumulative incidence of microalbuminuria [22]
35.0%
32.7%
Ravid et al.16
Ages 40–65 in Tel Aviv with type 2 diabetes of less than 10 years’ duration, beginning in 1990–1991
Conventional
6
Cumulative incidence of microalbuminuria [23]
19.0%
18.4%
Ansquer et al. (DAIS)17
Middle-age persons in France with type 2 diabetes, normoalbuminuria, and mild/moderate lipid abnormalities
Tight glycemic control
3
Cumulative incidence of microalbuminuria [24]
3.0%
2.9%
Bruno et al.18
Residents in northwest Italy with known type 2 diabetes, baseline exam 1991–1992
Conventional
6.7
Incidence of ESRD per 1,000 patient years [25]
1.0
0.8
Partanen et al.19
Ages 45–64 in Finland with newly diagnosed type 2 diabetes, evaluated 1979–1981
Conventional
22.0%
24.1%
10
Cumulative incidence of neuropathy [26]
5
Validation of a Cost-Effectiveness Model
Table 1. Summary comparison of published study results with results from the CDC-RTI Diabetes Cost-Effectiveness Model (continued) Treatment Group—Type of Glycemic Control
Years of Outcome Follow- [n] = identifier number Up for Figures 1–3
Study
Population Studied
Humphrey et al.20
Rochester Diabetes Project— individuals diagnosed with diabetes between 1945 and 1979 then followed up until 1985. No information about demographics, so used demographics from Moss, Klein, and Klein.21
Conventional
25
Haffner et al. 22
Ages 45–64 with diabetes, from two Finnish hospital districts, 1982–1984
Conventional
7
Lee et al.23
Calhoun et al.24 (CARDS)
WHO multinational follow-up study from 10 of 14 international centers, 1983–1990
Conventional
8
Model Result
6.9%
6.6%
MI (events per 1,000 patient years) [28]
32.0
32.0
Stroke (events per 1,000 patient years) [29]
16.0
4.3
MI (incidence rate per 1,000 patient years) [30]
10.7
11.3
Cumulative incidence of angina [31]
11.1%
4.0%
Cumulative incidence of stroke [32]
8.0%
1.4%
Cumulative incidence of MI [33]
4.6%
5.4%
Cumulative incidence of stroke [34]
2.8%
1.7%
Cumulative incidence of MI [35]
1.5%
3.9%
Cumulative incidence of stroke [36]
1.3%
1.1%
Cumulative incidence of MI [37]
4.9%
4.8%
Cumulative incidence of stroke [38]
1.4%
1.45%
3.9%
2.3%
Ages 40–75 in UK or Ireland with type 2 diabetes and one cardiovascular disease (CVD) risk factor but no history of CVD. Randomized cholesterol control trial, 1997–2001.
Conventional
Ages 30–75 from US, Canada, and Europe with type 2 diabetes and no pharmacological treatment, 2000–2002
Intensive
Ages 40–79 with type 2 and A1c over 7.5% and CVD, or ages 55–79 with atherosclerosis, albuminuria, left ventricular hypertrophy, or two additional CVD risk factors, 2001–2003
Intensive
ADVANCE27
Ages 55 or older with type 2 diabetes, from 20 countries beginning in 2001
Conventional
4
Cumulative incidence of stroke [39]
Gu et al.28
Ages 35–74 with self-reported diabetes in NHANES I, 1971–1975
Conventional
8.5
All-cause mortality (deaths per 1,000 person years) [40]
51.3
56.0
Sasaki et al.29
Persons with type 2 diabetes in Osaka, Japan, first seen in the clinic between 1960 and 1979
Conventional
15
All-cause mortality (deaths per 1,000 person years) [41]
31
28
Li et al.30
Adults with impaired glucose tolerance (IGT) in Da Qing, China
Conventional
6
Cumulative incidence of diabetes [42]
65.8%
48.2%
20
Cumulative incidence of diabetes [42]
92.8%
82.6%
Kahn et al. (ADOPT)25
ACCORD26
4
Cumulative incidence of lower extremity amputation (LEA) [27]
Study Result
4
3.5
Tuomilehto et al.31
Finnish subjects at high risk for diabetes (IGT)
Conventional
7
Cumulative incidence of diabetes [43]
43%
51.2%
Ramachandran et al.32
Indian subjects with persistent IGT
Conventional
3
Cumulative incidence of diabetes [44]
55%
28.6%
Kosaka et al.33
Japanese males with IGT screened from 1990 to 1992
Conventional
4
Cumulative incidence of diabetes [45]
9%
35.4%
Chiasson et al.34
Ages 40–70 from multiple countries with BMI 25–40 and IGT
Conventional
3.3
Cumulative incidence of diabetes [46]
42%
31.6%
BMI = body mass index; CVD = cardiovascular disease; ESRD = end-stage renal disease; IGT = impaired glucose tolerance; LEA = lower extremity amputation; MI = myocardial infarction.
6
RTI Press
Hoerger et al., 2009
To further assess how well the model matches actual results, we also compared the collective fit across complications by plotting model results against the study results and estimating the correlation. The collective results for the internal validation and external validation (excluding prediabetes) are shown in Figures 1 and 2, respectively. The model results fit the actual data well, with most of the values from the internal and external validation falling close to the 45-degree line, which represents perfect correlation between the model and actual results. We report regression line slopes and R2 values from the regressions using the methods described by Palmer et al.9 Although some R-squared values may be very close to 1.000 (i.e., the slope of the 45-degree line),
this does not necessarily mean that each outcome from each study was exactly matched; rather, the overall match is close. The results from the internal validation (only those studies used in creating the model) closely match the actual data—the regression line slope of 1.001 is close to 1.000, and the R2 value is 0.992, which indicates that the model explains approximately 99 percent of the variance in the actual data. The external validation showed the model also matched the results from studies not used to create the model. The external validation (which focuses on studies that were not used in creating the model) had a regression slope of 0.991 and a high R2 value of 0.969; for this regression, we excluded prediabetes outcomes.
Figure 1. Comparison of modeled diabetes complication incidence rates to results from the internal validation study (only those studies used in creating the model)
Figure 2. Comparison of modeled diabetes complication incidence rates to results from the external validation study (not including prediabetes results) 50%
14 13
30% 7
8
4
17
3
1
20% 15 16 9 10
10%
12
8
5
11
Y = 1.001X R2 = 0.992
2
0% 0%
10%
20%
30%
40%
Incidence rate of complications (Validation study results)
Incidence rate of complications (Model results)
Incidence rate of complications (Model results)
40%
18
40
41
40% 22
30% 26 28
21
20%
19
23 30
10%
20 33 3524 27 31 37 38 39 32 29 0% 2536 34
0%
10%
Y = 0.991X R2 = 0.969
20%
30%
40%
50%
Incidence rate of complications (Validation study results)
Note: Numbers correlate to Outcome numbers from Table 1. Event rates per 1,000 patient years were converted to incidence rates by multiplying the event rate by the number of years of follow-up.
Note: Numbers correlate to Outcome numbers from Table 1. Event rates per 1,000 patient years were converted to incidence rates by multiplying the event rate by the number of years of follow-up.
The results from the internal validation (only those studies used in creating the model) closely match the actual data—the regression line slope of 1.001 is close to 1.000, and the R2 value is 0.992, which indicates that the model explains approximately 99 percent of the variance in the actual data.
The external validation (which focuses on studies that were not used in creating the model) had a regression slope of 0.991 and a high R2 value of 0.969.
7
Validation of a Cost-Effectiveness Model
Microvascular Complications
Development of Diabetes from Prediabetes
We assessed the model fit for three categories of microvascular complications: nephropathy, neuropathy, and retinopathy. The model accurately predicts these specific microvascular complications overall, with an R2 value of 0.986. The model is similarly accurate for the three nephropathy complications (microalbuminuria, macroalbuminuria, and ESRD), with an R2 value of 0.981. Because of the complicated nature of kidney disease, the model predicted the outcomes for the earlier stages (microalbuminuria) better than for the later stages (macroalbuminuria or ESRD). Few studies were available to validate the neuropathy and retinopathy complications, so, although the model fit the actual data well, we did not calculate an R2 value for each of these specific complications.
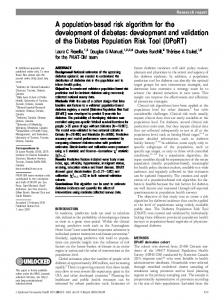
We plotted the model results and the published results for the percentage of individuals with IGT against time in Figure 3. We connected the model results with a line to indicate how the model predicted incidence of diabetes over time. The specific points in the figure are based on the duration time reported in the results for each trial. For that time, we plotted the published cumulative incidence of diabetes from the trial (diamonds) and the cumulative incidence predicted by the model (triangles). As expected, the model most closely matched the results from the Diabetes Prevention Program (DPP), which was used in constructing the model. Although the model does not perfectly match the published results, the model fit well (R2 = 0.913), with the published results evenly distributed above and below the model prediction.
Macrovascular Complications We also assessed the model fit for macrovascular complications, which included CHD (angina and MI) and stroke. The model fit was better for CHD (R2 = 0.982) than for stroke (0.800), although the worse fit for stroke was due primarily to several older studies used in the comparison. Overall, the model fit the macrovascular complications well, with an R2 value of 0.958. For the macrovascular complications, we also examined how well the model results matched the UKPDS results over time. The model appears to model the incidence of MI and stroke well in the earlier years (see Appendix Figures 4 and 5). However, in the later years, the model underestimated the incidence of MI and stroke.
Figure 3. Model vs. published data comparison of the percentage progressing from prediabetes to incident diabetes 100% 42
Percent developing diabetes
For internal validation, we also analyzed how well the model matched the UKPDS results across each time period. We compared the UKPDS trial results with the model results for the incidence of peripheral neuropathy, microalbuminuria, and proteinuria (see Appendix Figures 1, 2, and 3). In general, the model fit the UKPDS results well over time, although the model fits the data better in earlier years and then slightly underestimates the rates of peripheral neuropathy, microalbuminuria, and proteinuria in later years.
75% 42 44
50%
43
46
17
25% 43 43
0%
0
43
Study Model
45
5
10
15
20
25
Years Note: Numbers correlate to Outcome numbers from Table 1.
Mortality The model accurately predicts the total-cause mortality for the Japanese diabetes population in Sasaki et al.29 and the American diabetes population in Gu, Cowie, and Harris.28 Despite the difference in country, the model is within 10 percent of the published estimate for Japan.
8
Hoerger et al., 2009
Discussion As the ADA Consensus Panel indicated, validation is an essential part of designing any diabetes model. The process helps define the population for which the model is applicable and demonstrates the model’s accuracy in representing actual diabetes progression. Although the model has been continuously validated throughout the model construction process, primarily by checking for programming errors and using internal validation, results of systematic validation have not been presented. This comprehensive validation process by the developers of the model shows that the model accurately simulates the development of diabetes and its complications. The external validation also indicates that the model can accurately simulate the progression of diabetes for populations not used directly in model construction. This is particularly important because it demonstrates that the model can be applied to similar populations to estimate the cost-effectiveness of new interventions. However, our model is limited to the populations for which we have data, primarily people from clinical trials in the United States and the United Kingdom. The more a population differs from the one used to build the model, the less accurate the model will be in simulating that population. We excluded several studies from the validation results because the study populations did not fit the model structure and were therefore not appropriate to use in the model. For example, the Parving et al. study,35 Reduction of Endpoints in NIDDM with the Angiotensin II Antagonist Losartan (RENAAL) study,36 and Irbesartan in Diabetic Nephropathy Trial (IDNT)37, 38 only included populations with somewhat advanced kidney disease. Because our model primarily used UKPDS data, the model parameters are set to match a more heterogeneous group and not a population that exclusively has kidney disease. We also excluded the Wisconsin Epidemiological Study of Diabetic Retinopathy (WESDR) study39 because the study was relatively old and the population had very poor glycemic control. As diabetes care has improved, the rate of diabetes complications has decreased, so the data on which the model was built may not be applicable to the older WESDR study.
RTI Press
Overall, the internal validation shows that the model can accurately reproduce results from the studies used to create the model. The two exceptions are the results for MI and stroke over time. For MI and stroke, the model estimates incidence well for the first 9 years but then underestimates cumulative incidence in the later years. Although the model underestimates cumulative incidence, the model appears to be fairly accurate in the estimation of MI and stroke events per 1,000 patient years. This can be partly explained by the use of the UKPDS risk engine in the model, which calculates the probability of MI or stroke absent mortality from any other causes. However, our model includes multiple causes of death, which reduce life years and consequently lower the likelihood of a person having an MI or stroke during his/her lifetime. This may explain the lower incidence of MI or stroke in the later years, while the reduced life years explain how the model still estimates the number of events per 1,000 patient years well. Stroke is the one notable complication where the model does not perform as accurately in external validation exercises. However, the rate of stroke seems to vary widely within the published results, so it would be difficult to match the results from each study. One reason for the variation may be secular improvements in stroke prevention, especially within the diabetes population. As stroke prevention has improved, the rate of strokes has decreased. Although the model has some trouble modeling the incidence of stroke, it does appear that the prediction is better for more recent studies than for older studies, as shown in Figure 4. Figure 4 presents the rate of stroke by the final study year. We made similar graphs using the beginning study year and the middle study year (graphs not shown), but these changes did not affect the basic result. In addition to stroke, the model is also not as accurate in predicting the progression from prediabetes to incident diabetes for the international studies included in the external validation exercises. However, as Table 1 and Figure 3 show, the published results for the incidence of diabetes vary considerably. For example, the cumulative incidence of diabetes was 9 percent with follow-up of 4 years in the Japan Diabetes Prevention Program,33 55 percent with 3 years of follow-up from the Indian Diabetes
Validation of a Cost-Effectiveness Model
Figure 4. Absolute difference between trial and model result for stroke, by year of study
Absolute difference
9%
6%
3%
0% 1985
1990
1995
2000
2005
2010
Study year
Prevention Program,32 and 42 percent with 3.3 years of follow-up in the Study to Prevent NIDDM (STOP-NIDDM).34 Because of the wide variation in published results, it would be difficult to accurately predict the results for each individual country. The differences in diabetes incidence rates between countries may stem from differences in the definition of prediabetes across countries; differences in the eligibility requirements across studies; or countryspecific factors, such as the potential variation in typical care provided for the prediabetes population. The model was constructed to accurately predict the results for the DPP, which it does, and may be more appropriate for predicting the incidence of diabetes in an American population. There are at least two options for improving the fit of the model for prediabetes. First, and most simply, we could use country-specific data to set the transition probability to diabetes every time we wish to study progression in a different country. This approach will capture country-specific effects on diabetes, but it will not reflect patient heterogeneity unless patientspecific data from that specific country are also available. Second, instead of using a single parameter to represent the transition probability, we could replace the parameter with a function that depends on a set of patient characteristics such as those used in the Framingham Offspring Study algorithm for estimating 8-year diabetes incidence.40 Such an approach would incorporate patient heterogeneity, although it would not necessarily reflect countryspecific effects on incidence, and it may not fully reflect differences in patient populations within the United States.41
9
Conclusions The CDC-RTI Diabetes Cost-Effectiveness Model’s purpose is to assess the cost-effectiveness of various prevention and treatment interventions by simulating the development and progression of type 2 diabetes. However, the cost-effectiveness estimates are only useful if the simulation is an accurate representation of the true clinical course of diabetes. To ensure the accuracy of the model, an essential step in the development of any disease model is validation. Our validation exercises show that the model accurately simulates the development and progression of diabetes. The validation results also indicate that the model can be effectively used to compare the cost-effectiveness of various diabetes prevention or treatment programs for the type 2 diabetes population. Although the model accurately simulates the incidence and progression of type 2 diabetes for most populations, it may not be as well suited for several other populations. The model may not be appropriate for diabetes populations where the entire population already has advanced stages of complications (e.g., the population with advanced kidney disease) or for populations with very poor glycemic control (e.g., the WESDR population). As the prediabetes results showed, the model also may not be as accurate for non-US populations, because medical treatment may differ geographically. In these cases, it may be possible to improve model accuracy by changing the model’s default parameters while retaining the model’s underlying structure. For example, when dealing with a known population of persons with advanced kidney disease, it may be possible to insert transition probabilities associated with this population. For persons with prediabetes in another country, it may be possible to use a countryspecific probability of developing diabetes. As highlighted in the ISPOR disease modeling guidelines, models must be continuously updated as new information emerges.7 As we update the model structure and inputs, we will continue to perform validation exercises to ensure that the model accurately simulates diabetes incidence and progression.
10
Hoerger et al., 2009
RTI Press
References 1. American Diabetes Association Consensus Panel. Guidelines for computer modeling of diabetes and its complications. Diabetes Care. 2004;27:2262-5. 2. CDC Diabetes Cost-Effectiveness Group. Costeffectiveness of intensive glycemic control, intensified hypertension control, and serum cholesterol level reduction for type 2 diabetes. JAMA. 2002 May;287(19):2542-51. 3. Earnshaw SR, Richter A, Sorensen SW, Hoerger TJ, Hicks KA, Engelgau M, et al. Optimal allocation of resources across four interventions for type 2 diabetes. Med Decis Making. 2002 Sep-Oct;22(5 Suppl):S80-S91. 4. Hoerger TJ, Harris R, Hicks KA, Donahue K, Sorensen S, Engelgau M. Screening for type 2 diabetes mellitus: a cost-effectiveness analysis. Ann Intern Med. 2004;140(9):689-99. 5. Herman WH, Hoerger TJ, Brandle M, Hicks K, Sorensen S, Zhang P, et al.; Diabetes Prevention Program Research Group. The cost-effectiveness of lifestyle modification or metformin in preventing type 2 diabetes in adults with impaired glucose tolerance. Ann Intern Med. 2005;142(5):323-32. 6. Hoerger TJ, Hicks KA, Sorensen SW, Herman WH, Ratner RE, Ackermann RT, et al. The costeffectiveness of screening for prediabetes among overweight and obese U.S. adults. Diabetes Care. 2007;30(11):2874-9. 7. Weinstein MC, O’Brien B, Hornberger J, Johannesson M, McCabe C, Luce BR; ISPOR Task Force on Good Research Practices—Modeling Studies. Principles of good practice for decision analytic modeling in health-care evaluation: report of the ISPOR Task Force on Good Research Practices—Modeling Studies. Value Health. 2003;6(1):9-17. 8. Eddy DM, Schlessinger L. Validation of the Archimedes diabetes model. Diabetes Care. 2003;26(11):3102-10.
9. Palmer AJ, Roze S, Valentine WJ, Minshall ME, Foos V, Lurati FM, et al. Validation of the CORE Diabetes Model against epidemiological and clinical studies. Curr Med Res Opin. 2004;20(Suppl 1):S27-S40. 10. UK Prospective Diabetes Study (UKPDS) Group. Intensive blood-glucose control with sulphonylureas or insulin compared with conventional treatment and risk of complications in patients with type 2 diabetes. Lancet. 1998;352:837-53. 11. Adler AI, Stevens RJ, Manley SE, Bilous RW, Cull CA, Holman RR; UKPDS Group. Development and progression of nephropathy in type 2 diabetes: the United Kingdom Prospective Diabetes Study (UKPDS 64). Kidney Int. 2003;63(1):225-32. 12. Holman RR, Paul SK, Bethel MA, Matthews DR, Neil HAW. 10-year follow-up of intensive glucose control in type 2 diabetes (UKPDS 80). N Engl J Med. 2008;359(15):1577-89. 13. Diabetes Prevention Program Research Group. The Diabetes Prevention Program: baseline characteristics of the randomized cohort. Diabetes Care. 2000;23:1619-29. 14. Eastman RC, Javitt JC, Herman WH, Dasbach EJ, Zbrozck AS, Dong F, et al. Model of complications of NIDDM. I. Model construction and assumptions. Diabetes Care. 1997;20(5):725-34. 15. Ravid M, Brosh D, Ravid-Safran D, Levy Z, Rachmani R. Main risk factors for nephropathy in type 2 diabetes mellitus are plasma cholesterol levels, mean blood pressure, and hyperglycemia. Arch Intern Med. 1998;158(9):998-1004. 16. Ravid M, Brosh D, Levi Z, Bar-Dayan Y, Ravid D, Rachmani R. Use of enalapril to attenuate decline in renal function in normotensive, normoalbuminuric patients with type 2 diabetes mellitus: a randomized, controlled trial. Ann Intern Med. 1998;128:982-8.
17. Ansquer JC, Foucher C, Rattier S, Taskinen MR, Steiner G; DAIS Investigators. Fenofibrate reduces progression to microalbuminuria over 3 years in a placebo-controlled study in type 2 diabetes: results from the Diabetes Atherosclerosis Intervention Study (DAIS). Am J Kidney Dis. 2005;45(3):485-93. 18. Bruno G, Biggeri A, Merletti F, Bargero G, Ferrero S, Pagano G, et al. Low incidence of end-stage renal disease and chronic renal failure in type 2 diabetes: a 10-year prospective study. Diabetes Care. 2003;26:2353-8. 19. Partanen J, Niskanen L, Lehtinen J, Mervaaka E, Siitonen O, Uusitupa M. Natural history of peripheral neuropathy in patients with non-insulin dependent diabetes mellitus. N Engl J Med. 1995;333(2):89-94. 20. Humphrey LL, Palumbo PJ, Butters MA, Hallett JW Jr, Chu CP, O’Fallon WM, et al. The contribution of non-insulin-dependent diabetes to lower-extremity amputation in the community. Arch Intern Med. 1994;154:885-92. 21. Moss SE, Klein R, Klein BE. The 14-year incidence of lower-extremity amputations in a diabetic population. Diabetes Care. 1999;22:951-9. 22. Haffner SM, Lehto S, Ronnemaa T, Pyorala K, Laakso M. Mortality from coronary heart disease in subjects with type 2 diabetes and in nondiabetic subjects with and without prior myocardial infarction. N Engl J Med. 1998;339(4):229-34.
Validation of a Cost-Effectiveness Model
11
25. Kahn SE, Haffner SM, Heise MA, Herman WH, Holman RR, Jones NP, et al.; ADOPT Study Group: Glycemic durability of rosiglitazone, metformin, or glyburide monotherapy. N Engl J Med. 2006;355:2427-43. 26. ACCORD Study Group. Effects of intensive glucose lowering in type 2 diabetes. N Engl J Med. 2008;358(24):2545-59. 27. ADVANCE Study Group. Effects of a fixed combination of perindopril and indapamide on macrovascular and microvascular outcomes in patients with type 2 diabetes mellitus (the ADVANCE trial): a randomized controlled trial. Lancet. 2007;370:829-40. 28. Gu K, Cowie CC, Harris MI. Diabetes and decline in heart disease mortality in US adults. JAMA. 1999;281(14):1291-7. 29. Sasaki A, Uehara M, Horiuchi N, Hasegawa K, Shimizu T. A 15-year follow-up study of patients with non-insulin-dependent diabetes mellitus (NIDDM) in Osaka, Japan: long-term prognosis and causes of death. Diabetes Res Clin Pract. 1996;34(1):47-55. 30. Li G, Zhang P, Wang J, Gregg EW, Yang W, Gong Q, et al. The long-term effect of lifestyle interventions to prevent diabetes in the China Da Qing Diabetes Prevention Study: a 20-year follow-up study. Lancet. 2008;371:1783-9.
23. Lee ET, Bennett PH, Fuller JH, Lu M. Followup of the WHO multinational study of vascular disease in diabetes: general description and morbidity. Diabetologia. 2001;44(Suppl 2):S3-S13.
31. Tuomilehto J, Lindstrom J, Eriksson JG, Valle TT, Hämäläinen H, Ilanne-Parikka P, et al.; Finnish Diabetes Prevention Study Group: Prevention of type 2 diabetes mellitus by changes in lifestyle among subjects with impaired glucose tolerance. N Engl J Med. 2001;344(18):1343-50.
24. Calhoun HM, Betteridge DJ, Durrington PN, Hitman GA, Neil HA, Livingstone SJ, et al.; CARDS investigators. Primary prevention of cardiovascular disease with atorvastatin in type 2 diabetes in the Collaborative Atorvastatin Diabetes Study (CARDS): multicentre randomized placebo-controlled trial. Lancet. 2004;364:385-96.
32. Ramachandran A, Snehalatha C, Mary S, Mukesh B, Bhaskar AD, Vijay V; Indian Diabetes Prevention Programme (IDPP). The Indian Diabetes Prevention Programme shows that lifestyle modification and metformin prevent type 2 diabetes in Asian Indian subjects with impaired glucose tolerance (IDPP-1). Diabetologia. 2006;49(2):289-97.
12
Hoerger et al., 2009
33. Kosaka K, Noda M, Kuzuya T. Prevention of type 2 diabetes by lifestyle intervention: a Japanese trial in IGT males (JDPP). Diabetes Res Clin Pract. 2005;67:152-62. 34. Chiasson JL, Josse RG, Gomis R, Hanefeld M, Karasik A, Laakso M; STOP-NIDDM Trial Research Group. Acarbose for prevention of type 2 diabetes mellitus: the STOP-NIDDM randomised trial. Lancet. 2002;359(9323):2072-7. 35. Parving HH, Lehnert H, Brochner-Mortensen J, Gomis R, Andersen S, Arner P; Irbesartan in Patients with Type 2 Diabetes and Microalbuminuria Study Group. The effect of irbesartan on the development of diabetic nephropathy in patients with type 2 diabetes. N Engl J Med. 2001;345(12):870-8. 36. Brenner BM, Cooper ME, de Zeeuw D, Keane WF, Mitch WE, Parving HH, et al.; RENAAL Study Investigators. Effects of losartan on renal and cardiovascular outcomes in patients with type 2 diabetes and nephropathy. N Engl J Med. 2001;345(12):861-9. 37. Lewis EJ, Hunsicker HG, Clarke WR, Berl T, Pohl MA, Lewis JB, et al. for the Collaborative Study Group. Renoprotective effect of the angiotensin-receptor antagonist irbesartan in patients with nephropathy due to type 2 diabetes. N Engl J Med. 2001;345(12):851-60.
RTI Press
38. Berl T, Hunsicker HG, Lewis JB, Pfeffer MA, Porush JG, Rouleau JL, et al. for the Collaborative Study Group. Cardiovascular outcomes in the Irbesartan Diabetic Nephropathy Trial of patients with type 2 diabetes and overt nephropathy. Ann Intern Med. 2003;138(7):542-9. 39. Klein R, Klein BE, Moss SE, Wong TY. Retinal vessel caliber and microvascular and macrovascular disease in type 2 diabetes: XXI: The Wisconsin Epidemiologic Study of Diabetic Retinopathy. Ophthalmology. 2007;114:1884-92. 40. Wilson PWF, Meigs JB, Sullivan L, Fox CS, Nathan DM, D’Agostino RB Sr. Prediction of incident diabetes mellitus in middle-aged adults: the Framingham Offspring Study. Arch Intern Med. 2007;167(1):1068-74. 41. Nichols GA, Brown JB. Validating the Framingham Offspring Study equations for predicting incident diabetes mellitus. Am J Manag Care. 2008;14(9):574-80.
13
Validation of a Cost-Effectiveness Model
Appendix A
For internal validation, we also analyzed how well the model matched the United Kingdom Prospective Diabetes Study (UKPDS) results across each time period. Figures 1 through 3 compare the UKPDS trial results with the model results for the incidence of peripheral neuropathy, microalbuminuria, and proteinuria, respectively. In general, the model appears to fit the data well over time, although the model fits the data better in the earlier years. For peripheral neuropathy, the model appears to fit the data very well until 12 years after randomization, when the model appears to slightly underpredict the incidence of peripheral neuropathy. For microalbuminuria, the model appears to slightly overpredict incidence for the intensive glycemic control group; and for the conventional glycemic control group, the model slightly overpredicts during the earlier years and then underpredicts during the later years. Finally, for proteinuria, the model appears to predict the incidence very well for the intensive glycemic control group; and for the conventional glycemic control group, the model overpredicts slightly during the earlier years and underpredicts slightly during the later years. Overall, the model appears to do a good job approximating the UKPDS results over time.
Figure A-1. Internal validation of peripheral neuropathy incidence over time
Proportion of patients with peripheral neuropathy
40% 30% 20% Intensive glycemic control (Trial) Intensive glycemic control (Model) Conventional glycemic control (Trial) Conventional glycemic control (Model)
10% 0%
0
5
10
15
Year
Figure A-2. Internal validation of microalbuminuria incidence over time 40%
Proportion of patients with microalbuminuria
We assessed the model fit for three categories of microvascular complications: nephropathy, neuropathy, and retinopathy. The model is very accurate in predicting the microvascular complications overall, with an R2 value of 0.986. The model is similarly accurate for the three nephropathy complications (microalbuminuria, macroalbuminuria, and end-stage renal disease [ESRD]), with an R2 value of 0.981. In general, the model was more accurate for microalbuminuria than for macroalbuminuria or ESRD. Because of the complicated nature of kidney disease, the model was better able to predict outcomes for the earlier stages. Limited studies were available to validate the neuropathy and retinopathy complications, so, although the model appears to fit the actual data well, we did not calculate an R2 value for each of these specific complications.
30%
20% Intensive glycemic control (Trial) Intensive glycemic control (Model) Conventional glycemic control (Trial) Conventional glycemic control (Model)
10%
0% 0
5
10
15
20
Year
Figure A-3. Internal validation of proteinuria incidence over time 40% Proportion of patients with proteinuria
Microvascular Complications
Intensive glycemic control (Trial) Intensive glycemic control (Model) Conventional glycemic control (Trial)
30%
Conventional glycemic control (Model)
20% 10% 0% 0
5
10 Year
15
20
RTI Press
Hoerger et al., 2009
We also assessed the model fit for macrovascular complications, which included coronary heart disease (CHD) (angina and myocardial infarction [MI]) and stroke. The model fit was better for CHD (R2 = 0.982) than for stroke (0.800), although the low model fit for stroke was due primarily to several older studies. Overall, the model fit the macrovascular complications well, with an R2 value of 0.958. For the macrovascular complications, we also examined how well the model results matched the UKPDS results over time. As Figures 4 and 5 show, the model appears to accurately model the incidence of both MI and stroke well in the earlier years. However, in the later years, the model appears to underestimate the incidence of MI and stroke. This may be partially explained by the relatively lower number of participants remaining at the 15-year point—approximately 70 (of 1,096) in the conventional treatment group and 188 (of 2,632) in the intensive treatment group.
Figure A-4. Internal validation of myocardial infarction incidence over time 40% Proportion of patients with myocardial infarction
Macrovascular Complications
Intensive glycemic control (Trial) Intensive glycemic control (Model) Conventional glycemic control (Trial) Conventional glycemic control (Model)
30% 20% 10% 0%
0
5
10 Year
15
20
Figure A-5. Internal validation of stroke incidence over time 10% Proportion of patients with stroke
14
Intensive glycemic control (Trial) Intensive glycemic control (Model) Conventional glycemic control (Trial) Conventional glycemic control (Model)
8% 5% 3% 0% 0
5
10 Year
15
20
Acknowledgments This research was supported by funding (Contract No. 200-2002-00776) from the Centers for Disease Control and Prevention (CDC). The findings and conclusions in this report are those of the authors and do not necessarily represent the official position of the CDC. We thank Anke Richter, PhD, Albert Bethke, PhD, Claire Gibbons, MA, Stephanie Earnshaw, PhD, Katherine Hicks, MS, and Beth Barnwell, PhD, for their work on the development of the CDCRTI Diabetes Cost-Effectiveness Model and Kathleen Wirth, BA, for her work in validating previous versions of the model.
RTI International is an independent, nonprofit research organization dedicated to improving the human condition by turning knowledge into practice. RTI offers innovative research and technical solutions to governments and businesses worldwide in the areas of health and pharmaceuticals, education and training, surveys and statistics, advanced technology, international development, economic and social policy, energy and the environment, and laboratory and chemistry services. The RTI Press complements traditional publication outlets by providing another way for RTI researchers to disseminate the knowledge they generate. This PDF document is offered as a public service of RTI International. More information about RTI Press can be found at www.rti.org/rtipress. www.rti.org/rtipress
RTI Press publication MR-0013-0909