The Hordaland Homocysteine Study. JAMA 1995;274: 1526 â33. 9. Selhub J, Jacques PF, Wilson PWF, Rush D, Rosenberg IH. Vitamin status and intake as ...
Clinical Chemistry 44:1 102–107 (1998)
Test Utilization and Outcomes
Variability and determinants of total homocysteine concentrations in plasma in an elderly population Robert Clarke,1* Peter Woodhouse,2 Arve Ulvik,3 Chris Frost,4 Paul Sherliker,1 Helga Refsum,3 Per M. Ueland,3 and Kay-Tee Khaw2 cobalamin deficiencies [6, 7]. These predictive and diagnostic aspects of tHcy concentrations may be particularly relevant to the elderly, where increased tHcy concentrations are common [8 –12]. Blood tHcy concentrations are chiefly determined by increasing age, male sex, renal function, and folate and cobalamin status [8 –12]. The vitamin effect is related to the role of 5-methyltetrahydrofolate as a substrate and cobalamin as a coenzyme in homocysteine remethylation to methionine [13]. The most common genetic determinant of plasma tHcy is the C677T polymorphism in the gene that encodes the methylenetetrahydrofolate reductase (MTHFR) enzyme. This genetic variant predisposes to high tHcy concentrations under conditions of impaired folate status, probably because the mutation impedes the formation of 5-methyltetrahydrofolate [14 –16]. There is extensive information on the between-person variations in tHcy concentrations [8 –12], and most clinical studies to date are based on a single determination [5]. Data on the within-person variability in tHcy concentrations are still sparse [17, 18], despite the fact that such knowledge is essential for accurate assessment of risk factor associations with disease. A large within-person variability will underestimate the strength of any risk associations through “regression dilution” [19 –21]. Longterm stability of tHcy concentrations should be related to seasonal variations in folate status [22]. Furthermore, susceptibility to increased tHcy concentrations in individuals with the C677T mutation and low folate status [23] may suggest that such individuals have a greater variability in tHcy concentrations. The aims of the present study were to examine the reliability of a single measurement of tHcy; to determine the within- and between-person variability in tHcy and the extent to which the between-person variation may be explained by differences in the vitamin or genetic determinants of tHcy; and to assess the seasonal variability in tHcy and compare these variations with those for serum cholesterol and systolic blood pressure in the same population.
The variability of plasma total homocysteine (tHcy) was examined in 96 individuals over a 1-yr period. Blood tHcy concentrations varied from 7.1 mmol/L in the bottom quintile to 14.5 mmol/L in the top quintile. The mean tHcy was 10.4 mmol/L, the between-person SD was 2.5 mmol/L, and the within-person SD was 0.93 mmol/L. There was little seasonal variation, and the reliability coefficient was 0.88. Mean tHcy concentrations were inversely related to mean plasma folate (r 5 20.36) and vitamin B12 (r 5 20.35) concentrations. Median tHcy concentrations were ;1 mmol/L higher in men than in women and in older (70 to 74 years) than in younger (65 to 69 years) individuals and higher in those with the TT and CT genotypes for the methylenetetrahydrofolate reductase polymorphism than in those with the CC genotype (10.7 and 10.6 vs 9.6 mmol/L). Epidemiological studies based on single tHcy measurements may underestimate the magnitude of any risk associations with disease by 10 –15%. Moderately increased concentrations of total homocysteine (tHcy) are a strong and independent risk factor for occlusive vascular disease [1–5]. A metaanalysis of the observational studies of tHcy and vascular disease indicated that a prolonged 1 mmol/L lower tHcy concentration was associated with a 10% reduction in risk of coronary heart disease throughout the range of 10 –15 mmol/L [5]. tHcy is also a sensitive indicator of folate and
1 Clinical Trial Service Unit and Epidemiological Studies Unit, Radcliffe Infirmary, Oxford, OX2 6HE, UK. 2 Department of Clinical Gerontology, Addenbrooke’s Hospital, Cambridge, CB2 2QQ, UK. 3 Department of Pharmacology, University of Bergen, Armauer Hansens Hus, 5021 Bergen, Norway. 4 Medical Statistics Unit, London School of Hygiene & Tropical Medicine, Keppel St., London, UK. * Author for correspondence. Fax (44)1865-558817; e-mail robert.clarke@ ctsu.ox.ac.uk. Received June 24, 1997; revision accepted September 19, 1997.
102
Clinical Chemistry 44, No. 1, 1998
Materials and Methods study population One hundred healthy volunteers, ages 65 to 74 years and living in the community, were recruited from a general practice in Cambridge by postal invitation after random selection from age and sex registers [24 –27]. Individuals were visited in their homes at 2-month intervals from January 1991 to February 1992. The individuals were not fasting, but all visits were planned to occur at the same time of the day and on the same day of the week to minimize circadian and weekday variation in the results. This goal was achieved in 94% of the visits. Samples were available from 96 individuals for this study, which had local ethics committee approval.
information collection and blood sampling Information was collected on medical history, smoking habits, use of vitamin supplements, and other aspects of health and life-style by means of questionnaires. A trained observer recorded blood pressure with a random zero sphygmomanometer after the individual had been seated for ;1 h. At the end of each of the seven visits, 4.5 mL of blood was withdrawn from an antecubital vein into an evacuated collection tube containing 0.5 mL of 0.106 mol/L trisodium citrate, pH 7.6 – 8.6 (S-Monovette, Sarstedt). All blood samples were immediately transported in an insulated box back to the laboratory. The temperature during transport was ;20 °C. The transport time was in the range of 0.5–2 h, and the blood samples were immediately centrifuged on arrival. All aliquots of plasma used for tHcy analysis were stored at 270 °C.
103
ence” or minimal real change detectable with 95% confidence in two consecutive measurements was determined as the product of 2.77 3 (within-person SD) [18]. The magnitude of regression dilution associated with a single measurement of tHcy was estimated by using the inverse of the reliability coefficients [19 –21] and by determining the ratio of the ranges between the top and bottom quintiles at baseline and at remeasurement [19].
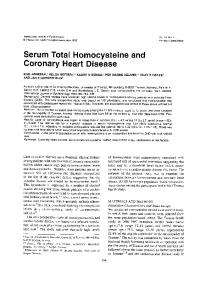
Results between- and within-person variability The median and mean tHcy concentrations at enrollment were 10.1 mmol/L and 10.4 (SD 2.7) mmol/L, respectively, and the median tHcy was ;1 mmol/L higher in men than in women (10.6 vs 9.5 mmol/L), higher in older (ages 70 years or greater) than in younger (,70 years) individuals (10.7 vs 9.8 mmol/L), and higher in those with the TT and CT genotypes compared with the CC genotype for the MTHFR polymorphism (10.7, 10.6, and 9.6 mmol/L, respectively). We compared the distributions of tHcy, total cholesterol (Fig. 1), and blood pressure (data not shown) in 96 individuals at enrollment with the average values of seven measurements. On remeasurement, the values for total cholesterol and systolic blood pressure were distributed closer to the mean. The mean of seven measurements of tHcy in 96 individuals was 10.4 mmol/L; the between-person SD was 2.5 mmol/L, and the between-person CV was 24% (Table 1). The within-person SD for tHcy was 0.93 mmol/L (CV 5 9%). The unad-
biochemical measurements Serum total cholesterol was measured by standard laboratory techniques [27]. Plasma total tHcy concentrations were measured by using an HPLC method and fluorescence detection [6]. The analytical variability was assessed by measuring a single control plasma sample on 16 occasions (concurrently during the analysis of the study samples), yielding an analytical CV of 1.46%. Plasma folate and vitamin B12 were measured by radioimmunoassays. The remaining DNA in plasma was extracted by adsorption to silica (QIAamp kit, Qiagen) and used for MTHFR genotyping [14] according to a procedure involving multiinjection capillary electrophoresis and laserinduced fluorescence detection [28].
statistical methods “Multilevel” regression analysis (MLN-Software, London University Education Institute) was used to determine the within- and between-person variance and the reliability coefficients (between-person variance as a proportion of the total variance), calculated as 1/[1 1 (within-person SD/between-person SD)2] before and after adjusting for age, sex, seasonality, MTHFR genotypes, and blood concentrations of folate and vitamin B12. The “critical differ-
Fig. 1. Distribution of baseline values (top panels) and the average values for seven consecutive visits (bottom panels) for plasma total homocysteine (left panels) and serum total cholesterol (right panels).
104
Clarke et al.: Variability of plasma homocysteine measurement
Table 1. Variability in total homocysteine, total cholesterol, and systolic blood pressure in 96 individuals.a Baseline values Mean SD Median 25th–75th percentile Range All seven values Mean Between-person SD Within-person SD Within/between-person SD Reliability coefficientb Between-person CV, % Within-person CV, % Correction factor for regression dilutionc After adjustment for seasonality Difference in mean values (January vs July) Reliability coefficient adjusted for seasonalityb Critical difference adjusted for seasonalityd Critical difference, % of mean
Plasma total homocysteine
Serum total cholesterol
Systolic blood pressure
10.4 2.7 10.1 8.1–12.1 5.8–18.5
6.4 1.1 6.4 5.7–7.1 3.5–9.7
162 22 160 145–180 109–211
10.4 2.5 0.93 0.37 0.88 24 9 1.14
6.3 1.0 0.42 0.42 0.85 16 7 1.18
150 20.3 12.1 0.60 0.74 14 8 1.35
0.32 0.88 2.5 24
20.35 0.86 1.1 17
219.6 0.79 28.9 19
Units are mmol/L for homocysteine, mmol/L for cholesterol, and mmHg for blood pressure. Reliability coefficient 5 1/[1 1 (within-person SD/between-person SD)2]. c Correction factor for regression dilution bias 5 1/reliability coefficient. d Critical difference 5 2.77 3 (within-person SD). a b
justed critical difference between two consecutive tHcy values after a 2-month interval at P ,0.05 was 2.6 mmol/L. By contrast, the critical difference for two consecutive measurements on the same sample was 0.5 mmol/L. The reliability coefficient for a single reading of tHcy was 0.88, which compared favorably with 0.85 for total cholesterol and 0.74 for systolic blood pressure. There was no difference in the reliability coefficients among subgroups classified by sex, age, and MTHFR genotype (data not shown).
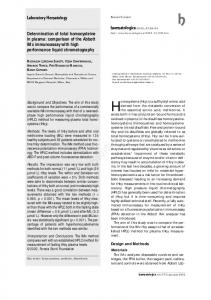
seasonal variation Plasma tHcy concentrations were stable throughout the year with little seasonal variation (Fig. 2). The median tHcy was 0.32 mmol/L (3%) higher in summer compared with winter. The seasonal variations in total cholesterol and systolic blood pressure were larger, with a reduction of 5% in total cholesterol and 7% in systolic blood pressure in summer compared with winter. Mean folate concentrations of folate were 1.8 nmol/L higher in summer than in winter, but mean vitamin B12 concentrations did not vary with season (data not shown). After adjustment for seasonal variation, the reliability coefficient for tHcy was unchanged, but that for cholesterol and systolic blood pressure improved. The critical difference after adjustment for seasonality was 2.5 mmol/L for tHcy compared with 1.1 mmol/L for total cholesterol and 28.9 mmHg for systolic blood pressure.
determinants of thcy The average blood concentrations of tHcy were inversely related to the average blood concentrations of folate (r 5 20.36) and of vitamin B12 (r 5 20.35). Table 2 shows the estimated changes in tHcy concentrations for the specified differences in various determinants when analyzed separately as univariate regression coefficients or after adjustment for other variables as multivariate regression coefficients. Age was the strongest determinant of tHcy concentrations. A 10 nmol/L increase in folate concentrations was associated with a 0.8 mmol/L reduction in tHcy, and a 100 pmol/L increase in vitamin B12 was associated with a 1.1 mmol/L reduction in tHcy concentrations. The CT genotype for the MTHFR enzyme was associated with a 1.1 mmol/L increase in tHcy compared with the CC genotype; TT genotypes were too few to provide reliable estimates.
unexplained within- and between-person variation The between-person and within-person SDs were reduced from 2.50 and 0.93 mmol/L (unadjusted) to 2.16 and 0.87 mmol/L, respectively, after adjustment for differences in seasonality, age, sex, MTHFR genotype, and vitamin status. Vitamin status and to a lesser extent genotype, age, and sex caused the slight adjustment of between-person SD, whereas a small portion of within-person SD was accounted for by seasonality and vitamin status. Only a
105
Clinical Chemistry 44, No. 1, 1998
in the bottom quintile to 14.5 mmol/L in the top quintile of the population at baseline (Table 3). Within individuals, tHcy concentrations also varied so that the absolute difference between the top and bottom quintiles (as defined at baseline) declined from 7.4 mmol/L at baseline to 6.1 mmol/L on remeasurement 1 year later; the correlation between baseline measurements and those measured 1 year later was 0.86, which was similar to the overall reliability coefficient of 0.88.
magnitude of regression dilution associated with a single measurement The reliability coefficients derived from all seven measurements provided an estimate of regression dilution. The correction factor (inverse of the reliability coefficient) for regression dilution of 1.14 (1/0.88) for tHcy compared favorably with 1.18 for total cholesterol and 1.35 for systolic blood pressure (Table 1). The correction factors for regression dilution derived from the ratio of the ranges between the top and bottom quintiles of measurements taken 1 year apart were 1.21 for tHcy, 1.19 for total cholesterol, and 1.56 for systolic blood pressure [19].
Discussion Fig. 2. Seasonal variation in plasma tHcy (top panel) and serum total cholesterol (bottom panel). Values at each visit are the medians of n 5 96, and the columns represent the interquartile range.
small fraction of the within-person variation in tHcy was explained by analytical variability, and a substantial component of both the within- and between-person variability remained unexplained after the factors studied had been allowed for.
variability over time There were substantial differences in tHcy values between individuals, with mean values ranging from 7.1 mmol/L
The differences in tHcy concentrations within individuals were small (SD ;1 mmol/L), whereas substantial differences were observed between individuals in this population. An individual’s plasma tHcy was relatively constant over a 1-year period, with little seasonal variation. The reliability coefficient for tHcy was 0.88, which compared favorably with that for total cholesterol and was somewhat higher than that for systolic blood pressure. Moreover the reliability coefficients for tHcy observed in the present study were similar to the short-term reliability coefficient estimated by Garg et al. [18] of 0.94 over 4 weeks in 20 subjects but were higher than their estimate of 0.65 over 30 months in 9 subjects. The magnitude of regression dilution bias, whether estimated by an analysis of seven consecutive measure-
Table 2. Mean values of selected characteristics and estimated changes in plasma total homocysteine concentrations for specified differences. Regression coefficient (SE)
Age, years Sex, % male Cigarette smoking, % current smokers Plasma folate, nmol/L Plasma vitamin B12, pmol/L MTHFR genotype CC, % CT, % TT, % a b
Adjusted for seasonality. Adjusted for seasonality and all other variables.
Mean 6 SD or %
Specified change
Univariatea
Multivariateb
69 6 3 49 13 23 6 13 224 6 90
5-year increase Males vs females Current vs nonsmoker 10 nmol/L increase 100 pmol/L increase
0.99 (0.51) 0.95 (0.51) 20.11 (0.40) 20.75 (0.20) 21.09 (0.30)
1.05 (0.46) 0.46 (0.46) 20.16 (0.38) 20.63 (0.19) 20.79 (0.28)
1.10 (0.54) 0.41 (1.01)
0.87 (0.49) 0.29 (0.89)
55 38 7
CT vs CC TT vs CC
106
Clarke et al.: Variability of plasma homocysteine measurement
Table 3. Total homocysteine, total cholesterol, and systolic blood pressure at baseline and on remeasurement in 96 elderly. Month Baseline quintile
Total homocysteine, mmol/L I II III IV V Difference V 2 I Correlation with baseline Total cholesterol, mmol/L I II III IV V Difference V 2 I Correlation with baseline Systolic blood pressure, mmHg I II III IV V Difference V 2 I Correlation with baseline
0
2
4
6
8
10
12
7.1 8.6 10.1 11.6 14.5 7.4
7.3 8.5 10.3 11.6 13.6 6.5 0.90
7.4 8.4 10.1 11.8 13.4 6.0 0.90
7.9 8.9 10.8 11.8 14.1 6.2 0.91
8.0 8.8 10.5 11.5 14.1 6.1 0.88
7.3 8.5 10.0 11.3 13.5 6.2 0.86
7.2 8.6 9.7 11.2 13.4 6.1 0.86
4.9 5.9 6.4 7.0 8.1 3.2
5.0 6.2 6.1 6.7 7.8 2.8 0.81
4.9 6.0 6.2 6.6 7.3 2.4 0.81
4.8 5.9 6.0 6.5 7.3 2.5 0.76
4.9 5.9 6.3 6.7 7.5 2.6 0.77
5.0 6.1 6.2 6.8 7.5 2.5 0.80
5.0 6.3 6.5 6.9 7.7 2.7 0.77
132 137 150 161 174 42 0.76
129 136 147 158 176 47 0.73
120 132 144 152 168 48 0.70
124 138 147 159 166 42 0.68
124 139 146 159 172 48 0.73
132 140 152 163 171 39 0.69
132 149 162 177 193 61
ments or after a 1-year interval, suggests that a single reading of tHcy may underestimate the strength of any risk associations with disease by ;12% in this population. The magnitude of regression dilution associated with a single tHcy measurement was less than that for both total cholesterol and systolic blood pressure. The high reliability coefficients observed in this study for a single measurement reinforces the value of the tHcy determination in the diagnosis and follow-up in patients with suspected cobalamin or folate deficiency [7, 13]. The mean tHcy value of this elderly population was 1–2 mmol/L below, and between-subject variability was equal to, that observed for a Norwegian population of ages 65– 67 years [8]. Age, sex, vitamin status, and MTHFR genotypes were the main determinants of tHcy concentrations. The median tHcy concentrations were ;1 mmol/L higher in men than in women and in older than in younger individuals [8], and tHcy was inversely related to blood concentrations of folate and vitamin B12. Although there was a trend toward higher tHcy concentrations in individuals with the C677T mutation, the effect of this mutation was weaker than that observed in other studies [14, 15]. Both the lack of correlation between seasonal variations in serum folate with tHcy and the modest effect from the C677T mutation in this population may be due to high mean folate concentrations, which in turn may reflect the high overall socioeconomic distribution [9].
The blood samples were collected in the participant’s home and without immediate cooling because low temperature affects fibrinolytic assays. A time interval of 0.5–2 h passed before the blood cells were removed by centrifugation. Such sample handling probably caused an increase in tHcy by 0.5–1.5 mmol/L in our present study [6], but the low mean values show that the increase was modest. The effect of this in vitro phenomenon on variability is certainly related to the standardization of the sample processing because the homocysteine export rate in whole blood shows small interindividual variations under otherwise identical conditions [29]. The rigorous procedures recommended for tHcy measurement [6] may not be compatible with practical field conditions. Our data demonstrate that tHcy samples processed under such conditions yield reliable results when standardized procedures are used.
This study was supported by a grant (PG/96022) from the British Heart Foundation and by EU Commission Demonstration Project Contract no. BMH4-CT95-0505.
References 1. Arnesen E, Refsum H, Bønaa KH, Ueland PM, Førde OH, Nordrehaug JE. Serum total homocysteine and coronary heart disease. Int J Epidemiol 1995;24:704 –9. 2. Clarke R, Daly L, Robinson K, Naughten E, Cahalane S, Fowler B,
Clinical Chemistry 44, No. 1, 1998
3.
4.
5.
6.
7.
8.
9.
10.
11.
12.
13.
14.
15.
Graham I. Hyperhomocysteinemia: an independent risk factor for vascular disease. N Engl J Med 1991;324:1149 –55. Stampfer MJ, Malinow MR, Willett WC, Newcomer LM, Upson B, Ullmann D, Tishler PV, Hennekens CH. A prospective study of plasma homocyst(e)ine and risk of myocardial infarction in US physicians. JAMA 1992;268:877– 81. Perry IJ, Refsum H, Morris RW, Ebrahim SB, Ueland PM, Shaper AG. Prospective study of serum total homocysteine concentration and risk of stroke in middle aged men. Lancet 1995;346:1395– 8. Boushey CJ, Beresford SA, Omenn GS, Motulsky AG. A quantitative assessment of plasma homocysteine as a risk factor for vascular disease: probable benefits of increasing folic acid intakes. JAMA 1995;274:1049 –57. Ueland PM, Refsum H, Stabler SP, Malinow MR, Andersson A, Allen RH. Total homocysteine in plasma or serum: methods and clinical applications. Clin Chem 1993;39:1764 –79. Lindenbaum J, Healton EB, Savage DG, Brust JCM, Garrett TJ, Podell ER, et al. Neuropsychiatric disorders caused by cobalamin deficiency in the absence of anemia or macrocytosis. N Engl J Med 1988;318:1720 – 8. Nygård O, Vollset SE, Refsum H, Stensvold I, Tverdal A, Nordrehaug JE, et al. Total plasma homocysteine and cardiovascular risk profile. The Hordaland Homocysteine Study. JAMA 1995;274: 1526 –33. Selhub J, Jacques PF, Wilson PWF, Rush D, Rosenberg IH. Vitamin status and intake as primary determinants of homocysteinemia in an elderly population. JAMA 1993;270:2693– 8. Andersson A, Brattstro¨m L, Israelsson B, Israelsson A, Hamfeldt A, Hultberg B. Plasma homocysteine before and after methionine loading with regard to age, gender, and menopausal status. Eur J Clin Invest 1992;22:79 – 87. Naurath HJ, Joosten E, Riezler R, Stabler SP, Allen RH, Lindenbaum J. Effects of vitamin B12, folate and vitamin B6 supplements in elderly people with normal serum vitamin concentrations. Lancet 1995;346:85–9. Rasmussen K, Mo¨ller J, Lyngbak M, Pedersen AH, Dybkjaer L. Ageand gender-specific reference intervals for total homocysteine and methylmalonic acid in plasma before and after vitamin supplementation. Clin Chem 1996;42:630 – 6. Allen RH, Stabler SP, Savage DG, Lindenbaum J. Metabolic abnormalities in cobalamin (vitamin B12) and folate deficiency. FASEB J 1994;7:1344 –53. Frosst P, Blom HJ, Milos R, Goyette P, Sheppard CA, Matthews RG, et al. A candidate genetic risk factor for vascular disease: a common mutation in methylenetetrahydrofolate reductase. Nat Genet 1995;10:111–3. Guttormsen AB, Ueland P, Nesthus I, Nygård O, Schneede J, Vollset SE, Refsum H. Determinants and plasma responsiveness of intermediate hyperhomocysteinemia ($40 mmol/liter): the Hordaland Homocysteine Study. J Clin Invest 1996;98:2174 – 83.
107
16. Kang SS, Zhou J, Wong PWK, Kowalisyn J, Strokosh G. Intermediate homocysteinemia: a thermolabile variant of methylenetetrahydrofolate reductase. Am J Hum Genet 1988;43:414 –21. 17. Israelsson B, Brattstro¨m L, Refsum H. Homocysteine in frozen plasma samples: a short cut to establish hyperhomocysteinemia as a risk factor for arteriosclerosis. Scand J Clin Lab Invest 1993;53:465–9. 18. Garg UC, Zheng ZJ, Folsom AR, Moyer YS, Tsai MY, McGovern P, Eckfeldt JH. Short-term and long-term variability of plasma homocysteine measurement. Clin Chem 1997;43:141–5. 19. MacMahon S, Peto R, Cutler J, Collins R, Sorlie P, Neaton J, et al. Blood pressure, stroke and coronary heart disease; prolonged differences in blood pressure; prospective observational studies corrected for regression dilution bias. Lancet 1990;335:765–74. 20. Rosner B, Willett WC, Speigelman D. Correction of logistic regression relative risk estimates and confidence intervals for systematic within-person measurement error. Stats Med 1989;8:1051– 69. 21. Carroll RJ, Stefanski LA. Measurement error, instrumental variables and corrections for attenuation with applications for metaanalysis. Stat Med 1994;13:1265– 82. 22. Wickham C, O’Broin S, Kevany J. Seasonal variation in folate nutritional status. Ir J Med Sci 1983;152:295–9. 23. Jacques PF, Bostom AG, Williams RR, Ellison RC, Eckfeldt JH, Rosenberg IH, et al. Relation between folate status, a common mutation for methylenetetrahydrofolate reductase, and plasma homocysteine concentrations. Circulation 1996;93:7–9. 24. Khaw KT, Woodhouse P. Interrelation of vitamin C, infection, haemostatic factors and cardiovascular disease. Br Med J 1995; 310:1559 – 63. 25. Woodhouse P, Khaw KT, Plummer M. Seasonal variation in blood pressure in relation to temperature in elderly men and women. J Hypertens 1993;11:1267–74. 26. Woodhouse PR, Khaw KT, Meade TW, Stirling Y, Plummer M. Seasonal variation of plasma fibrinogen and factor VII activity in the elderly: winter infections and death from cardiovascular disease. Lancet 1994;343:435–9. 27. Woodhouse PR, Khaw KT. Seasonal variation of serum lipids in an elderly population. Age Ageing 1993;22:273– 8. 28. Ulvik A, Refsum H, Kluijtmans LAJ, Ueland PM. C677T mutation of methylenetetrahydrofolate reductase gene determined in human blood or plasma by multiple-injection capillary electrophoresis and laser-induced fluorescence detection. Clin Chem 1997;43:267– 72. 29. Refsum H, Guttormsen AB, Fiskerstrand T, Ueland PM. On the formation and fate of plasma homocysteine. In: Graham IM, Refsum H, Rosenberg IH, Ueland PM, eds. Homocysteine. From basic science to clinical medicine. Norwell, MA: Kluwer Publishers, 1997.