water Article
Variations on Soil Salinity and Sodicity and Its Driving Factors Analysis under Microtopography in Different Hydrological Conditions Fan Yang 1, *,† , Fenghua An 1,† , Hongyuan Ma 1 , Zhichun Wang 1, *, Xia Zhou 2 and Zhijun Liu 3 1 2 3
* †
Northeast Institute of Geography and Agroecology, Chinese Academy of Sciences, 4888 Shengbei Street, Changchun 130102, China;
[email protected] (F.A.);
[email protected] (H.M.) Department of Agricultural and Resource Economics, The University of Tennessee, Knoxville, TN 37996, USA;
[email protected] Dynamic Solutions, LLC, Knoxville, TN 37919, USA;
[email protected] Correspondence:
[email protected] (F.Y.);
[email protected] (Z.W.); Tel.: +86-431-8554-2332 (F.Y.); +86-431-8554-2240 (Z.W.); Fax: +86-431-8554-2298 (F.Y. & Z.W.) These authors contributed equally to this work.
Academic Editor: Hongyan Li Received: 7 April 2016; Accepted: 23 May 2016; Published: 27 May 2016
Abstract: Over three million hectares of salt-affected soils characterized with high salinity and sodicity caused serious land degradation in Songnen Plain, northeast China. Soil salinity–sodicity heterogeneous distribution under microtopography is usually influenced by several environmental factors. The side direction movement of soil water driven by water from depression is the key factor that aggravates the soil salinization under microtopography in dry condition. In this study, the differences in surface soil salinity–sodicity (0–10 cm) between dry year and wet year were compared, and the relationship between soil salinity–sodicity and environment factors such as ground elevation, surface ponding time, surface ponding depth, and soil moisture at four soil layers (0–10, 10–30, 30–60, and 60–100 cm) were analyzed using redundancy analysis (RDA) and simple correlation analysis (Pearson analysis) for two different hydrological years. Analyzed soil salinity–sodicity parameters include soluble ions (Na+ , K+ , Ca2+ , Mg2+ , CO3 2´ , HCO3 ´ , Cl´ and SO4 2´ ), salt content (SC), electrical conductivity (EC), sodium adsorption ratio (SAR), and pH. Results showed that values of SAR, Cl´ , and SO4 2´ were significantly higher in dry year than in wet year, while Ca2+ , Mg2+ , K+ , and HCO3 ´ showed the opposite results. Values of Na+ , CO3 2´ , and EC were significantly higher at higher ground elevation gradient (20–40 cm) in dry year than wet year. Redundancy analysis indicated that spatial distributions and variations of salinity and sodicity in surface soil layer were related with environmental factors of ponding depth, ponding time and ground elevation in wet year, and they were related with ground elevation, ponding depth, ponding time, and soil moisture at 30–60 and 60–100 cm soil layer in dry year. Ponding depth and ground elevation rank first and second as the influential factors of the spatial distribution and variation of soil salinity–sodicity in wet year. However in dry year, primary and secondary influential factors are ground elevation and soil moisture at 60–100 cm soil layer. Keywords: saline-sodic soil; spatial distribution; environment factor; redundancy analysis; western Songnen Plain
1. Introduction Salt-affected area covers about 1 ˆ 109 ha in the world [1]. Soil salinization is an increasing environmental problem because of adverse effects of soil salinity and sodicity on soil properties and behavior [2,3]. Songnen Plain, northeast China, is one of three major saline-sodic soil distribution Water 2016, 8, 227; doi:10.3390/w8060227
www.mdpi.com/journal/water
Water 2016, 8, 227
2 of 13
regions in the world. The area of saline-sodic soil is about 2.57 ˆ 106 ha, approximately 22.62% of its total area [4,5]. The area of saline-sodic soil is increasing at an annual rate of 1.35 ˆ 104 ha. In some counties, the salinization land accounts for more than 20% of the total area and has been changed into wasteland [6]. Soil salinization has caused serious soil degradation, which negatively influences the economic development and decreased the yield of local crops. The mechanism of soil salinization and its development have been a great concern for researchers and growers in the arid or semiarid regions [5]. Saline-affected soil formation was correlated with critical depth of shallow groundwater (GW) level, except when controlled by arid climate [7]. Salinization occurred when GW depth was less than 2.0 m with salinity higher than 0.48 dS/m [8,9]. For the GW with lower salinity, the GW table should not be shallower than 1.5 m [10]. By research of the effect of shallow underground water on the formation process of salinity–sodicity soil in Songnen Plain, results indicate that the shallow ground water level has already exceeded the critical water level (2–3 m) [11,12]. However, when the groundwater table reached 5 m, the soil salinization still continued and aggravated [13,14], which is unexplainable from the viewpoint that soil salinization is solely caused by the rise of underground capillary water. One hypothesis about the evolution of saline-sodic soil in Songnen Plain is proposed that the saline sodic soil development is affected by human activities and climatic conditions. The influence of underground water on soil salinization may be weakened when soil salinization of Songnen Plain has developed to a certain degree. However, the existence of microtopography may cause the uneven movement of water and soil salt, which affects the spatial distribution of soil salinity–sodicity. In dry climate conditions, ponding water with soluble salts moves laterally from high soil moisture to low moisture soil along the moisture gradient because of evaporation. Hence, salt was left in surface soil layer at the middle and upper part of microtopography, which will aggravate the soil salinization in this area. The scholars have noticed the heterogeneous distribution of soil salinity–sodicity under microtopography and carried out a lot of studies, such as soil moisture transform and distribution characteristics of soil salt under microtopography [10,15] and analysis of spatial variation of soil salinity–sodicity [16–18]. It is shown that the spatial variation of soil salinity is mainly affected by the environmental factors (the topography, hydrological process and climate conditions). However, very little research has been done on the spatial variation of soil salinity–sodicity and their relation with environment factors in Songnen Plain [12,19]. In addition, regular statistical analysis and regression analysis are mainly employed. In order to examine the relationships between surface soil salinity–sodicity and environmental factors, ordination techniques are preferred approaches. In the numerous studies, two multivariate ordination techniques were primarily used in the soil–environment research [20–22]. One of the approaches consisted of e linear ordination methods such as principal components analysis (PCA) and redundancy analysis (RDA). These analyses are performed to determine the variation in the objective data within a narrow range, which could be attributed to linear coupling. The other approach used unimodal based methods of correspondence analysis (CA), detrended correspondence analysis (DCA), and canonical correspondence analysis (CCA) to determine the variation in the objective data over a wide range. DCA should be carried out on the soil salinity–sodicity data to determine the most appropriate method, with the gradient length as the criterion [23]. The results of DCA showed that linear methods (PCA and RDA) were preferable for the dataset considered in this study. Redundancy analysis was chosen because of the relation analysis between the two sets of variables (soil salinity–sodicity and environment factor), while principal component analysis (PCA) involved a single set of soil data. In order to gain a better understanding of the relationship between soil salinity–sodicity and environmental factors. RDA was used to analyze the relationships among soil salinity–sodicity, microtopography and hydrological elements. The objectives of this research were to: (a) compare the differences of surface soil salinity–sodicity between dry year and wet year; (b) analyze the correlations between environmental attributes and surface soil salinity–sodicity changes in different hydrological years; and (c) identify the key driving factors of spatial variations in surface soil salinity–sodicity in different hydrological years.
Water 2016, 8, 227
3 of 13
2. Material and Methods Water 2016, 8, 227
3 of 13
2.1. Study Area
2.1. Study Area
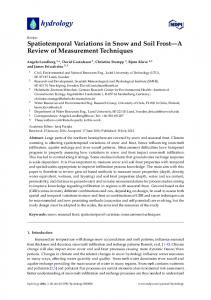
The experiment is carried out in Da’an Sodic Land Ecological Experiment Station of Northeast experiment is carried out in Da’an Sodic Land Ecological Experiment Station1). of Northeast Institute The of Geography and Agroecology, Chinese Academy of Sciences (Figure This region is 1 272 –123˝and 2 of east longitude 2 –45˝ 36 1 282 of1).north Institute of˝ 50 Geography Agroecology, Chinese Academy of1 58 Sciences (Figure This region is and located in 123 511 31 and 45˝ 35 latitude, located in 123°50′27″–123°51′31″ of east longitude and 45°35′58″–45°36′28″ of north latitude, and features temperate continental monsoon climate with an average annual precipitation of 413.7 mm features temperate continental monsoon climate with an average annual precipitation of 413.7 mm and an average annual evaporation of 1696.9 mm. The experiment station is surrounded by low flood and an average annual evaporation of 1696.9 mm. The experiment station is surrounded by low flood plain for Nenjiang ancient channel. The land surface is featureless and gently undulating, with the plain for Nenjiang ancient channel. The land surface is featureless and gently undulating, with the alternate distribution of small mounds and coexistenceofofdifferent different level of alternate distribution of small mounds anddepressions. depressions. The The complex complex coexistence level soil salinity–sodicity is the common characteristics in Songnen Plain, northeast China [24]. of soil salinity–sodicity is the common characteristics in Songnen Plain, northeast China [24].
Figure 1. Location of Da’an Sodic Land Experimental Station. Figure 1. Location of Da’an Sodic Land Experimental Station.
2.2. Field and Laboratory Analysis
2.2. Field and Laboratory Analysis
A representative saline-sodic area measuring 100 m × 100 m was selected with the saline-sodic A representative saline-sodic area measuring 100 m ˆ 100 was selected the saline-sodic soil complex of different soil salinity–sodicity levels. A ridge was m constructed alongwith the boundary of soil complex different salinity–sodicity levels. A ridge was the boundary of the area inofcase surface soil runoff entered the area after rainfall events. Theconstructed ridge was 36along cm high and 40 cm wide. experiment area was divided into 10 m × 10rainfall m grid squares, gridswas were36randomly the area inThe case surface runoff entered the area after events. and The40 ridge cm high and selected sampling pointsarea (Figure The land themarea is squares, gently undulating with were 40 cm wide. as The experiment was2). divided intosurface 10 m in ˆ 10 grid and 40 grids microtopography of coexistence of mounds and depressions. The maximum difference in elevation randomly selected as sampling points (Figure 2). The land surface in the area is gently undulating with
Water 2016, 8, 227
4 of 13
microtopography of coexistence of mounds and depressions. The maximum difference in elevation Water 2016, 8, 227 4 of 13 is about 36 cm. The grids with the highest elevation (such as sampling points of No. 2, No. 3, No. 4 and No. 21) are located in thewith middle bottom (Figure(such 2). The grids having the elevation is about 36 cm. The grids the highest elevation as sampling points of lowest No. 2, No. 3, No. 4(such and No. points 21) are located middle bottom (Figure The lowest elevation as sampling of No. in 33,the No. 34, No. 36, No. 37, 2). No. 39grids and having No. 40)the are located in the(such top right as(Figure sampling of experiment No. 33, No. 34, No. 36, naturally No. 37, No.saline-sodic 39 and No. 40) arewithout located tillage in the top right corner 2).points Soil of area was soils and grazing corner (Figure 2). Soil of experiment area was naturally saline-sodic soils without tillage and grazing disturbances. The plant communities in this area mainly include Phragmitesaustralis, Chlorisvirgata, disturbances. plant communitiesTypically, in this area mainly include Phragmitesaustralis, Chlorisvirgata, Suaedaglauca and The Puccinelliatenuiflora. Suaedaglauca is distributed in the highest elevation Suaedaglauca and Puccinelliatenuiflora. Typically, Suaedaglauca is distributed in the highest elevation area (mounds), and Phragmitesaustralis is found in the lowest elevation area (depressions). The soil area (mounds), and Phragmitesaustralis is found in the lowest elevation area (depressions). The soil 3. type is loam soil by USDA textural classification triangle. Dry bulk density ranged 1.49 to 1.67 g/cm type is loam soil by USDA textural classification triangle. Dry bulk density ranged 1.49 to 1.67 g/cm3. Shallow groundwater level is lower shallowgroundwater groundwater high values of TDS Shallow groundwater level is lowerthan than55m. m. The The shallow hashas thethe high values of TDS + 2+ , (0.2%–0.4%), and and pH pH ranges from 7.27.2 toto7.9. ofthe theshallow shallow groundwater (0.2%–0.4%), ranges from 7.9.The Themain main ions ions of groundwater are are Na+Na , Mg,2+Mg , ´ ´ HCOHCO Cl Cl. −. 3− and 3 and
Figure 2. Distribution measuring points points and in in experiment Site.Site. Figure 2. Distribution ofofmeasuring andrelative relativeheight height experiment
Experimental data were obtained in 2005 (wet year) and 2007 (dry year). The experiment lasts
Experimental data in 2005 (wet year) 2007ponding (dry year). experiment lasts for for 5 months for eachwere year,obtained from 1 May to 1 October. Theand surface time The and surface ponding 5 months each year, from 1 May to 1 for October. Theperiod, surfaceand ponding timeafter andthe surface depthfor were observed every five days no-rainfall every day rainfallponding event. Atdepth end of May, July and September, the soil moistures wereevery measured, and the moistures is the were the observed every five days for no-rainfall period, and day after thesoil rainfall event. At the mean value of three observations. Soil moistures were observed at four depths of soil layers: 0–10, end of May, July and September, the soil moistures were measured, and the soil moistures is the mean 30–60, and 60–100 cm. elevation measured DSN232 balance value10–30, of three observations. SoilGround moistures werewas observed at by four depths of soillevel. layers: 0–10, 10–30, At the end of September, soil samples were collected at soil depth of 0–10 cm at these 40 sampling 30–60, and 60–100 cm. Ground elevation was measured by DSN232 balance level. points for laboratory analysis of pH, EC, Na+, K+, Ca2+, Mg2+, CO32−, HCO3−, Cl−, and SO42−. All soil At the end of September, soil samples were collected at soil depth of 0–10 cm at these 40 sampling samples were air-dried and then passed a+1-mm round-hole sieve for chemical analyses. Soluble ´ .salt pointsestimates for laboratory analysis of pH, EC, Na , K+ , Ca2+ , Mg2+ , CO 2´ , HCO ´ , Cl´ , and SO4 2using All soil were based on soil: water 1:5 extracts. The pH and EC of3the extracts3 were determined samples and then meter, passedrespectively. a 1-mm round-hole sieve for 2+, and MgSoluble 2+ were salt a pHwere meterair-dried and a conductivity The concentration ofchemical Na+, K+, Caanalyses. 2− estimates were based on soil: water 1:5 extracts. The pH and EC of the extracts were determined determined by atomic absorption spectrometry (GBC-906AAS). Anion concentrations (CO3 , HCO3−,using 2+ , and −Mg2+ −, andand a pHCl meter meter, respectively. The concentration of Naof+ ,CO K+3,2−Ca SO42−a) conductivity were determined by standard methods [25]. The concentration and HCO3 − determined by neutral titration spectrometry method. The concentration of ClAnion was determined by silver were were determined by atomic absorption (GBC-906AAS). concentrations (CO3 2´ , 2− ´ ´ 2 ´ and the concentration of SOmethods 4 was determined by barium sulfate HCOnitrate , and SOmethod, ) were determined by standard [25]. The concentration of CO3 2´ 3 , Cl titration 4 ´ ´ turbidimetric method. Sodium adsorption ratio (SAR) was calculated by the following equation and HCO 3 were determined by neutral titration method. The concentration of Cl was determined where the concentrations of soluble cations are expressed in mmol c L−1 [26]. 2 ´ by silver nitrate titration method, and the concentration of SO4 was determined by barium sulfate turbidimetric method. Sodium adsorption ratio (SAR) was calculated by the following equation where the concentrations of soluble cations are expressed in mmolc L´1 [26].
Water 2016, 8, 227
5 of 13
rNa` s SAR “ a prCa2` s ` rMg2` sq{2
(1)
2.3. Redundancy Analysis RDA computation was performed using CANOCO for Windows 4.5 [27]. In the RDA computations, the correlation matrix option was selected, and scaling was conducted on a correlation bi-plot. In each analysis, step-wise forward selection was used to reduce the environmental variables to those most correlated with the axes. The significance of each environmental variable was tested using 499 unrestricted Monte Carlo permutations. For each analysis, the variance explanation of each environmental variable (marginal effect), and their additional variance explained when included in the model (conditional effect) [27] were also provided. The redundancy analysis (RDA) method is capable of presenting the research objects ordination and environment factors ordination in one diagram, and the relationships can be directly observed between them. The research objects are represented by the dotted arrow, the solid arrow represents the environment factors, and the quadrant that the arrow lies in indicates positive and negative correlations between environment factors (research objects) and ordination axes. The length of solid arrow connecting line means correlation between an environment factor and research object distribution, i.e., the longer line indicates that the environment factor has more influences on the distribution of research object. The angle between two arrows means the correlation between two environment factors (research objects), i.e., the smaller angle determines greater relevance. The angle between the arrow and ordination axis means the correlation between an environment factor (research objects) and ordination axis [23]. In this study, research objectives are soil ions (Na+ , Ca2+ , Mg2+ , K+ , CO3 2´ , HCO3 ´ , SO4 2´ and Cl´ ), soil salt content (SC), electrical conductivity (EC), sodium adsorption ratio (SAR), and pH. Considered environmental factors include surface ponding time (d), surface ponding depth (h), soil moistures in different soil layers (W0–10 , W10–30 , W30–60 , and W60–100 ), and ground elevation (H). 3. Results and Analysis 3.1. Rainfall during Different Hydrological Years In this experiment, two years data were selected to analyze correlation between surface soil salinity–sodicity and environment factors under dry and wet conditions. The 50-year (1951–2009) average rainfall during May to October in the study area is approximately 350.7 mm. Year 2005, with rainfall of 455.9 mm during May to October, was selected to represent the wet condition. Year 2007 was selected to represent the dry condition with the rainfall of 224.5 mm during May to October (Figure 3). 3.2. Comparison of Surface Soil Salinity–Sodicity Parameters between Wet and Dry Years The descriptive statistics of soil ion contents and associated properties at the soil layer (0–10 cm) at these 40 measurement points are given in Table 1. The content of Na+ was significantly higher than other cations with a mean of 809 mg/kg in wet year (2005) and 1238 mg/kg in dry year (2007) (p < 0.05), and the content of HCO3 ´ was significantly higher than other anions with a mean of 3369 mg/kg (2005) and 1583 mg/kg (2007), respectively (p < 0.05) (Table 1). The mean pH value in 2005 and 2007 were 9.51, and 9.48, respectively. Soil alkalinity is associated with the presence of sodium carbonates (Na2 CO3 ) or sodium bicarbonate (NaHCO3 ) in the soil, so the extracts were alkaline or strongly alkaline. Variation coefficient (CV) was the most important factor in describing the distribution and variability of soil property. Spatial variation can be divided into three categories: high spatial variation (CV > 1), moderate spatial variation (0.1 < CV < 1), and low spatial variation (CV < 0.1) [28]. Experimental results indicated soil soluble salts and their chemical properties displayed high and moderate spatial variations except the pH. The calculated coefficients of variation for soil ion ranged
Water 2016, 8, 227
6 of 13
from 34% to 203%. CV value for EC, SAR, and SC are from 74% to 197%. CV values of Na+ , CO3 2´ , SO4 2´ , SAR and EC were relatively higher under dry weather condition (2007) than wet weather condition (2005) (Table 1). Table 1. Descriptive statistics on soil ions and salinity parameters in 2005 and 2007. Chemical Property
Year
Number of Points
Minimum
Maximum
Mean
Standard Deviation
Coefficient of Variation
EC (µs¨ cm´1 )
2005 2007
40 40
82.8 123
2710 4730
392 ˘ 63.2a 660 ˘ 145.4a
400 920
1.02 1.39
pH
2005 2007
40 40
7.87 8.25
10.7 10.6
9.51 ˘ 0.13a 9.48 ˘ 0.11a
0.81 0.69
0.09 0.07
SAR
2005 2007
40 40
3.09 5.55
86.85 305.89
10.61 ˘ 2.0a 35.92 ˘ 11.2b
12.59 70.87
1.19 1.97
SC (mg/kg)
2005 2007
40 40
587.7 873.8
13,616 22,826
5212 ˘ 606a 4069 ˘ 807a
3833 5105
1.25 0.74
Cation content (mg/kg) Na+
2005 2007
40 40
83.6 161.5
5062 8499
809 ˘ 123a 1238 ˘ 312a
781 1976
0.96 1.60
K+
2005 2007
40 40
4.94 3.46
65.6 17.8
27.5 ˘ 3.1a 8.89 ˘ 0.49b
19.3 3.09
0.70 0.34
Mg2+
2005 2007
40 40
7.76 0.51
620 59.9
108 ˘ 19.6a 13.4 ˘ 1.78b
124 11.3
1.14 0.84
Ca2+
2005 2007
40 40
42.4 44
1515 571
501 ˘ 71.4a 130 ˘ 16.9b
451 107
0.90 0.81
Anion content (mg/kg) CO3 2´
2005 2007
40 40
0.0 0.0
1386 3240
189 ˘ 62.9a 368 ˘ 118a
258 748
1.37 2.03
HCO3 ´
2005 2007
40 40
366 439.2
9699 6881
3369 ˘ 408a 1583 ˘ 237b
2581 1500
0.77 0.95
Cl´
2005 2007
40 40
71 142
1793 3186
198 ˘ 41.9a 543 ˘ 127b
265 805
1.33 1.48
SO4 2´
2005 2007
40 40
0.0 34.76
36.5 951
9.14 ˘ 1.07a 183 ˘ 32.4b
6.78 205
0.74 1.12
Note: EC is electrical conductivity; SC is soil salinity content; SAR is sodium adsorption ratio; Means followed by the same letters within each column (lower case letters) are not significantly different at 0.05 level.
Parameter values of SAR, Cl´ , and SO4 2´ were significantly higher in dry year (2007) than in wet year (2005) (p < 0.05), while Ca2+ , Mg2+ , K+ , and HCO3 ´ showed the opposite results (Table 1). There were no significant differences in parameter values in EC, SC, Na+ , and CO3 2´ between these two years. Because of high CV values for these parameters (CV > 1), soil salinity–sodicity in different ground elevation may be different under microtopography [10,15]. To further evaluate the impact of ground elevation gradient on these soil salinity–sodicity parameters (EC, SC, Na+ , and CO3 2´ ) between dry and wet weather conditions, ground elevation was divided into three gradients: 0–10, 10–20, and 20–40 cm. Results of comparison of these parameter values between dry and wet years at each ground elevation gradient are given in Table 2. Ground elevation had significant impact on these soil salinity–sodicity parameters (Na+ , CO3 2´ , EC, and SC) (Table 2). Parameter values of Na+ , CO3 2´ , SC, and EC showed significant differences between dry and wet years only at higher ground elevation (20–40 cm): values of Na+ , CO3 2´ , SC, and EC were significantly higher in dry year (2007) than wet year (2005) (Table 2). While parameter values of SC were significantly lower in dry year (2007) than the wet year (2005) at middle and lower ground elevation gradients (10–20 cm and 0–10 cm). Thus, high evaporation and low rainfall can increase soil salinization in soil surface layer (0–10 cm), especially at higher ground elevation gradient in dry climate condition.
Water 2016, 8, 227
7 of 13
Table 2. Mean values of soil ions and index of salinity in different ground elevation. Ground Elevation (cm)
Year
Na+ mg/kg
CO3 2´ mg/kg
EC µs/cm
pH
SC mg/kg
0–10
2005 2007
594 ˘ 70a 496 ˘ 275a
103 ˘ 30a 90 ˘ 138a
286 ˘ 23a 316 ˘ 35a
9.18 ˘ 0.12a 9.18 ˘ 0.12a
4444 ˘ 3675a 2044 ˘ 968b
10–20
2005 2007
844 ˘ 102a 1013 ˘ 184a
238 ˘ 178a 263 ˘ 215a
397 ˘ 144a 617 ˘ 432a
9.8 ˘ 0.22a 9.7 ˘ 0.14a
6227 ˘ 3752a 3550 ˘ 1874b
20–40
2005 2007
2219 ˘ 1433a 7797 ˘ 520b
660 ˘ 379a 2844 ˘ 310b
1200 ˘ 462a 3263 ˘ 766b
10.4 ˘ 0.15a 10.5 ˘ 0.04a
7324 ˘ 2952a 20,850 ˘ 1342b
Note: EC is electrical conductivity; SC is soil salinity content; Means followed by the same letters within each column (lower case letters) are not significantly different at 0.05 level.
3.3. Relationship between Surface Soil Salinity–Sodicity and Environment Factors The RDA was used to analyze the relationship between surface soil salinity–sodicity and environmental factors based on the soil salinity–sodicity data matrix and an environmental data matrix. The connection between soil salinity–sodicity of the sample plots and the measured environmental factors in the study area as revealed by RDA are shown in Table 3. The results showed that 51.6% of soil salinity–sodicity spatial distribution was explained by these seven environment variables (sum of all eigenvalues is 1.0; sum of all canonical eigenvalues is 0.516) during the wet year, whereas 68.8% was explained during the dry year (sum of all eigenvalues is 1.0; sum of all canonical eigenvalues is 0.688). In addition, the cumulative variance explained for the first two ordination axes accounts for 100% of total cumulative variance. The research objects, environmental correlations, are higher for the first canonical axes, explaining 94.6% and 99.8% of the total cumulative variance in the wet and dry year, respectively (Table 3). Hence, these seven environment factors selected may, to a large extent, explain the spatial distribution of soil salinity–sodicity, by the first two ordination axes during different hydrological years. Through the above analysis, it is evident that the two ordination axes can describe the spatial distribution of the soil salinity–sodicity. These seven environment factors are able to explain the distribution characteristics of the surface soil salinity–sodicity by the first ordination axes, especially under dry weather conditions. Table 3. Intra-set correlations of the environmental variables, eigenvalue, and cumulative percentage variance and species-environment correlation coefficients for the first four axes of RDA. Wet Year (2005)
Dry Year (2007)
AX1
AX2
AX3
AX4
AX1
AX2
AX3
AX4
Eigenvalue
0.48
0.036
0.000
0.000
0.687
0.001
0.000
0.000
Species-environment correlation
0.695
0.771
0.324
0.153
0.835
0.429
0.310
0.249
Cumulative percentage variance (%)
94.6
100
100
100
99.8
100
100
100
Ground elevation (H)
0.4339 *
0.5213 **
´0.1001
0.0029
0.8092 **
´0.0433
´0.0349
´0.0243
W0–10
´0.0972
´0.2798
0.1884
´0.0888
´0.2937
0.0064
´0.1147
0.2058
W10–30
´0.2478
´0.0513
0.0897
´0.0941
´0.2904
´0.0334
´0.0757
0.0922
W30–60
´0.2424
´0.1314
´0.0242
´0.0808
´0.3866 *
´0.1747
0.1645
0.0853
W60–100
´0.2706
0.1714
0.1879
´0.0422
´0.3564 *
´0.0190
0.0291
0.0222
Ponding depth (h)
´0.5281 **
´0.0651
0.0825
´0.0136
´0.5032 **
0.2217
0.1108
0.1025
Ponding time (d)
´0.4864 **
´0.1155
0.1106
´0.0009
´0.5532 **
0.3312
0.0830
0.0852
Notes: * Correlation significant at the 0.05 level; ** Correlation significant at the 0.01 level. W0–10 , W10–30 , W30–60 and W60–100 are the soil moistures at 0–10, 10–30, 30–60, and 60–100 cm, respectively.
Water 2016, 8, 227
8 of 13
Monte Carlo permutations (499 iterations) were performed to test for significant relationship between soil salinity–sodicity data and the canonical axes. Results indicated that all canonical axes were significant (p = 0.002). From the intra-set correlations of the environmental factors with the axes of the RDA shown in Table 3, it can be seen that the selected environmental factors were mainly correlated with the first axis. During the wet year, there was significant relationship between environmental factors (ponding depth, ponding time and ground elevation) and the first axis (r = ´0.5281, ´0.4864 and 0.4339, respectively) (p < 0.05) while soil moistures at all four soil layers showed no significant relationship with the first axis (Table 3). Under wet year, ground elevation showed positive relationship with both the first and second axes (Table 3). The results Water 2016,significant 8, 227 8 of 13 Water 2016, 8, 227 8 of 13 showed surface ponding and microtopography were key factors, which affect distribution and variation variation surface soil in year. During year, parameters of surfaceof soil salinity–sodicity in wet year. During year,dry all environmental parameters showed variation of surface soil salinity–sodicity salinity–sodicity in wet wet year.dry During dry year, all all environmental environmental parameters showed significant relationship with the first axis except soils moistures at the upper layer (W 0–1010–30 and) significant relationship with the first axis except soils moistures at the upper layer (W and showed significant relationship with the first axis except soils moistures at the upper 0–10 layer (WW 0–10 and W 10–30) 3), (Table 3), which has also been revealed by the RDA ordination biplots (Figures 3 and (Table which has also been revealed by the RDA ordination biplots (Figures 3 and 4). Therefore, W10–30) (Table 3), which has also been revealed by the RDA ordination biplots (Figures 3 and 4). 4). Therefore, surface ponding and in are microtopography, surface ponding soil moisture in deep soil layersoil arelayer the significant factors Therefore, microtopography, microtopography, surfaceand ponding and soil soil moisture moisture in deep deep soil layer are the the significant significant factors the of and in soil during dry affecting the distribution of salinity and sodicity in the soil during dry the year. factors affecting affecting the distribution distribution of salinity salinity and sodicity sodicity in the the soil the during the dry year. year.
Figure Figure 3. 3. Rainfall Rainfall Regulations Regulations during during Different Different Hydrological Hydrological Years. Figure 3. Rainfall Regulations during Different Hydrological Years. Years.
Figure 4. RDA 2D Ordination Diagram for Soil Salinization Figure Salinization and and Environment Environment Factors Factors in in wet wet year. year. Figure 4. 4. RDA RDA 2D 2D Ordination Ordination Diagram Diagram for for Soil Soil Salinization and Environment Factors in wet year.
The The relationship relationship between between parameters parameters of of soil soil salinity–sodicity salinity–sodicity and and environment environment variations variations were were The relationship between parameters ofanalysis soil salinity–sodicity and environment variations analyzed using RDA and Pearson correlation method. During the wet year, analyzed using RDA and Pearson correlation analysis method. During the wet year, soil soil salinity– salinity– were analyzed using RDA and Pearson correlation analysis method. During the wet year, soil + 2− −, EC, SAR, sodicity −, EC, SAR, pH, sodicity parameters parameters (Na (Na+,, CO CO332−,, Cl Cl pH, and and SC) SC) were were all all positively positively correlated correlated with with ground ground + 2 ´ ´ salinity–sodicity parameters (Na , COsalinity–sodicity , Cl , EC, SAR, pH, and SC) positively correlated +were 2+all −, HCO − 3 elevation (Table 4 and Figure 4). Soil parameters (Na , Ca , CO 32− , Cl + 2+ 2− − elevation (Table 4 and Figure 4). Soil salinity–sodicity parameters (Na , Ca , CO3 , Cl , HCO33−,, EC, EC, pH, pH, and and SC) SC) were were negatively negatively correlated correlated with with ponding ponding time time and and ponding ponding depth depth (Table (Table 44 and and Figure Figure + 2− − 4). 4). There There is is an an increase increase in in soil soil ions ions (Na (Na+,, CO CO332−,, and and Cl Cl−)) at at the the upper upper part part of of microtopography microtopography − 2+ 2+ (mound). (mound). For For Ca Ca2+,, Mg Mg2+ and and HCO HCO33−,, they they are are richer richer at at the the middle middle part part of of microtopography microtopography than than upper upper and lower part. SAR and EC values increase with the increase of ground elevation. SAR and and lower part. SAR and EC values increase with the increase of ground elevation. SAR and EC EC were were the highest at upper part of microtopography (Table 2 and Figure 3). However, during the dry year,
Water 2016, 8, 227 Water 2016, 8, 227
9 of 13 9 of 13
microtopography in wet(Table year, 4and were with ponding, microtopography, with ground elevation andthey Figure 4).related Soil salinity–sodicity parameters (Na+ , and Ca2+moisture , CO3 2´ , ´ ´ at soil3 layer dryand year.SC) High values of surface soil salinity–sodicity are found the upper part Cldeep , HCO , EC,inpH, were negatively correlated with ponding time andatponding depth 2 ´ + ´ of microtopography (mound). Moderate values of salinity and sodicity are found at the middle part (Table 4 and Figure 4). There is an increase in soil ions (Na , CO3 , and Cl ) at the upper part ´ 2+ 2+ of microtopography.(mound). Mild value lower part of microtopography For of Ca salinity , Mg and and sodicity HCO3 , are theyobserved are richeratat the the middle part of of microtopography (depression). soil salinity–sodicity wasincrease severe with in dry than of wet year, microtopography than upper andSurface lower part. SAR and EC values theyear increase ground especially the and upper of the microtopography. elevation. at SAR ECpart were highest at upper part of microtopography (Table 2 and Figure 3). However, during the dry year, surface soil salinity–sodicity parameters (Na+ , CO3 2´ , Cl´ , HCO3 ´ , Table 4. Pearson correlation between salinity and sodicity and environmental SO4 2´ , EC, SAR, pH, and SC) wereanalysis all positively correlated with ground elevation (Table 4factors. and Figure 4). + ´ 2 ´ ´ 2 ´ + 2+ − 2− − 2− Year Variable Na Ca parameters CO3 HCO, 3CO3 Cl, Cl , HCO SO4 3 , SO SC4 SAR Surface soil salinity–sodicity (Na , pH,pHSC, andECSAR) were H 0.728 ** ** 0.688 ** 0.310 ** 0.558 ** 0.733 ** negatively correlated with0.203 ponding0.744 time and0.289 ponding depth, and were0.471 negatively correlated with0.629 soil** W30–60 −0.286 −0.140 −0.306 −0.200 −0.266 −0.057 −0.252 −0.256 −0.269 −0.214 moistures cm and−0.192 60–100 cm) 4 and Figure The* results W60–100(soil layer: 2005 −0.076 30–60 −0.291 −0.292(p < 0.05) 0.049 (Table 0.02 −0.262 5).−0.351 −0.031indicated 0.122 h −0.452 ** −0.429variations ** −0.530 **of soil −0.481 ** −0.324 * 0.12 −0.537soil ** layer −0.553 ** * −0.240 that spatial distribution and salinity–sodicity in surface were−0.399 related with d −0.458 ** −0.382 * −0.531 ** −0.430 ** −0.340 * 0.06 −0.498 ** −0.560 ** −0.413 ** −0.265 pondingHand microtopography in0.788 wet**year, and were related microtopography, 0.783 ** 0.199 0.805 ** they 0.763 ** 0.768 ** with 0.809ponding, ** 0.736 ** 0.625 ** 0.784 ** W30–60 * −0.337 * values −0.429 **of surface −0.407 ** soil −0.386 * −0.370 * −0.225 −0.396 and moisture at−0.394 deep* soil 0.064 layer in −0.352 dry year. High salinity–sodicity are found at * −0.346 * −0.113 −0.344 * −0.344 * −0.348 * −0.327 * −0.356 * −0.317 * −0.290 −0.362 * W60–100 2007 the upper part of microtopography (mound). Moderate values of salinity and sodicity are found at the h −0.461 ** −0.423 ** −0.454 ** −0.545 ** −0.460 ** −0.438 ** −0.505 ** −0.397 * −0.527 ** −0.458 ** middle part of −0.511 microtopography. Mild** value of** salinity sodicity are observed lower part** d ** −0.411 ** −0.508 −0.598 −0.501 **and−0.471 ** −0.555 ** −0.444 **at the −0.591 ** −0.504 of microtopography (depression). salinity–sodicity was severe in0.01 drylevel. yearW than wet Notes: * Correlation significant atSurface the 0.05soil level; ** Correlation significant at the 0–10, W 10– year, W60–100 are moistures at 0–10, 10–30, 30–60, and 60–100 cm, respectively. 30, W30–60 especially at and the upper partthe ofsoil microtopography.
Figure Figure 5. 5. RDA RDA 2D 2D Ordination Ordination Diagram Diagram for Soil Salinity and Environment Factors in dry year.
3.4. Key Table Factors Spatial Distribution of Surface Soiland Salinity–Sodicity 4. Affecting Pearson correlation analysis between salinity sodicity and environmental factors. It is Variable often of great interest to CO rank variables in their importance for determining 2´ environmental Year Na+ HCO3 ´ Cl´ SC pH EC SAR Ca2+ SO4 2´ 3 the surfaceHsoil salinity and sodicity distribution and variation. In the RDA analysis, Monte 0.728 ** 0.203 0.744 ** 0.289 0.688 ** 0.310 0.471 ** 0.558 ** 0.733 ** Carlo 0.629 **was W ´0.286the ´0.140 ´0.306 of ´0.200 ´0.266 ´0.057factor. ´0.252 ´0.256 ´0.269 30–60 used to W determine significance each environment The ´0.351 marginal effects´0.214 of all ´0.076 ´0.291 ´0.192 ´0.292 0.049 0.02 ´0.262 * ´0.031 0.122 2005 60–100 h ´0.452 ** ´0.429 ** ´0.481 ** ´0.324 ´0.537 ** ´0.553 ** ´0.399 ´0.240 environmental variables (i.e., **the ´0.530 independent effect of *each 0.12 environmental variable) and* conditional d ´0.458 ** ´0.382 * ´0.531 ** ´0.430 ** ´0.340 * 0.06 ´0.498 ** ´0.560 ** ´0.413 ** ´0.265 effects (i.e., the effect that each variable brings in addition to all the variables already selected) are H 0.783 ** 0.199 0.788 ** 0.805 ** 0.763 ** 0.768 ** 0.809 ** 0.736 ** 0.625 ** 0.784 ** ´0.394 0.064 ´0.352 * year, ´0.337ponding * ´0.429 depth ** ´0.407 ´0.386 * ´0.370 * ´0.225 ´0.396 * shown inWTables 4 and* 5. During the wet (h)**is the most important environmental 30–60 W60–100 ´0.346 * ´0.113 ´0.344 * ´0.344 * ´0.348 * ´0.327 * ´0.356 * ´0.317 * ´0.290 ´0.362 * 2007 factor, which explains 56% of the spatial variation in the total cumulative variance, and ground h ´0.461 ** ´0.423 ** ´0.454 ** ´0.545 ** ´0.460 ** ´0.438 ** ´0.505 ** ´0.397 * ´0.527 ** ´0.458 ** d ´0.511 ** ´0.411 ** ´0.508 ** ´0.598 ** ´0.501 ** ´0.471 ** ´0.555 ** ** ´0.591 ** ´0.504 ** elevation (H) is the second key environmental factor, which explains 16.7%´0.444 of the spatial variation in Notes: * Correlation significant at the 0.05 level; ** Correlation significant at the 0.01 level. W0–10 , W10–30 , W30–60 the total cumulative variance. Results indicated that ponding depth and ground elevation, are the and W60–100 are the soil moistures at 0–10, 10–30, 30–60, and 60–100 cm, respectively. most important environmental factors affecting the spatial distribution and variation of soil salinity– sodicity in the wet year.Spatial UnderDistribution dry year (2007), ground (H) and soil water content at 60– 3.4. Key Factors Affecting of Surface Soil elevation Salinity–Sodicity 100 cm soil layer (W60–100) are the key environmental factors (Table 6), which explain 83.8% of the It is often of in great to rank environmental variables in their for determining the spatial variation theinterest total cumulative variance together. During dryimportance year, ground elevation is the surface soil salinity and sodicity distribution and variation. In the RDA analysis, Monte Carlo was used most important environmental factor, which explains 67.4% of the spatial variation in the total to determine the significance of each factor. The marginal effects explains of all environmental cumulative variance, and W60–100 is theenvironment second key environmental factor, which 16.4% of the variables (i.e., thein independent effect of each environmental andprimary conditional (i.e., spatial variation the total cumulative variance. Hence, invariable) wet year, and effects secondary influence factors on the spatial distribution of surface soil salinity–sodicity are ponding and
Water 2016, 8, 227
10 of 13
the effect that each variable brings in addition to all the variables already selected) are shown in Tables 4 and 5. During the wet year, ponding depth (h) is the most important environmental factor, which explains 56% of the spatial variation in the total cumulative variance, and ground elevation (H) is the second key environmental factor, which explains 16.7% of the spatial variation in the total cumulative variance. Results indicated that ponding depth and ground elevation, are the most important environmental factors affecting the spatial distribution and variation of soil salinity–sodicity in the wet year. Under dry year (2007), ground elevation (H) and soil water content at 60–100 cm soil layer (W60–100 ) are the key environmental factors (Table 6), which explain 83.8% of the spatial variation in the total cumulative variance together. During dry year, ground elevation is the most important environmental factor, which explains 67.4% of the spatial variation in the total cumulative variance, and W60–100 is the second key environmental factor, which explains 16.4% of the spatial variation in the total cumulative variance. Hence, in wet year, primary and secondary influence factors on the spatial distribution of surface soil salinity–sodicity are ponding and microtopography, separately. But in dry year, primary and secondary influence factors are microtopography and soil moisture in deep soil layer, separately. Soil moisture in deep soil layer is mainly supplied by shallow groundwater. Therefore, distribution of soil salinity and sodicity is affected by both microtopography and shallow groundwater, but the effects of the shallow groundwater are relatively lower than that of microtopography. Results from this research are consistent with other studies. Yang et al. [29] found influence of capillary rise from shallow groundwater was less important due to aggravation of soil salinization. Luo et al. [10] reported that the ground elevation has more effects on soil salinization than that of underground water. Table 5. Ranking environmental variables in importance in 2005. Marginal Effects
Conditional Effects
Variable
Lam.
Variable
Lam.
P
F
h d H
0.27 0.23 0.19 0.07 0.06 0.06 0.01
h H W0–10 W60–100 d W10–30 W30–60
0.27 0.08 0.04 0.05 0.04 0.00 0.01
0.002 0.024 0.098 0.100 0.118 0.666 0.826
13.79 4.58 2.79 2.88 2.71 0.22 0.10
W60–100 W10–30 W30–60 W0–10
Notes: P = significance level of the effect, as obtained with a Monte Carlo permutation test under the null model with 499 random permutations. W0–10 , W10–30 , W30–60 and W60–100 are the soil moistures at 0–10, 10–30, 30–60, and 60–100 cm, respectively.
Table 6. Ranking environmental variables in importance in 2007. Marginal Effects
Conditional Effects
Variable
Lam.
Variable
Lam.
P
F
H d
0.35 0.25 0.15 0.13 0.09 0.08
H W60–100 h W30–60 d W0–10
0.35 0.10 0.02 0.01 0.00 0.00
0.002 0.049 0.106 0.650 0.742 0.960
19.27 8.68 2.69 0.21 0.17 0.03
W30–60 W60–100 W0–10 W10–30
Note: W0–10 , W10–30 , W30–60 and W60–100 are the soil moistures at 0–10, 10–30, 30–60, and 60–100 cm, respectively.
Microtopography affects hydrological processes in local scale, and affects the distribution and variations of surface soil salinity and sodicity, which in turn affects the movement of soil water and salts. Low level of soil salinity–sodicity was found to be located in the depressions. Similar results have been documented by Kilic et al. [30]. Level of soil salinity–sodicity was observed to increase with the increase of ground elevation. Soil salinity–sodicity is aggravated due to the increase of Na+ and
Water 2016, 8, 227
11 of 13
SAR. Soil tended to disperse due to the existence of excessive sodium. High sodicity degraded the soil physical properties, and caused soil compaction and slow internal drainage and the reduction of soil water storage and poor aeration [1,2,31]. The permeability of the upper soil is extremely low with saturated hydraulic conductivity less than 1 mm/day at the ground elevation of 10–40 cm [32]. Effective soil depth affected by rainfall and evapotranspiration was found not to exceed at 40 cm soil layer, and the shallow groundwater had slight effect on soil water contents above the depth of 80 cm soil layer [29]. Hence, the vertical movement of water (capillary rise and infiltration) is comparatively slow due to the aggravation of soil salts. Because of mild salinity and sodicity located in the depressions, soil physical properties were improved compared to the mound. In addition, owing to the difference in plant distribution, the infiltration capacity is higher in the depressions than in the mounds. Depressions were covered by Phragmitesaustralis due to seasonal waterlogging. Roots are intricately crossed and extended to 60 cm in the soil profile [33]. The advanced root system of Phragmitesaustralis can create more active soil pores, which in turn will increase the infiltration capacity [34]. Salts, derived from ponding and soil weathering reactions, accumulate in the surface of zones in the soil profile. This salinity fluctuation also changes with reason and rainfall [35]. In wet year, runoff with salt from mound flows into the depression due to of the excessive rainfall in rainy season. Because of higher infiltration capacity in the depressions, which can infiltrate a lot of salts into the deep soil or shallow groundwater to form desalination water layer. Thus, depressions were salt water exchange places. In a dry year, because the upper part and middle part of microtopography has higher temperature than that at lower part [10], the evaporation at the upper part and middle part of microtopography is higher than that at lower part. In the dry year, the evaporation shows relatively higher impact than the wet year. Based on the principles that the soil water flows from high to low gradient, soil moisture at the upper part and middle part of microtopography is supplied with water from the depression by side direction moving of moisture from low elevation to high elevation. During the process of side movement of moisture from low elevation to high elevation, the salts were also transported and accumulated through evaporation. The higher the evaporation, the faster the moisture is supplied, and the more the salt is accumulated. Low rainfall and high evaporation can increase the salt contents at the surface soil, especially at the upper part and middle part of microtopography [15]. The microtopography could influence the pattern and magnitude of spatial variability in salinity and alkalinity [36]. Therefore, under arid climate, the side direction movement of soil water driven by water with soluble salts from depression is the key factor, which aggravates the soil salinization under microtopography in dry condition. Based on research of mechanism of soil salinization formation and its development, it is found that the side direction movement of soil water driven by ponding water under microtopography in dry conditions is the key factor which aggravates the soil salinization, which will lead to co-distribute high saline and sodic areas and non or low saline and sodic areas at different part of microtopography. Most of the traditional saline-sodic soil reclamation approaches are only effective for saline-sodic soils with good uniformity in ground elevations. Therefore, these approaches may not work in areas with spatial variations in ground elevations, where there are also high spatial variations in soil salinity–sodicity. Continuous cropping was suggested together with good surface water drainage and improvement of soil structure prior to cropping was found to be beneficial [1]. The best way to ameliorate saline-sodic soil for the Patch with salinization involves increase in Ca2+ on the cation exchange site at the expense of Na+ . The replaced Na+ together with excess soluble salts is removed from the root zone through infiltrating water as a result of excessive irrigations to achieve soil improvement. 4. Conclusions The hydrological elements and microtopography are important factors affecting the spatial distribution of surface soil salinity and sodicity in Songnen Plain, northeast China. The values of SAR, Cl´ , and SO4 2´ were significantly higher in dry year than in wet year, while Ca2+ , Mg2+ , K+ , and HCO3 ´ showed the opposite results. Values of Na+ , CO3 2´ , and EC were significantly higher at higher
Water 2016, 8, 227
12 of 13
ground elevation gradient (20–40 cm) in dry year than wet year. The spatial distribution and variations of soil salinity–sodicity in surface soil layer were related with ponding and microtopography in wet year, and they were related with ponding, microtopography, and moisture at deep soil layer in dry year. The results of this research can provide some useful information for explaining mechanism of salinization process and utilization of saline-sodic soils in Songnen Plain, northeast China. Acknowledgments: This research is supported by the National Basic Research Program of China (2015CB150802), the National Natural Science Foundation of China (41571210, 41371260,) and the National Science and Technology Basic Work of China (2015FY110500). We also wish to acknowledge the support of Da’an Sodic Land Experimental Station. Author Contributions: The research presented here was carried out in collaboration between all authors. Fan Yang and Zhichun Wang had the original idea for the study. Fenghua An, Fan Yang and Hongyuan Ma designed/conducted the research methods. Xia Zhou and Zhijun Liu contributed to the writing of the paper. All authors discussed the structure and commented on the manuscript at all stages. Conflicts of Interest: The authors declare no conflict of interest.
References 1. 2. 3.
4. 5. 6.
7.
8. 9.
10.
11. 12.
13. 14. 15.
Qadir, M.; Schubert, S.; Ghafoor, A.; Murtaza, G. Amelioration strategies for sodic soils: A review. Land Degrad. Dev. 2001, 12, 357–386. [CrossRef] Shaw, R.; Brebber, L.; Ahern, C.; Wein, M. A review of sodicity and sodic soil behavior in Queensland. Aust. J. Soil Res. 1994, 32, 143–172. [CrossRef] Ammari, T.G.; Tahhan, R.; Abubaker, S.; Al-Zu’Bi, Y.; Tahboub, A.; Ta’any, R.; Abu-Romman, S.; Al-Manaseer, N.; Stietiya, M.H. Soil salinity changes in the Jordan Valley potentially threaten sustainable irrigated agriculture. Pedosphere 2013, 23, 376–384. [CrossRef] Liu, X.T. Management on Degraded Land and Agricultural Development in the Songnen Plain; Science Press: Beijing, China, 2001. (In Chinese) Wang, L.; Seki, K.; Miyazaki, T.; Ishihama, Y. The causes of soil alkalinization in the Songnen Plain of Northeast China. Paddy Water Environ. 2009, 7, 259–270. [CrossRef] Li, X.Y.; Wang, Z.M.; Song, K.S.; Zhang, B.; Liu, D.W.; Guo, Z.X. Assessment for salinized wasteland expansion and land use change using GIS and remote sensing in the west part of Northeast China. Environ. Monit. Assess. 2007, 131, 421–437. [CrossRef] [PubMed] Jordán, M.M.; Navarro-Pedreño, J.; Garcia-Sánchez, E.; Mateu, J.; Juan, P. Spatial dynamics of soil salinity under arid and semi-arid conditions geological and environmental implications. Environ. Geol. 2004, 45, 448–456. [CrossRef] Rakhimbaev, F.M.; Bezpalov, N.F.; Khamidov, M.K. Peculiarities of Crop Irrigation in Lower Amu Dary River Areas; Fan Iashkent: Tashkent, Uzbekistan, 1992. (In Russian) Ibrakhimov, M.; Khamzina, A.; Forkutsa, I.; Paluasheva, G.; Lamers, J.P.A.; Tischbein, B.; Vlek, P.L.G.; Martius, C. Groundwater table and salinity: Spatial and temporal distribution and influence on soil salinization in Khorezm region (Uzbekistan, Aral Sea Basin). Irrig. Drain. Syst. 2007, 21, 219–236. [CrossRef] Luo, J.M.; Yang, F.; Wang, Y.J.; Ya, Y.J.; Deng, W.; Zhang, X.P.; Liu, Z.J. Mechanism of soil sodification at the local scale in Songnen Plain, northeast China, as affected by shallow groundwater table. Arid Land Res. Manag. 2011, 25, 234–256. [CrossRef] Song, C.C.; Deng, W. Characters of groundwater and influence on the interior salt-affected soil in the west of Jilin Province. Sci. Geogr. Sin. 2000, 20, 246–250. (In Chinese) Yang, F.; Zhang, G.X.; Yin, X.R.; Liu, Z.J.; Huang, Z.G. Study on capillary rise from shallow groundwater and critical water table depth of a saline-sodic soil in western Songnen Plain of China. Environ. Earth Sci. 2011, 64, 2119–2126. [CrossRef] Zhang, G.X. Study on the Evolution of Groundwater Environment and Safety Management in the Taoer River Basin. Ph.D. Thesis, Chinese Academy of Sciences, Beijing, China, 2004. (In Chinese). Zhou, Y.; Fu, Z.; Liu, D.; Wang, L.; Wang, L. A study on the processes of grassland degradation, land salinization and soil desertification in the west of Jilin province. J. Jilin Univ. Earth Sci. Ed. 2003, 33, 348–354. (In Chinese) Joeckel, R.M.; Clement, B.J.A. Soils, surficial geology, and geomicrobiology of saline-sodic wetlands, North Platte River Valley, Nebraska, USA. CATENA 2005, 61, 63–101. [CrossRef]
Water 2016, 8, 227
16.
17.
18. 19. 20. 21. 22.
23.
24. 25. 26.
27. 28. 29. 30. 31. 32. 33.
34. 35. 36.
13 of 13
Ardahanlioglu, O.; Oztas, T.; Evren, S.; Yilmaz, H.; Yildirim, Z.N. Spatial variability of exchangeable sodium, electrical conductivity, soil pH and boron content in salt- and sodium-affected areas of the Igdir plain (Turkey). J. Arid Environ. 2003, 54, 495–503. [CrossRef] Corwin, D.L.; Lesch, S.M.; Oster, J.D.; Kaffka, S.R. Monitoring management-induced spatio-temporal changes in soil quality through soil sampling directed by apparent electrical conductivity. Geoderma 2006, 131, 369–387. [CrossRef] Emadi, M.; Baghernejad, M. Comparison of spatial interpolation techniques for mapping soil pH and salinity in agricultural coastal areas, northern Iran. Arch. Agron. Soil Sci. 2014, 60, 1315–1327. [CrossRef] Zhao, C.W.; Xu, L.; Wang, Z.C.; Wang, Y.H.; Chi, C.M. Studying Soil Salinity and Its Relations with Microtopography and Vegetation at Field Scale. Pol. J. Environ. Study 2013, 22, 1227–1237. Odeh, I.O.A.; Chittleborough, D.J.; McBratney, A.B. Elucidation of soil-landform interrelationships by canonical ordination analysis. Geoderma 1991, 49, 1–32. [CrossRef] McKenzie, N.J.; Austin, M.P. A quantitative Australian approach to medium and small scale surveys based on soil stratigraphy and environmental correlation. Geoderma 1993, 57, 329–355. [CrossRef] Gui, D.W.; Lei, J.Q.; Zeng, F.J.; Runge, M.; Mu, G.J.; Yang, F.X.; Zhu, J.T. Ordination as a tool to characterize soil particle size distribution, applied to an elevation gradient at the north slope of the Middle Kunlun Mountains. Geoderma 2010, 158, 352–358. [CrossRef] TerBraak, C.J.F. CANOCO—A Fortran Program for Canonical Community Ordinatin by Partial, Detrended, Canonical Correspondence Analysis and Redundancy Analysis (Version 2.1); Technical Report LWA-88-2 TNO; Agricultural Mathematics Group: Wageningen, The Netherlands, 1988. Deng, W.; Qiu, S.W.; Liang, Z.W. Background of Regional Eco-Environment in Da’an Sodic Land Experiment Station of China; Science Press: Beijing, China, 2005. (In Chinese) Eaton, A.D.; Clesceri, L.S.; Rice, E.W.; Greenberg, A.E. (Eds.) Standard Methods for the Examination of Water and Wastewater, 21st ed.; APHA Publication: Washington, DC, USA, 2005. Mahmoodabadi, M.; Yazdanpanah, N.; Sinobas, L.R.; Pazira, E.; Neshat, A. Reclamation of calcareous saline sodic soil with different amendments (I): Redistribution of soluble cations within the soil profile. Agric. Water Manag. 2013, 120, 30–38. [CrossRef] TerBraak, C.J.F.; Šmilauer, P. CANOCO Reference Manual and Canocodraw for Windows User’s Guide: Software for Canonical Community Ordination (Version 4.5); Microcomputer Power: New York, NY, USA, 2002. Lei, Z.D.; Yang, S.X.; Xu, Z.R.; Vachaud, G. Preliminary investigation of the spatial variability of properties. J. Hydraul. Eng. 1988, 9, 10–21. (In Chinese) Yang, J.F.; Deng, W.; Zhang, G.X. Water balance and temporal variation in water content in alkaline sodic soils with shallow water table. Hydrogeol. Eng. Geol. 2007, 4, 61–69. (In Chinese) Kilic, K.; Kilic, S. Spatial variability of salinity and alkalinity of a field having salination risk in semi-arid climate in northern Turkey. Environ. Monit. Assess. 2007, 127, 55–65. [CrossRef] [PubMed] Rengasamy, P.; Olson, K.A. Sodicity and Soil Structure. Aust. J. Soil Res. 1991, 29, 935–952. [CrossRef] Yang, J.F.; Zhang, G.X. Effect of hydrological process change on soil salinization in western Songnen Plain. J. Arid Land Resour. Environ. 2010, 24, 168–172. (In Chinese) Yang, F.; Zhang, G.X.; Yin, X.R.; Liu, Z.J. Field-Scale Spatial Variation of Saline-Sodic Soil and Its Relation with Environmental Factors in Western Songnen Plain of China. Int. J. Environ. Res. Public Health 2011, 8, 374–387. [CrossRef] [PubMed] Chi, C.M.; Wang, Z.C. Soil salinity, sodicity and alkalinity characteristics of degraded grassland in the west of Jinlin province, China. Ecol. Environ. Sci. 2013, 22, 1534–1537. (In Chinese) Rengasamy, P. Transient salinity and subsoil constraints to dry land farming in Australian sodic soils: An overview. Aust. J. Exp. Agric. 2002, 42, 351–361. [CrossRef] Cemek, B.; Guler, M.; Kilic, K.; Demer, Y.; Arslan, H. Assessment of spatial variability in some soil properties as related to soil salinity and alkalinity in Bafra plain in northern Turkey. Environ. Monit. Assess. 2007, 124, 223–234. [CrossRef] [PubMed] © 2016 by the authors; licensee MDPI, Basel, Switzerland. This article is an open access article distributed under the terms and conditions of the Creative Commons Attribution (CC-BY) license (http://creativecommons.org/licenses/by/4.0/).