VOLUME 85, NUMBER 17
PHYSICAL REVIEW LETTERS
23 OCTOBER 2000
Velocity Fluctuations in a Homogeneous 2D Granular Gas in Steady State Florence Rouyer* and Narayanan Menon† Department of Physics, University of Massachusetts, Amherst, Massachusetts 01003-3720 (Received 25 April 2000) We have measured the spectrum of velocity fluctuations in a granular system confined to a vertical plane and driven into a homogeneous, steady state by strong vertical vibration. The distribution of horizontal velocities is not Maxwell-Boltzmann and is given by P共y兲 苷 Cexp关2b共jyj兾s兲a 兴 where a 苷 1.55 6 0.1 at all frequencies and amplitudes investigated, and also for varying boundary conditions. The deviation from Maxwell-Boltzmann statistics occurs in the absence of spatial clustering and does not result from an inhomogeneous average over regions of varying local density. Surprisingly, P共y兲 has the same shape over a wide range of densities. PACS numbers: 81.05.Rm, 05.20.Dd, 05.20.Jj, 83.10.Pp
A granular fluid is made up of macroscopic grains that have no significant thermal motions but can be driven into motion by external forces [1]. In a molecular fluid, the average kinetic energy is determined by the temperature of the thermal bath that the fluid is in contact with; the fluctuations about this average are given by a MaxwellBoltzmann (MB) distribution with a width determined by the temperature, independent of the exact nature of the bath. In a granular fluid, at steady state, the average kinetic energy of grains (or “granular temperature”) is set by a balance of energy supplied by the driving forces and energy dissipated by inelastic collisions between grains [2]. The basis for kinetic-theory approaches to describing granular fluids is the assumption that far away from the source of energy, the fluctuations about the average energy have a well-defined distribution that is independent of the details of the driving force. In this Letter, we demonstrate experimentally that such a distribution does exist in a dilute, nearly elastic granular gas. The distribution is determined completely by a single parameter—the granular temperature—but is broader than a MB distribution. In the earliest formulations of kinetic theories of inelastic gases [3] it was assumed that a Maxwell-Boltzmann velocity distribution describes fluctuations in the interior of a gas. More recent theoretical work [4–7] and simulations [8,9] in driven and free inelastic gases find a variety of velocity distributions including Gaussians, exponentials, power laws, and other shapes. Potential reasons for the non-Gaussian distributions include inhomogeneous broadening due to density fluctuations [8] and long-range density and velocity correlations due to the inelastic interaction. Recent experiments [10–14] have also produced conflicting results. Olafsen and Urbach [10] studied a horizontal monolayer of particles moving in three dimension under vertical vibrations and found that the shape of the velocity distribution for the horizontal projection of velocity continuously varied between exponential and Gaussian as the acceleration is increased at fixed particle density. In the same geometry, Losert et al. [11] found a distribution with a tail given by exp共2jyj3兾2 兲 at higher accelera-
tions and large particle densities. In both experiments, particle-boundary and particle-particle collisions occur with comparable frequency, and the mean free path is comparable to the size of the system in the direction of excitation; this raises the concern that the measured distribution reflects the energy-injection mechanism as well as the intrinsic dynamics of an inelastic gas. References [12–14] study two-dimensional systems, as do we, but at relatively small excitations. Statistical uncertainties in Refs. [12] and [13] do not yield definitive determinations of the distribution. Kudrolli and Henry [14] find a variety of non-Gaussian distributions as excitation parameters are changed. It is not paradoxical that all these experiments find differing results: In general, non-Gaussian distributions that are particular to a driving mechanism can result from averaging in time over dynamics that are varying with the phase of the drive, or averaging in space over dynamics that are not homogeneous on scales larger than the mean free path. The goal of our experiment has been to create a driven system in which a steady state is established by inelastic collisions between grains, and in which spatial variations are slow on the scale of the mean free path. To achieve these conditions experimentally we study a very highly excited 2D system of grains. In our experiment (see Fig. 1), 100 to 500 stainless steel spheres of diameter d 苷 1.6 mm are confined between two vertical, parallel Plexiglas plates separated by a gap slightly larger than the diameter of the grains 共1.09 6 0.02d兲. Lateral walls made of Delrin define the 2D area in which the particles move: The results reported here have been obtained for a rectangle 共32d 3 48d兲 and a circle (of diameter 20d). The particles have a coefficient of normal restitution h 苷 0.93 [15]. An electromechanical shaker (LDS 500L) vibrates the cell sinusoidally in the vertical direction. The amplitude A is varied up to 3.5d and the frequency f up to 70 Hz. This corresponds to a maximum acceleration G 苷 A共2pf兲2 and maximum velocity of the cell y0 苷 A共2pf兲, of 58g and 1.8 m兾s, respectively. Particle kinematics are observed with a high-speed video camera (Kodak Motioncorder), at a rate of 2000 frames兾s, so that a particle is displaced less
3676
© 2000 The American Physical Society
0031-9007兾00兾85(17)兾3676(4)$15.00
VOLUME 85, NUMBER 17
PHYSICAL REVIEW LETTERS
23 OCTOBER 2000
scaled by s 苷 共具yx2 典兲1兾2 for varying frequencies and amplitude but at the same average density. These histograms are all the same shape—thus the spectrum of velocity fluctuations is determined purely by the average granu1 lar temperature 共苷 2 ms 2 兲 and just as in thermal equilibrium is independent of the “bath characteristics” which, in this case, are the many possible combinations of A and f that yield a particular value of “temperature.” Furthermore, the functional form of the distribution is independent of granular temperature (over a factor of 4.8 in temperature) just as in a gas at equilibrium. However, this distribution is broader than a Boltzmann distribution, indicated by the dotted line in Fig. 2(a). In order to
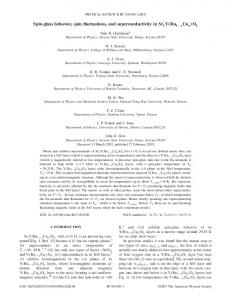
FIG. 1. Left: Sketch of the rectangular cell indicating the top and bottom walls at their rest positions (solid lines) and extreme positions (dotted lines). Right: Aerial density, r, versus height z (in d), with 216 spheres in the cell for f 苷 50 Hz (solid symbols), 60 Hz (open symbols), and various values of G (in g): 40 共䉭兲, 50 共䊐兲, 57 共䊊兲, f 苷 70 Hz, and G 苷 50g 共3兲. Velocity data are taken in the region marked by dashed lines.
than d between consecutive frames. We deduce particle displacements with a precision of ⬃0.04 mm (or 0.025d). The density is uniform in the horizontal direction, however, the density profile in the vertical direction evolves [16] as y0 is increased. At low velocities, particles gain energy mainly by collisions with the bottom edge, and the density profile decays exponentially with height far from the edge, as previously observed [12,16]. At higher values of y0 , both the top and the bottom edges give kinetic energy to the particles and the density tends toward a profile symmetric about the center of mass of the system, as shown in Fig. 1. Here we report measurements taken at y0 . 1 m兾s, so that we have the same density profile at all measured amplitudes and frequencies. Velocity measurements are taken in a rectangular window (dotted line in Fig. 1) of height 10d about the center of mass (which is within 1 sphere diameter of the middle of the cell). Within this window, the density varies by less than 10% and the average aerial density, r, does not vary with the phase of the vibration cycle. The distributions of yx and yz , the horizontal and vertical components of velocity, are similar, except for a height-dependent asymmetry in the high-velocity tails of yz (due to a slight excess of fast, downward-moving particles above the midplane of the cell, and a similar excess of fast, upward-moving particles below the midplane). We therefore focus on the horizontal velocity component, yx , within the window since the distribution of yx does not vary with height, or with the phase of the vibration cycle. The quantity under study is thus truly stationary, and appears to be incoherently excited by the distant boundaries of the system. Figure 2(a) shows the distribution P共yx 兲
FIG. 2. (a) P共yx 兾s兲. the histogram (normalized to be 1 at maximum) of scaled horizontal velocity yx 兾s for r 苷 0.15 for different values of f and G in a rectangular cell. y0 is varied from 1.1 to 1.6 m兾s and A from 1.6 to 3.2d. s varies from 1 0.40 to 0.62. The dotted line is a Gaussian: exp关2 2 共yx 兾s兲2 兴, it overestimates small velocities and underestimates large velocities. (b) 2 ln兵2 ln关P共yx 兾s兲兴其 vs ln共jyx j兾s兲 for r 苷 0.15 in a rectangular cell (squares), and in a circular cell (circle). The slope of the linear fit (solid line) is 21.52. The dotted lines with slopes equal to 21 and 22 correspond to an exponential and a Gaussian.
3677
VOLUME 85, NUMBER 17
PHYSICAL REVIEW LETTERS
concisely describe this “universal” distribution, we fit all the data with the function C exp关2b共jyx j兾s兲a 兴, as shown by the solid line. Fits to P共yx 兲 and ln关P共yx 兲兴 weighted by statistical errors yield comparable results of a 苷 1.51, b 苷 0.78 and a 苷 1.52, b 苷 0.78, respectively. (Note that C, a, and b are not independent in this function: Once the value of a is determined, the values of C and b must be consistent with normalization and s 2 苷 具yx2 典). In Fig. 2(b) we plot ln兵2 ln关P共yx 兲兴其 against jyx j兾s to show that the function in Fig. 2(a) fits the entire spectrum well and is different from a Gaussian over the entire velocity range. P共yx 兲 for a circular boundary [open circles in Fig. 2(b)] agrees well with result from the rectangle, which supports the argument that the distribution is independent of the driving mechanism. The kinetic theory of van Noije and Ernst [6] p predicts a distribution with a tail described by exp关2共1兾 1 2 h 2 兲 共jyj兾s兲3兾2 兴, where 3 h is the coefficient of restitution. The 2 power of y is consistent p with our measurement. However, the prefactor 共1兾 1 2 h 2 兲 implies (from the normalization) that their function cannot describe the whole distribution. By 3 contrast, we find that the 2 power extends over the entire spectrum and we find a prefactor of 0.80 compared to the value of 0.797 that is required by normalization. In their theory, energy is injected homogeneously in space by a white-noise source; this is significantly different from the driving mechanism in our experiment (and of other experiments where driving is from the boundary). Since the gas is relatively homogeneous in density, we are able to test the idea [8] that the velocity distribution is non-Gaussian due to an inhomogeneous average over regions that locally have Gaussian statistics. Since the rate
23 OCTOBER 2000
of inelastic collisions depends on the local density, fluctuations in density can lead to fluctuations in local kinetic energy. Indeed, this mechanism leads to a clustering instability in granular systems as they are left to cool from an initially homogeneous state. We characterize the fluctuations of local density by NR 共n兲, which is the number of spheres with “n 2 1” neighbors whose centers lie within a circle of radius R. In Fig. 3(a), we display NR 共n兲 for R 苷 2.6 mm at density r 苷 0.25. The dotted line corresponds to a Gaussian distribution of fluctuations showing that the spheres are randomly distributed in space. (This conclusion holds at all r and R that we have studied). The local rms velocity s decreases systematically as n increases. However, as shown in Fig. 3(b), the shape of the velocity distribution does not change with n. Thus the variation of local density affects the local granular temperature but the non-Gaussian distribution does not result from spatial averages over Gaussian distributions of varying width. The non-Gaussian shape of the distribution is not associated with any obvious correlations in density as seen in some hydrodynamic calculations [17]. As shown in Fig. 3(c), in the relatively dilute regime of our experiment, g共r兲 shows no features beyond a peak at the hard-core diameter due to excluded volume effects. Likewise, there appear to be no long-range velocity correlations. Finally, in Fig. 4 we present the velocity distribution as the average density r is varied. Surprisingly, the shape of the velocity distribution is unchanged as r is varied from 0.06 to 0.38 and is well represented by the function exp关20.80共jyx j兾s兲1.5 兴. The inset shows the variation with density, r, of the fit parameter a in the function
FIG. 3. (a) P共yx 兾s兲 for different values of local density, n. The solid line corresponds to the function exp关20.80共jyx j兾s兲3兾2 兴. (There are no adjustable parameters in this function, the prefactor of 0.80 is determined by normalization.) (b) NR 共n兲, the number of times that “n 2 1” spheres are counted within a circle of radius R (for R 苷 2.6 mm at r 苷 0.25). The dotted line corresponds to a Gaussian (random) distribution of fluctuations. (c) The radial distribution function, g共r兲 for r 苷 0.06, 0.09, 0.12, 0.19, and 0.25 (displaced vertically for clarity). There is no feature at distances larger than the sphere diameter, d.
3678
VOLUME 85, NUMBER 17
PHYSICAL REVIEW LETTERS
23 OCTOBER 2000
of the temperature to local density, and occurs in the absence of unusual density fluctuations. The non-Gaussian behavior also cannot be explained in terms of obvious long-range correlations in the spatial structure. We are currently studying other spatial and dynamic correlations for clues to the source of non-Gaussian behavior. We thank J. L. Machta, R. Krotkov, D. Candela, E. Trizac, S. Rica, and O. Narayan for useful conversations and to P. G. Silva for contributions to the experiment. This work received financial support through NSF CAREER DMR-987433 and ACS PRF-G33730.
FIG. 4. P共yx 兾s兲 for different r. The solid line corresponds to the function exp关20.80共jyx j兾s兲3兾2 兴. Inset: The exponent a shows no systematic variation with r.
exp关2b共jyx j兾s兲a 兴. There is no systematic variation of a although the bulk density is changed by over a factor of 5. If the non-Gaussian velocity distribution is a consequence of correlations brought about by inelastic collisions, then one might expect to recover a Boltzmann distribution in the dilute limit. This is clearly not the case in our experiment, and indicates that the dilute limit and the elastic limit are not the same. In Ref. [6], the elastic limit enters via the low-velocity cutoff for the exp关2jyj3兾2 兴 tail. In our experiment, however, the entire spectrum is described by this shape. This either implies that departure from h 苷 1 occurs singularly or that there is a Gaussian tail at higher velocities than we are currently able to measure. In conclusion, the function exp关2b共jyx j兾s兲a 兴 with the exponent a 苷 1.55 6 0.1 provides a remarkably robust representation of the velocity distribution of a 2D granular gas with slightly inelastic particles. (We recall that this distribution was also found for most driving parameters in a completely different geometry in Ref. [11].) There is no discernible variation of this distribution with the excitation parameters A and f, or the shape of the boundary. Thus, far away from the boundary of a driven system, there is a well-defined distribution that is intrinsic to the dynamics of inelastic particles. The distribution is unchanged as temperature and average density vary by a factor of 5. This non-Gaussian distribution is not a result of coupling
*Email address:
[email protected] † Email address:
[email protected] [1] H. M. Jaeger, S. R. Nagel, and R. P. Behringer, Rev. Mod. Phys. 68, 1259 (1996). [2] R. A. Bagnold, Proc. R. Soc. London A 225, 49 (1954); 295, 219 – 233 (1966). [3] J. T. Jenkins and S. B. Savage, J. Fluid Mech. 130, 187 (1983). [4] S. E. Esipov and T. Poschel, J. Stat. Phys. 86, 1385 (1997). [5] J. J. Brey, D. Cubero, and M. J. Ruiz-Montero, Phys. Rev. E 59, 1256 (1999). [6] T. P. C. van Noije and M. H. Ernst, Granular Matter 1, 57 (1998). [7] V. Kumaran, Phys. Rev. E 59, 4188 (1999). [8] A. Puglisi, V. Loreto, U. M. B. Marconi, and A. Vulpiani, Phys. Rev. E 59, 5582 (1999). [9] E. L. Grossman, T. Zhou, and E. BenNaim, Phys. Rev. E 55, 4200 (1997). [10] J. S. Olafsen and J. S. Urbach, Phys. Rev. E 60, R2468 (1999). [11] W. Losert et al., Chaos 9, 682 (1999). [12] S. Warr, J. M. Huntley, and G. T. H. Jacques, Phys. Rev. E 52, 5583 (1995). [13] E. Clement and J. Rajchenbach, Europhys. Lett. 16, 133 (1991). [14] A. Kudrolli and J. Henry, Phys. Rev. E 62, R1489 (2000). [15] Collisional losses due to nonzero impact parameters and friction are not captured in h which was measured for normal impacts on a massive plate. Averaged over all losses in translational kinetic energy due to collisions, the coefficient of restitution 艐0.8. Importantly, losses due to collisions on the Plexiglas walls are less than 5% of collisional losses even at the lowest densities considered in this paper. [16] E. Falcon, S. Fauve, and C. Laroche, J. Chim. Phys., Phys.Chim. Biol. 96, 1111 (1999); S. Luding et al., Phys. Rev. E 49, 1634 (1994); X. Yang and D. Candela, Phys. Rev. Lett. 85, 298 (2000). [17] T. P. C. van Noije et al., Phys. Rev. E 57, R4891 (1998); 59, 4326 (1999).
3679