Gordon P. Warn1 and Andrew S. Whittaker, M.ASCE2 ... earthquake excitation on the response of a bridge isolated with low-damping rubber and leadârubber ...
Vertical Earthquake Loads on Seismic Isolation Systems in Bridges Gordon P. Warn1 and Andrew S. Whittaker, M.ASCE2 Abstract: An important consideration for the design of seismic isolation systems composed of elastomeric and lead–rubber bearings is the safety of individual bearings for maximum considered earthquake shaking. One assessment of bearing safety involves the calculation of the vertical 共or axial兲 earthquake load on the individual seismic isolation bearings. This paper investigates the influence of vertical earthquake excitation on the response of a bridge isolated with low-damping rubber and lead–rubber bearings through earthquake simulation testing. Response data collected from the experimental program are used to determine the vertical load on the isolation system due to the vertical component of excitation. A comparison of the normalized vertical load data to the vertical base acceleration showed significant amplification of the vertical response for each simulation and configuration. Disaggregation of the axial load history showed the summation of maximum values from the vertical earthquake load and overturning moment overestimates the maximum axial load because these maximum values are unlikely to occur simultaneously. Additionally, a spectral analysis procedure using the unreduced vertical stiffness of the bearings was shown to provide a reasonable estimate of the vertical earthquake load. DOI: 10.1061/共ASCE兲0733-9445共2008兲134:11共1696兲 CE Database subject headings: Isolation; Earthquakes; Simulation; Bridges; Seismic effects.
Introduction Seismic isolation is a method for reducing inertial forces that develop in a structure as a result of earthquake ground shaking. Inertial forces are reduced by lengthening the fundamental period of vibration and added damping through the introduction of elements 共isolators兲 with low horizontal and large vertical stiffness that decouple the superstructure from the supporting substructure. Elastomeric bearings are one type of isolator consisting of a number of elastomeric 共rubber兲 layers bonded to intermediate steel 共shim兲 plates. The horizontal flexibility 共low shear stiffness兲 of an elastomeric bearing is dictated by the total thickness of rubber, whereas the close spacing of the intermediate shim plates provides a large vertical 共relative to the shear兲 stiffness for a given bonded rubber area and elastomer shear modulus. Lead–rubber bearings are another type of seismic isolation hardware and are derived from the elastomeric bearing differing only through the addition of a lead core 共an energy dissipating mechanism兲 typically located in a central hole. A key aspect of the design of seismic isolation systems for bridges 共and buildings兲 is the stability of individual bearings during maximum considered earthquake shaking. Once maximum displacements across the isolation interface are determined, the 1
Assistant Professor, Dept. of Civil and Environmental Engineering, Penn State Univ., University Park, PA 16802. E-mail: gwarn@engr. psu.edu 2 Professor, Dept. of Civil, Structural and Environmental Engineering, State Univ. of New York at Buffalo, Buffalo, NY 14260. Note. Associate Editor: Marvin W. Halling. Discussion open until April 1, 2009. Separate discussions must be submitted for individual papers. The manuscript for this paper was submitted for review and possible publication on December 14, 2006; approved on March 21, 2008. This paper is part of the Journal of Structural Engineering, Vol. 134, No. 11, November 1, 2008. ©ASCE, ISSN 0733-9445/2008/11-1696– 1704/$25.00.
safety of the individual bearings is assessed. The safety check requires the calculation of: 共1兲 the reduced critical buckling load of the elastomeric bearing at the maximum horizontal displacement and 共2兲 the compressive load under maximum earthquake shaking consisting of dead load, live load, overturning 共if applicable兲, and vertical earthquake components. Determination of the axial load carrying capacity of an elastomeric 共and lead–rubber兲 bearing under lateral displacement is an important topic and one that has been investigated by others, e.g., Buckle et al. 共1994, 2002兲. Previous analytical work 共Button et al. 2002兲 investigating the effect of vertical ground motion on the seismic response of a variety of highway bridges. The results of this study illustrated the significant effect the vertical component of excitation can have on pier axial load and vertical deck shear forces. Although, three of the six bridge systems considered in the Button et al. study included elastomeric bearings 共modeled as linear springs兲 for the response-spectrum and linear response-history analysis, the primary focus was the response of the bridge deck and piers. The work presented in this paper focuses on axial load demand on the seismic isolation systems and individual bearings, or more specifically, the contribution of axial load due to the vertical component of excitation. This paper summarizes the results of an earthquake simulation program performed with a large scale bridge model isolated with low-damping rubber 共LDR兲 and lead-rubber 共LR兲 bearings aimed at investigating the influence of vertical ground motion on the load carried by the isolation system and the individual bearings. Axial load histories from the individual bearings recorded during earthquake simulation testing were utilized to investigate the contribution of the overturning and vertical earthquake components to the total axial load carried by the individual bearings. In addition, sample results from selected earthquake simulation are used to validate a spectral analysis procedure for estimating vertical earthquake loads on seismic isolation system and individual bearings utilizing an unreduced vertical stiffness.
1696 / JOURNAL OF STRUCTURAL ENGINEERING © ASCE / NOVEMBER 2008
Table 1. Dynamic Properties of Fixed-Base and Isolated Bridge System
f 共Hz兲
Fixed-basea 12 10.2 LDRb 10.8 LRb a Values determined from the results of white-noise testing. b Values estimated from results of component testing.
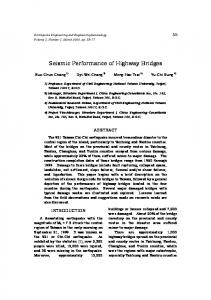
Fig. 1. Photograph of isolated bridge model
Bridge Model and Bearings The influence of vertical excitation on the load carried by a seismic isolation system and individual bearings was studied using a single span steel truss superstructure supported by four seismic isolation bearings. A photograph of the isolated bridge model installed on the two earthquake simulators housed in the Structural Engineering and Earthquake Simulation Laboratory 共SEESL兲 at the University at Buffalo, Buffalo, N.Y. is presented in Fig. 1. Reduced-scale LDR and LR seismic isolation bearings were designed and fabricated for component and earthquake simulation testing. The bearings were proportioned assuming mechanical and material properties typical of prototype elastomeric and lead–rubber bearings used in bridge construction 共HITEC 1998a,b兲, a bilinear force displacement relationship: identical to the characterization assumed in the Guide Specifications for Seismic Isolation Design 共AASHTO 1999兲 and scaling procedures for dynamic testing 共Harris and Sabnis 1999兲. The basis for the design is the assumed target prototype period of vibration, related to the shear stiffness of the rubber and the supported weight, of 2.5 s that was related to the model period using a time scale factor 共St兲 of 2. Additional prototype bearings properties assumed for the design include: a static compressive pressure 共p兲 of 3.45 MPa 共500 psi兲; a characteristic strength normalized by the weight acting on the isolator 共Qd / W兲 of 0.09 共LR only兲; and effective damping ratios, at a displacement equivalent to 100% rubber shear strain, of ⬍5 and 20% for the LDR and LR bearings, respectively. Details of the as-built LDR and LR bearings are presented in Fig. 2. As illustrated in Fig. 2, the LDR and LR bearings are
共%兲 2 1 2
identical with the exception of a lead-core inserted in the central hole for the LR bearings. In plan, the bearings consist of a hollow circular cross section with an outer bonded rubber diameter 共do兲 of 152 mm and an inner diameter of 30 mm. In elevation, the bearings consist of 20 individual rubber layers each 3 mm thick 共0.125 in.兲 关total rubber thickness 共Tr兲 of 60 mm 共2.36 in.兲兴 bonded to 19 intermediate steel shim plates each 3 mm 共0.125 in.兲 thick and two 25 mm 共1.0 in.兲 thick internal end plates. The specified outer bonded rubber diameter was reduced from 172 to 152 mm for manufacturing purposes resulting in shape factors 共S兲 of 10.2 and 12.2 for the LDR and LR bearings, respectively, where the shape factor is defined as the ratio of the loaded area to the area free to bulge for a single layer. For the LR bearing, the lead-core prevents the rubber along the inner radius from bulging. The bridge superstructure consists of two parallel planar trusses spanning 10.7 m 共35 ft兲 each 1.5 m 共5 ft兲 in height 共center-to-center兲 and transversely spaced 1.2 m 共4 ft兲 apart 共center-to-center兲. In the transverse direction, the planar trusses are connected by lateral beams and diagonal cross bracing. The self-weight of the truss superstructure is 89 kN 共20 kips兲. Three additional mass packages were added to the model each consisting of 2 steel plates 共3,000⫻ 2,000⫻ 90 mm兲, 120 lead bricks, and some ancillary steel section together weighing, approximately, 90 kN and resulting in a total model weight of, approximately, 360 kN. Due to the reduced bonded rubber diameter 共152 mm兲 and existing experimental setup, the provided static pressure in the isolated configuration was 5.2 MPa 共750 psi兲 per bearing and judged to be within the representative range of design compressive pressure for prototype bridge bearings 共HITEC 1998a,b兲. Table 1 presents frequency and critical damping ratio values for the first vertical mode of the loaded truss-bridge in the fixed-base 共FB兲 and isolated 共LDR and LR兲 configurations. For the fixed-base configuration, the vertical frequency and damping ratio of the first vertical mode were determined from the results of white-noise testing to be 12 Hz 共0.0833 s兲 and 2%, respectively 共calculated using the half-power bandwidth method兲. For the isolated configurations 共LDR and LR兲 the vertical frequency and critical damping ratio were estimated using the results of component testing in conjunction with the results of white-noise testing in the FB configuration. The estimated vertical frequency and critical damping ratio for the LDR configuration were estimated to be 10.2 Hz and 1%, respectively. Similarly, for the LR configuration the vertical frequency and critical damping ratio were estimated to be 10.8 Hz and 2%, respectively.
Component Testing
Fig. 2. Details of LDR and LR bearings
Two LDR and two LR bearings, identical to those used for earthquake simulation testing, were dedicated to component testing that consisted of characterization tests, to determine the mechanic properties of the bearings, and lateral-offset tests, to investigate JOURNAL OF STRUCTURAL ENGINEERING © ASCE / NOVEMBER 2008 / 1697
Axial load (kN)
200
150
100
50
0
0
0.5 1 1.5 Vertical displacement (mm)
2
0
0.5 1 1.5 Vertical displacement (mm)
2
(a) 200
the influence of lateral displacement on the vertical stiffness. Results of the lateral-offset program are presented in Warn and Whittaker 共2006兲 and Warn et al. 共2007兲. In this section, sample results from characterization testing performed on the LDR and LR bearings are presented. Testing was carried out using the single bearing testing machine located in the SEESL at the University at Buffalo. A photograph of the testing machine is presented in Fig. 3. A five-channel reaction load cell 共identical to those used for earthquake simulation testing兲 located directly beneath the seismic isolation bearing was used to measure shear and axial forces and a linear variable displacement transducer housed in the horizontal actuator used to measure lateral displacement 共see Fig. 3兲. For tests with variable axial loading, two linear potentiometers were attached across the bearing end plates and used to measure relative vertical displacement. Fig. 4 presents sample horizontal force–displacement loops for the LDR 关Fig. 4共a兲兴 and LR 关Fig. 4共b兲兴 bearings from a test consisting of four fully reversed cycles of sinusoidal input to a displacement amplitude of 60 mm 共100% rubber shear strain兲 at a frequency of 0.01 Hz with a constant compressive pressure of 3.45 MPa. From the results presented in Fig. 4共a兲, the effective stiffness 共Keff兲 and effective damping ratio 共eff兲 of the LDR, determined from the third-cycle response, are 0.29 kN/ mm
40
Shear force (kN)
30
0
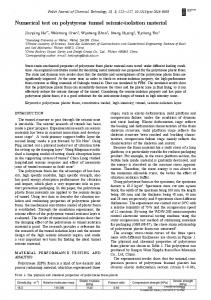
Fig. 5. Vertical force–displacement response of bearings: 共a兲 LDR; 共b兲 LR
共1.7 kips/ in.兲 and 2.8%, respectively. Additionally, the effective shear modulus 共Geff兲 was estimated to be 0.83 MPa calculated for the LDR bearings as Keff =
−10 −20
60
80
60
80
40 30 20 10 0 −10 −20 −30 −40 −80 −60 −40 −20 0 20 40 Displacement (mm)
(b)
GeffAe Tr
Fig. 4. Horizontal force–displacement response of bearings: 共a兲 LDR; 共b兲 LR
共1兲
where Ae = effective area accounting for the contribution of the 12 mm thick cover 共see Fig. 2兲 determined to be equal to 1.2 times the bonded rubber diameter 共Ab兲; see Warn and Whittaker 共2006兲 for details. The effective stiffness 共Keff兲 and effective damping ratio 共eff兲 of the LR 关see Fig. 4共b兲兴, again determined from the third-cycle response, are 0.4 kN/ mm 共2.3 kips/ in.兲 and 19%, respectively. In addition, the effective yield strength 共l兲 of the lead core was estimated to be 8.4 MPa 共1,200 psi兲 and calculated according to the following relationship: Q d = lA l
0
−40 −80 −60 −40 −20 0 20 40 Displacement (mm)
100
(b)
10
(a)
150
50
20
−30
Shear force (kN)
Axial load (kN)
Fig. 3. Photograph of single bearing testing machine
共2兲
where Al = cross-sectional area of the lead core and Qd = characteristic strength. The test described previously was repeated at a frequency of 1 Hz to determine the rate dependency of the mechanical properties of the bearings. From the results of the 1 Hz test, a 7% increase in both Keff and eff was observed for the LDR bearings. For the LR bearings, Keff and eff increased by 25 and 10%, respectively. The substantial increase in both Keff and eff for the LR bearings is attributed, in part, to the increase in effective yield strength of the lead core at the 1 Hz frequency. Sample force–displacement results from axial load tests performed on the LDR and LR bearings are presented in Fig. 5, wherein, a positive value of axial load indicates compression. The axial load tests were conducted under force control with a ramp signal, subjecting each bearing to three cycles of load at 0.01 Hz: from zero to the maximum and back to zero. Due to the mass of the loading beam and the stability and safety of the machine in force control, the axial load tests could not be conducted at a frequency greater than 0.33 Hz. However, from a 0.33 Hz test repeated on the LDR and LR bearings, only a slight 共⬍10% 兲
1698 / JOURNAL OF STRUCTURAL ENGINEERING © ASCE / NOVEMBER 2008
Table 2. Summary of Earthquake Ground Motion Records Year
Country
Event
1992 United States Cape Mendocino 1994 United States Northridge 1995 Japan Hyogo-Ken Nanbu 1999 Turkey Duzce a Distance value represents closest to fault rupture.
Mechanism
Moment magnitude
Station
Distancea 共km兲
Site class/classification
Reverse normal Reverse normal Strike slip Strike slip
7.1 6.7 6.9 7.1
Rio Dell Overpass Sylmar–Olive View JMA Bolu
18.5 6.4 0.6 17.6
B/USGS C/USGS B/USGS C/USGS
increase in vertical stiffness was observed 共Warn and Whittaker 2006兲. From the results presented in Fig. 5共a兲, the vertical stiffness 共Kv0兲 of the LDR bearing, calculated as the secant stiffness on the ascending branch of the first cycle, was determined to be 84 kN/ mm 共480 kips/ in.兲 and the vertical effective damping ratio 共v兲 was estimated to be 1.2%. From the results presented in Fig. 5共b兲, Kv0 and v for the LR bearing were determined to be 163 kN/ mm and 2%, respectively. Although not the intended purpose, the addition of the lead core increases the vertical stiffness, e.g., from 84 kN/ mm 共LDR兲 to 163 kN/ mm 共LR兲 and to a lesser extent the effective vertical damping, v, from 1.2% 共LDR兲 to, approximately, 2% 共LR兲.
Earthquake Ground Motions Four sets of recorded earthquake ground motions were selected and obtained from the Pacific Earthquake Engineering Research database 共2005兲 for the purpose of earthquake simulation testing. Table 2 presents summary information for the selected earthquake ground motion records including: mechanism; moment magnitude; station; distance-to-fault; and site class/classification. Each set consists of two horizontal components and one vertical component. Two of the sets were recorded in close proximity to a fault 关Sylmar and Japan Meteorological Agency 共JMA兲兴, one of which 共Sylmar兲 possesses characteristics of forward-rupture directivity 共Somerville 2000兲. Elastic response spectra generated assuming 5% of critical damping are plotted in Fig. 6. Also plotted in Fig. 6 is the ratio of the vertical response 共denoted UP兲 to each horizontal response: V / H. For the Hyogo-Ken 关Fig. 6共b兲兴 and Sylmar 关Fig. 6共d兲兴 motions, recorded in close proximity to a fault, the spectral ratio exceeds the commonly assumed value of 2 / 3 共indicated by the solid horizontal line兲 for periods less than 0.25 s, and for one component of the Hyogo-Ken motion for periods between 1.0 and 2.5 s. However, for the Bolu 关Fig. 7共a兲兴 and Rio Dell 关Fig. 7共c兲兴 motions, recorded at approximately 20 km to the fault, the spectral ratio is approximately less than or equal to 2 / 3. The trends of the V / H spectral ratio presented here are consistent with those observed by other researchers for near- and far-field ground motion records 共Silvia 1997; Button et al. 2002兲. For the purpose of earthquake-simulation testing all ground motion records were time scaled by a factor of 0.5 in accordance with the scaling procedure used to proportion the bearings and amplitude scaled according the earthquake simulation testing program described in the next section.
Earthquake Simulation Testing Earthquake simulation testing was performed on the two 6 degree-of-freedom earthquake simulators housed in the SEESL, serving the George E. Brown Jr., Network for Earthquake Engineering Simulation Equipment site, at the University at Buffalo
共Fig. 1兲. Four different configurations were tests, specifically, two isolation systems 共composed of LDR or LR兲 and two different transverse support configurations. Illustrations of the transverse view of the isolated bridge model with the bearings in the 1.8 and 1.2 m support width configuration are presented in Fig. 7. For each ground motion set, earthquake simulations were performed at two intensity levels: 共1兲 either 25 or 50% to verify the performance of the earthquake simulators, the instrumentation and to compare measured bearing properties to those used for analytical predictions and 共2兲 50–100%, as representative design ground shaking. Several instruments were used to measure and record the response of the isolated bridge model and input motion of the earthquake simulators including, accelerometers, string potentiometers, load cells and a Krypton Portable Coordinate Tracking and Measurement System. The accelerometers and string potentiometers were distributed across the isolated bridge model to measure and record absolute accelerations and displacements. In addition, a five-channel reaction load cell was located beneath each seismic isolation bearing recording axial load, shear force in the x 共longitudinal兲 and y 共transverse兲 directions, and moments about the x and y axes; see Fig. 7. A key response quantity for this study is the vertical load on the isolation system 共Peq兲 due to the vertical component of excitation also referred to herein as the vertical earthquake load. For simulations performed with three components of excitation 共horizontal plus vertical兲, the vertical earthquake load, Peq, was calculated using the recorded normal 共or axial兲 load signals from each of the four load cells according to 4
Peq共ti兲 =
P j共ti兲 − Wt 兺 j=1
共3兲
where P j共ti兲 = axial load signal from the jth load cell at time ti and Wt = total static weight of the bridge model calculated as the sum of the initial readings from each load cell. In Eq. 共3兲 the contribution of the overturning moment to the axial loads is removed in the summation. The vertical earthquake load, Peq, was normalized by the generalized weight of the bridge model 共W*兲 to investigate the amplification of the vertical response and to calculate amplification factors. The generalized weight of the bridge model was estimated to be 204 kN 共46 kips兲 and calculated by approximating the superstructures as a lumped mass system with a parabolic deformed shape corresponding to a shape function of n = 关0.48, 1 , 0.48兴T at 1,524, 5,334 共mid-span兲, and 9,144 mm along the length of the bridge model. To illustrate the amplification of the vertical response, the Peq / W* and vertical base acceleration histories from a simulation with the LR bearing in the 1.8 m configuration and the JMA ground motion set conducted at 100% intensity are presented in Fig. 8. Base input acceleration recorded at the center of the east and west earthquake simulator extension platforms are presented in Figs. 8共b and c兲, respectively. Noting,
JOURNAL OF STRUCTURAL ENGINEERING © ASCE / NOVEMBER 2008 / 1699
2
3
a
S (g)
2.5 2
V/H Ratio
Bolu 0 Bolu 90 Bolu UP
1.5 1
UP/90 UP/360
1.5 1 0.5
0.5 0
0
0.5
1
1.5
(a)
2 2.5 T (s)
3
3.5
0
4
2
V/H Ratio
JMA 0 JMA 90 JMA UP
2.5
a
0.5
1
1.5
2 2.5 T (s)
3
3.5
4
2
3
S (g)
0
(b)
1.5 1
UP/90 UP/360
1.5 1 0.5
0.5 0
0
0.5
1
1.5
(c)
2 2.5 T (s)
3
3.5
0
4
2
V/H Ratio
Rio 270 Rio 360 Rio UP
2.5
a
0.5
1
1.5
2 2.5 T (s)
3
3.5
4
2
3
S (g)
0
(d)
1.5 1
UP/90 UP/360
1.5 1 0.5
0.5 0
0
0.5
1
1.5
(e)
2 2.5 T (s)
3
3.5
0
4
2
V/H Ratio
Sylmar 90 Sylmar 360 Sylmar UP
2.5
a
0.5
1
1.5
2 2.5 T (s)
3
3.5
4
2
3
S (g)
0
(f)
1.5 1
UP/90 UP/360
1.5 1 0.5
0.5 0 (g)
0
0.5
1
1.5
2 2.5 T (s)
3
3.5
0
4
0
(h)
0.5
1
1.5
2 2.5 T (s)
3
3.5
4
Fig. 6. Elastic response spectra and spectral ratios for unscaled motions and 5% critical damping: 共a兲 Bolu; 共b兲 JMA; 共c兲 Rio Dell; and 共d兲 Sylmar
some difference is observed between the maximum input acceleration from the east 共maximum= 0.37 g兲 and west 共maximum = 0.28 g兲. From the results presented in Fig. 8, significant amplification is observed in the vertical response 共1.4 g兲 despite the difference in peak input from the east 共0.37 g兲 or west 共0.28 g兲 platforms. The significant amplification of the vertical response is a result of the flexibility of the isolation-truss system 共Warn and Whittaker 2006兲 and the low level of damping provided by the isolation system 共⬍2% of critical for the LR and LDR兲 and the steel truss 共⬍2% of critical兲. Amplification factors 共兲 were calculated from the results of each simulation as
=
max兩Peq/W*兩 PSA
共4兲
where PSA⫽average peak simulator 共base兲 acceleration calculated from the maximum absolute value of the recorded acceleration from the east and west simulation platforms. Fig. 9 presents amplification factors calculated from the results of simulations with the LDR and LR isolation system in both the 1.8 and 1.2 m configurations. In Fig. 9, the simulation from which the amplification value was calculated is identified by an abbreviation for the ground motion set and the intensity level. The results presented in Fig. 9 illustrate the significant amplification in the vertical re-
1700 / JOURNAL OF STRUCTURAL ENGINEERING © ASCE / NOVEMBER 2008
Fig. 7. Transverse view of isolated bridge model and support width: 共a兲 1.8 m; 共b兲 1.2 m
sponse for each isolation system, support width configuration and earthquake ground motion record with values ranging from, approximately 2 共LR 1.2, Sylmar 75%兲 to 5.5 共LDR 1.2, JMA 50%兲. The axial load history on the individual bearings was disaggregated to investigate the contribution of the individual components 共i.e., overturning and vertical excitation兲 to the total response. The component of axial load due to overturning was calculated by subtracting the initial recorded static weight and a quarter of the vertical load calculated according to Eq. 共3兲 from the response recorded by a particular load cell. Fig. 10 presents axial load histories for LR 1 from a simulation performed with the JMA ground motion set at 100% intensity. In Fig. 10, the static weight acting on LR 1 共97 kN兲 was subtracted from the recorded axial load prior to disaggregating the signal for comparison. From Fig. 10共a兲, the maximum and minimum values of the overturning component are 47 and −54 kN, respectively, and from Fig. 10共b兲,
Peq / W*
1.5 1
Spectral Analysis
max.=1.4 min.=−1.3
0.5
0 −0.5 −1 −1.5
(a)
0
5
10
15
max.=0.37 min.=−0.32
1 0.5 0 −0.5
−1.5
(c)
0
5
10 Time (s)
15
20
Fig. 8. 共a兲 Normalized vertical load and vertical input accelerations from the 共b兲 east and 共c兲 west supports for the LR system with JMA at 100% intensity
LDR 1.2
LDR 1.8
JMA 100%
Sylmar 75%
JMA 100%
LR 1.2
Bolu 100%
0 −0.5 −1
Sylmar 75%
max.=0.28 min.=−0.27
0.5
10 9 8 7 6 5 4 3 2 1 0
Bolu 100%
1.5 1
20
JMA 50%
15
Bolu 50%
10
Rio Dell 100%
5
JMA 50%
0
Bolu 50%
(b)
Rio Dell 100%
−1 −1.5
Acceleration (g)
20
In this section the vertical seismic force on the isolation system is estimated using a spectral analysis procedure whereby the bridge and isolation system are treated as an equivalent linear system and the response is estimated from spectra generated using the recorded seismic input and an appropriate level of damping. It is important to note that the vertical response of elastomeric and lead–rubber bearings is highly nonlinear especially under tensile loading and high compressive pressures. However in compression and at compressive pressures that would be considered acceptable
Amplification
Acceleration (g)
1.5
the maximum and minimum values from the vertical component are 95 and −95 kN, respectively. As expected, the frequency of the vertical component 关Fig. 10共b兲兴 is significantly higher than the overturning response: governed by the horizontal response of the isolators. From the axial load history presented in Fig. 10共c兲 共overturning plus vertical兲, the maximum and minimum values are 110 and −106 kN, respectively. A key observation from Fig. 10共c兲, is that the maximum absolute value 共110 kN兲 is significantly less than the sum of the maximum absolute values of the overturning 关Fig. 10共a兲兴 and axial 关Fig. 10共b兲兴 load 共149 kN兲. This result suggests that it would be overly conservative to add the maximum vertical component to the maximum overturning component for the assessment of stability during a maximum considered event as these are unlikely to occur simultaneously, although the maximum axial load due to overturning is certain to occur at the maximum horizontal displacement.
LR 1.8
Fig. 9. Amplification factors for vertical motion from earthquake simulation testing
JOURNAL OF STRUCTURAL ENGINEERING © ASCE / NOVEMBER 2008 / 1701
2
50
(a)
Axial load (kN)
1.5
0 −50 −100 −150
0
5
10
15
20
0
50
0
5
10
15
0.25
20
Tv0 = 2 150 100 50
0 −50 −100 −150
(c)
0
0.5 T (s)
0.75
1
Fig. 11. Elastic response spectra for 2% critical damping with recorded acceleration histories: LR 1.2 JMA at 100% intensity
0 −50 −100
(b)
1
0.5
150 100
−150
Axial load (kN)
ACC3 ACC9 Avg.
100
Sa (g)
Axial load (kN)
150
冑
W* Keq,v0 · g
共6兲
where g = gravitational acceleration constant, and Keq,v0 is the equivalent stiffness of the bridge-isolation system calculated as
0
5
10 Time (s)
15
20
Fig. 10. Axial load histories for LR 1 at 1.8 m support width and JMA 100% intensity: 共a兲 overturning; 共b兲 vertical; and 共c兲 overturning plus vertical
for design, elastomeric and lead–rubber bearings exhibit reasonably linear behavior as illustrated by the vertical force– displacement response of the LDR and LR bearings presented in Fig. 5. To investigate the impact of the reduction in vertical stiffness exhibited by elastomeric and lead–rubber seismic isolators 共Warn and Whittaker 2006; Warn et al. 2007兲 the spectral analysis was performed twice using bounding values of the vertical stiffness of the seismic isolator, specifically, the vertical stiffness under zero lateral offset 共Kv0兲 and a reduced vertical stiffness 共Kv兲 accounting for the maximum isolator displacement. In the subsequent section, the vertical seismic forces calculated using the spectrum method are compared to the vertical earthquake load 共Peq兲 determined from the results of earthquake simulation testing to evaluate the accuracy of the simplified method, understanding that for design purposes the seismic hazard 共input兲 is not deterministic. The vertical seismic force on the isolation system was calculated as P v = S aW *
共5兲
where Sa = spectral acceleration and W* = effective weight as previously defined. For this calculation, Sa was determined from the average of the response spectra generated using the recorded seismic input from the east 共ACC9兲 and west 共ACC3兲 simulator extension platforms. Fig. 11 presents elastic response spectra generated using recorded acceleration histories from a simulation with the LR bearings at 1.2 m support width and the JMA ground motion set at 100% intensity and 2% critical damping. The equivalent period of the bridge-isolation system, assuming full vertical stiffness 共Kv0兲 was calculated as
1 1 1 = + Keq,v0 Kbv 4Kv0
共7兲
where Kbv = generalized vertical stiffness of the truss-bridge determined 共from the results of white-noise tests performed in the fixed-base configuration兲 to be approximately 120 kN/ mm and Kv0 = unreduced 共zero lateral displacement兲 vertical stiffness of either an individual LDR or LR bearing. The effective period of the bridge-isolation system 共Tv兲 using the reduced vertical stiffness 共Kv兲 of the LDR and LR bearings was calculated in a similar manner, however, the lower bound value Kv was estimated according to Kv =
K v0 12 ⌬ 1+ 2 R
冋 冉 冊册 2
共8兲
where ⌬ = maximum horizontal displacement of the isolator 共determined from the results of earthquake simulation testing兲 and R = outer radius of the bearing. The expression presented in Eq. 共8兲 was derived from the Koh–Kelly two-spring model 共Koh and Kelly 1987; Warn et al. 2007兲.
Comparison of Results Values of the vertical earthquake load calculated using the spectral analysis 共Pv兲 procedure were compared to the vertical load results determined from earthquake simulation 共Peq兲 to evaluate the accuracy of the spectral analysis procedure. Plotted in Fig. 12 is a comparison of the estimated vertical load 共Pv兲 with the experimentally determined vertical load 共Peq兲 from simulation performed with the LDR 关Fig. 12共a兲兴 and LR 关Fig. 12共b兲兴 isolation systems. Each plot includes three reference lines with slopes equal to 1.0 共solid兲, 0.85 共dashed兲, and 1.15 共dashed兲. Again, the vertical earthquake load 共Pv兲 was calculated considering the full vertical stiffness of the isolators under zero lateral displacement 共Kv0兲 and again with a reduced vertical stiffness 共Kv兲 as denoted in the legend of the plots. From the results presented in Fig. 12, the vertical earthquake load calculated using the spectral analysis procedure and the full vertical stiffness is observed to estimate the experimentally determined value 共Peq兲 with reasonable accuracy: most values lying in close proximity of
1702 / JOURNAL OF STRUCTURAL ENGINEERING © ASCE / NOVEMBER 2008
450
350
5 Amplification
400
v
300 Pv (kN)
6
K 1.8 m vo K 1.2 m vo K 1.8 m v K 1.2 m
250 200
3 2 1
150
(a)
100
0
50
6
0
5
50 100 150 200 250 300 350 400 450 P (kN)
Amplification
0
(a)
eq
450
K 1.8 m vo K 1.2 m vo K 1.8 m v K 1.2 m
400 350
4
Rio Dell 100%
Bolu 50%
JMA 50%
SA: FB SA: LR 1.2 EXP: LR 1.2
3 2 1
(b)
v
300 Pv (kN)
4
SA: FB SA: LDR 1.2 EXP: LDR 1.2
0
Bolu 100%
JMA 100%
Sylmar 75%
Fig. 13. Comparison of amplification for fixed-base 共FB兲 with: 共a兲 LDR–bridge; 共b兲 LR–bridge systems
250 200 150 100 50 0
(b)
0
50 100 150 200 250 300 350 400 450 P (kN) eq
Fig. 12. Comparison of vertical earthquake load: 共a兲 LDR isolation system; 共b兲 LR isolation system
⫾15% of Peq for both the LDR 关Fig. 12共a兲兴 and LR 关Fig. 12共b兲兴 isolation systems. Additionally, for this isolation system and bridge model, consideration of the reduced vertical stiffness in the spectral analysis calculation did not result in improved estimates of the vertical earthquake load, rather, use of the reduced vertical stiffness lead to more unconservative estimates 共Pv ⬍ Peq兲. To assess the contribution of the isolator to the total vertical amplification a comparison of amplification factors for the FB and isolated configurations 共LDR-bridge and LR-bridge兲 determined from spectral analysis 共denoted SA兲 is presented in Fig. 13. Also plotted are experimentally determined amplification factors for the LDR- and LR-Bridge in the 1.2 m configuration. From the spectral analysis 共SA兲 results presented in Fig. 13, only a marginal increase in amplification is predicted for the isolated configurations over the fixed-base configuration with the exception of the JMA motion. However amplification factors for the isolated configurations calculated using SA tend to underestimate 共to varying degrees兲 the experimentally determined values with the exception of the LR-bridge and the Sylmar ground motion.
Discussion and Conclusions This paper serves to summarize and present sample results from earthquake simulation testing performed on a bridge model iso-
lated with LDR and LR bearings. Results from the earthquake simulation testing program were used to investigate the influence of vertical excitation on the vertical load carried by the isolation system and the axial load of individual bearings. In addition, the results of earthquake simulation testing were used to evaluate a spectral analysis procedure for calculating the vertical earthquake load on the isolation system considering the full and a reduced vertical stiffness of the LDR and LR bearings. Significant amplifications in the vertical response for both the LDR- and LR-bridge configurations were experimentally observed. However from a comparison of amplification factors for both the isolated and fixed-base configurations estimated using spectral analysis suggests the isolation system itself results in only a marginal increase in amplification over the fixed-base bridge for the model and systems considered in this study. These results suggest that the vertical flexibility of the bridge-isolation system should not be ignored for design and that use of the peak ground acceleration of the vertical component 共y-axis ordinate of the design spectrum兲 would underestimate the vertical earthquake load on the isolation system. Sample axial load histories from individual bearings showed the frequency of the vertical component to be significantly higher than that of the overturning component as was expected. However, the sum of the maximum absolute value of the two components tends to overestimate the maximum absolute value of the combined 共overturning plus vertical兲 axial load history for all simulations performed in this study. The spectral analysis procedure considering the full vertical stiffness of the isolator lead to reasonably accurate estimates of the vertical earthquake load on the isolation system for this bridge model and isolation systems. However, for a hybrid isolation system such as those composed of flat sliding and elastomeric the reduction in vertical stiffness should be considered on a case-by-case basis using more advanced analysis techniques.
JOURNAL OF STRUCTURAL ENGINEERING © ASCE / NOVEMBER 2008 / 1703
Acknowledgments The writers gratefully acknowledge the financial support of the Multidisciplinary Center for Earthquake Engineering Research and the Federal Highway Administration through Task D1.5 of the Federal Highway Administration Contract No. DTFH 61-98C-0094. The writers also wish to thank Dr. Amarnath Kasalanati of DIS Inc. for providing the model bearings used in this study. The opinions expressed in this paper are those of the writers and do not reflect the opinions of the Multidisciplinary Center for Earthquake Engineering Research or the Federal Highway Administration. No guarantee regarding the results, findings, and recommendations are offered by either the Multidisciplinary Center for Earthquake Engineering Research or the Federal Highway Administration.
References AASHTO. 共1999兲. Guide specifications for seismic isolation design, Washington, D.C. Buckle, I., Nagarajaiah, S., and Ferrell, K. 共2002兲. “Stability of elastomeric isolation bearings: Experimental study.” J. Struct. Eng., 128共1兲, 3–11. Buckle, I. G., and Liu, H. 共1994兲. “Experimental determination of critical loads of elastomeric isolator at high shear strain.” NCEER Bull., 8共3兲, 1–5. Button, M. R., Cronin, C., and Mayes, R. L. 共2002兲. “Effect of vertical motions on the seismic response of highway bridges.” J. Struct. Eng., 128共12兲, 1551–1564.
Harris, H. G., and Sabnis, G. M. 共1999兲. Structural modeling and experimental techniques, CRC, Boca Raton, Fla. HITEC. 共1998a兲. Evaluation findings for Dynamic Isolation Systems, Inc. elastomeric bearings, Civil Engineering Research Foundation, Washington, D.C. HITEC. 共1998b兲. Evaluation findings for Skellerup base isolation elastomeric bearings, Civil Engineering Research Foundation, Washington, D.C. Koh, C. G., and Kelly, J. M. 共1987兲. “Effects of axial load on elastomeric isolation bearings, Springfield, Va., Berkeley, Calif.” Earthquake Engineering Research Center, College of Engineering, Univ. of California, Berkeley, Calif. Pacific Earthquake Engineering Research 共PEER兲. 共2005兲, “Strong motion database.” 具http://peer.berkeley.edu/典 共May 1, 2005兲. Silva, W. J. 共1997兲. “Characteristics of vertical ground motions for applications to engineering design.” Proc., FHWA/NCEER Workshop on the National Representation of Seismic Ground Motion for New and Existing Highway Facilities, Tech. Rep. No. NCEER-97–0010, National Center for Earthquake Engineering Research, State Univ. of New York at Buffalo, N.Y., 205–252. Somerville, P. 共2000兲. “Characterization of near-fault ground motions.” U.S.–Japan Workshop on the Effects of Near-Field Earthquake Shaking, Pacific Earthquake Engineering Research Center, San Francisco. Warn, G., and Whittaker, A. S. 共2006兲. “A study of the coupled horizontal-vertical behavior of elastomeric and lead-rubber seismic isolation bearings.” Tech. Rep. No. MCEER-06-0010, Multidisciplinary Center for Earthquake Engineering Research, State Univ. of New York at Buffalo, Buffalo, N.Y. Warn, G. P., Whittaker, A. S., and Constantinou, M. C. 共2007兲. “Vertical stiffness of elastomeric and lead–rubber seismic isolation bearings.” J. Struct. Eng., 133共9兲, 1227–1236.
1704 / JOURNAL OF STRUCTURAL ENGINEERING © ASCE / NOVEMBER 2008