By B. Buanga, V. Hannemann, H. L ¨udeke, A. Mack, AND Y. You. Institute of
Aerodynamics and Flow Technology, German Aerospace Center - DLR.
Sonderforschungsbereich Transregio 40 – Jahresbericht 2009
1
Modeling of the interaction between a space vehicle’s external flow and it’s plume By B. Buanga, V. Hannemann, H. Ludeke, ¨ A. Mack, A N D Y. You Institute of Aerodynamics and Flow Technology, German Aerospace Center - DLR Lilienthalplatz 7, 38108 Braunschweig ¨ Bunsenstraße 10, 37073 Gottingen
This paper is concerned with the numerical modeling of the flow behind the base of a generic rocket. The DLR TAU code is first applied in a design study about the support of the model in the hypersonic environment. At the given circumstances a slanted support shows no advantage over an orthogonal design. The investigation then focuses on two configurations, related to hypersonic and to subsonic experiments conducted in Cologne and Aachen respectively. The applicability tests of different turbulence models are started on the level of two equation models calculating the steady state solution of the Reynolds averaged Navier Stokes equations. It will be continued with the calculation of unsteady flow fields around these simplified configurations as well as configurations with increasing complexity. All used models - the original Wilcox k-ω, the Menter SST and the EARSM formulation - predict an asymmetric base flow in both cases caused by the support of the models. A first comparison with preliminary experimental results indicates a preference for the SST and EARSM results over the results from the older k-ω model.
1. Introduction Embedded in the national research program Technological foundations for the design of thermally and mechanically highly loaded components of future space transportation systems a collaboration dedicated to the topic base flows is established between three experimentally (DLR Cologne, RWTH Aachen, TU Braunschweig) and two numerically ¨ (RWTH Aachen, DLR Braunschweig/Gottingen) working groups from different universities and the German Aerospace Center (DLR). While the other numerically working group focuses on highly accurate results via zonal LES, the interest of the present study is in the development of an efficient numerical model to describe accurately enough the external flow field around a space vehicle including the hot engine exhaust plume. The emphasis on the efficiency of the model is motivated by the intention to use a validated RANS-tool like the DLR-TAU code inside of the design cycle for future spacecrafts. The application of the tool should enhance the understanding of the complex flow fields generated by the interaction between the external flow around a rocket and the plume of the rocket propulsion system. As a long term basic research, the program starts with the most simplified geometries to improve the measurement techniques and the numerical prediction capabilities step by step. The experiments are conducted in subsonic and hypersonic environments around generic configurations with increasing levels of complexity. The numerical rebuilding of these experiments will either validate the numerical models within the experimental error bars or show the limitations of the
2
B. Buanga, V. Hannemann, H. Ludeke, ¨ A. Mack & Y. You
M∞ Rem [m−1 ] T∞ [K] 1 6.0 107 67.07 2 6.0 9.7 106 46 3 0.2
4 106
TW [K] 293 293
315.65 adiabatic
T0 [K] 550 380 -
TABLE 1. Flow conditions: 1 support study related to H2K, 2 final study in H2K, 3 investigation in Aachen
chosen models in predicting the measured quantities. A major influence is expected to be caused by the choice of the turbulence models for the high Reynolds numbers characterizing the flow fields of interest [1]. With increasing numerical effort from steady state solutions of the Reynolds averaged Navier Stokes (RANS) equations over unsteady (U)RANS and detached eddy simulation (DES) [2] to large eddy simulation (LES), the applicability inside of the design process of a space vehicle decreases. Therefore, many models exist on each level of complexity with different abilities to resolve turbulent flow fields. The current numerical investigation aims on the evaluation of different models with respect to the resolution of the base flow features important for the design process. On the first level the generic rocket model is a blunted cone - cylinder model with a side support. It results in two slightly different configurations investigated experimentally in a hypersonic environment at the DLR in Cologne and in a subsonic environment at the RWTH in Aachen. In section 4 the respective numerical investigation on the level of RANS solutions is reported. As a starting topic, section 2.1 is about an additional study conducted in the design phase of the side support in the hypersonic environment.
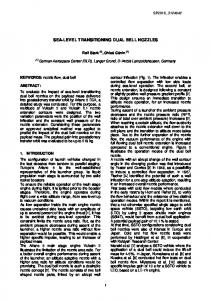
2. Experimental setup 2.1. Numerical investigation of the model support influence The model support keeps the model in a fixed position inside of the test chamber and supplies via internal pipes the test gases for the plume generation. Concerning the experimental setup the question arises, whether a slanted model support or an orthogonal geometry will be of advantage for clean on-flow conditions at the base of the experimental set-up. As a numerical contribution to the design process two calculations were conducted; one for the orthogonal geometry and one with a 45 degrees slanted support. The cylindrical part of the model is extended to the outflow boundary to avoid the necessity to resolve the wake flow behind the cylinder base and to gain insight in how far downstream the support wake influences the flow around the cylindrical body. The free stream conditions related to the H2K facility in Cologne are given in Tab. 1. Fig. 1 shows the two geometries with a thick vertical line in each sketch indicating the location of the cylinder base in the preceding experiments. The flow fields are calculated with a k-ω turbulence model assuming turbulent boundary layers on the model and support surfaces. In Fig. 1 the colours depict the Mach number distributions in the symmetry plane whereas the arrowed black lines are streamlines in this plane and skin friction traces on the body surfaces. Outside the boundary layers the Mach number distributions show in both cases an almost complete supersonic flow field except at the stagnation region of the blunted cone as expected and in the separated wake flow of
Modeling of plume/external flow interaction
3
F IGURE 1. Mach number distributions and streamlines in the symmetry plane combined with skin friction traces on the surfaces of model with orthogonal and slanted support.
the support. A connection between a subsonic support wake region and the base flow should be avoided. Therefore looking from the flow field analysis point of view, two design recommendations are found which influence the configuration in partly opposite directions. First, the base should be placed as far downstream of the support as possible. Second, the angle under which the support reaches the symmetry plane should be diminished in order to weaken the recompression shocks and prevent the flow separation. Assuming a fixed length of the model and fixed thickness and length of the thick part of the support the smaller angle would result in a shortening of the distance between support and cylinder base. The skin friction traces indicate where the disturbance of the support hits the opposite side of the cylinder. In case of the slanted support this happens a bit further downstream. The development of the asymmetric influence of the support on the boundary layers reaching the base was investigated via several cuts through the flow fields downstream of the support. As an example the cuts about 9 mm downstream of the base position in the preceding experiments (which was located 51 mm from the support) are given in Fig. 2. The Mach number and total pressure loss isolines are shown in two pictures, each combining the results with the orthogonal support on the left side with the results of the slanted support on the right side. At this position the symmetry disturbances are similar for both supports. Further downstream the slanted support results in a slightly more homogenous cylinder flow. As long as the base stays near the position, where it was located in the preceding experiments, the flow field analysis does not indicate a preference for a slanted support. 2.2. Tested configurations The final configuration for the hypersonic tests in the H2K in Cologne is depicted in Fig. 4. The orthogonal support has a longer trailing wedge with a smaller angle. The cylindrical part of the model is longer, so the distance between the support and the base is not shortened due to the longer support. The flow conditions are slightly different to the preceeding design study as summarized in Tab. 1. The model for the subsonic investigations in Aachen is shown in Fig. 5. The support
4
B. Buanga, V. Hannemann, H. Ludeke, ¨ A. Mack & Y. You
F IGURE 2. Mach number and total pressure loss isolines. In each picture the results with the orthogonal support are shown on the left side and with the slanted support on the right.
γ R [J/(K kg] Sutherland constant Pr Prturbulent 1.4 287 110.4 0.7 0.875 TABLE 2. Air model.
has a wing shape (NACA profile) and the base is located further downstream of the support than for the hypersonic tests. The flow conditions are again specified in Tab. 1.
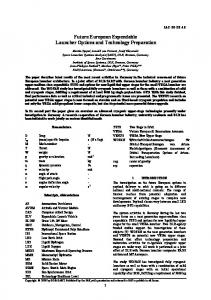
3. Numerical method The DLR TAU code is used to compute the flow fields by solving the Navier-Stokes equations for compressible flow in the conservative form [3], [4]. The equations are discretized by a second order finite volume approach on unstructured grids. Time advancement is carried out by a three stage Runge-Kutta scheme while time accurate calculations use the Jameson dual time stepping scheme. The spatial discretization is based on upwind schemes for hypersonic and preconditioned central schemes for subsonic conditions. The test gas air is modeled as a perfect gas, described in Tab. 2. The grids are repeatedly, locally adapted according to user defined indicators (e.g. gradients or differences of flow variables) to increase the resolution of the investigated flow features, as shown in Fig. 3. All boundary layers are assumed to be turbulent. Three turbulence models, the original Wilcox k-ω model [5], the Menter-SST model [6] and the Hellsten EARSM model [7], [8] are applied in this research to make an assess-
Modeling of plume/external flow interaction
(a) once adapted
(b) five times adapted
5
(c) nine times adapted
F IGURE 3. Successive adaptation in case of the hypersonic configuration
ment of their ability in simulating the hypersonic and subsonic base flows. Depending on the turbulence models used, the mean-flow equations are augmented by additional equations. The Wilcox k-ω model and Menter-SST model are two-equation models, and both of them are based on the solution of k and ω transport equations. The Wilcox k-ω model is one of the most famous two-equations models known for its accuracy in the near-wall region and it is also the baseline for the Menter-SST model. The underlying idea of the Menter-SST model is a blending of the Wilcox k-ω model in the inner part of the boundary layer and the k-ǫ model in the outer part of the boundary layer. The aim is to obtain both the accuracy in the near-wall region of the Wilcox k-ω model and the freestream independence in the outer part of the boundary layer of the k-ǫ model. Additionally a so-called shear-stress correction is introduced in the Menter-SST model which is used in this study. In explicit algebraic Reynolds stress models (EARSM), the turbulent stress tensor is given by an explicit algebraic relation. From this relation the production of turbulent kinetic energy can be directly computed. The Hellsten EARSM model is derived from a modified set of coefficients for the k-ω background model when used with the Wallin and Johansson EARSM as constitutive model. A compressibility correction is so far not used even in the hypersonic configuration, because it deteriorates the solution of the attached boundary layers. Current development aims on an improved implementation of a compressibility correction, which works locally in the free shear layers but is not invoked in the boundary layers.
4. Results 4.1. Flow topology of the RANS solutions The calculated results in the symmetry plane of the hypersonic configuration are depicted in Fig. 4. Stream lines are shown together with Mach number contours as well as with pressure contours. The turbulent boundary layer developing along the surface of the body separates at the base edge, and a free shear layer appears. As shown in Fig. 4, the main flow features are an expansion wave originating in the base edge and a recompression shock generated where the converging shear layer ends and parallel flow continues. The shear layer encloses a recirculation zone behind the base. Due to the influence of the support, the flow structure is asymmetric. The expansion is smaller in the wake of the support and consequently the recompression shock weaker. As a result the center of the recirculation is moved to the lower part of the base, away from the support. The figure also indicates that the Mach number and the pressure in the recir-
6
B. Buanga, V. Hannemann, H. Ludeke, ¨ A. Mack & Y. You
F IGURE 4. k-ω results of the hypersonic configuration in the symmetry plane: streamlines and contours of the Mach number and pressure (upper right corner) Z
Vortex Center Y
X
Stagnation point
F IGURE 5. k-ω results of the subsonic configuration in the symmetry plane: streamlines and contours of the Mach number and pressure (upper right corner)
culation zone are low compared to the freestream. Therefore, the base drag prediction critically depends on the accurate calculation of the pressure and velocity profiles in the subsonic recirculation zone. The flow field around the subsonic configuration is simpler as shown in Fig. 5. Again the Mach number and pressure distributions in the symmetry plane are presented together with streamlines. A ring vortex exists in the recirculation zone encapsulated be-
Modeling of plume/external flow interaction Mach_number: 0.1 0.8 1.5 2.1 2.8 3.5 4.2 4.8
Mach_number: 0.1 0.8 1.5 2.1 2.8 3.5 4.2 4.8
Z
Y
7
Z
X
(a) k-w model
Y
X
(b) SST model
Mach_number: 0.1 0.8 1.5 2.1 2.8 3.5 4.2 4.8 Z
Y
X
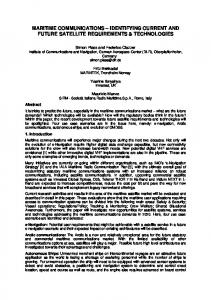
(c) EARSM model F IGURE 6. Mach number contours and streamlines in the hypersonic base flow; the sonic line separating sub- and supersonic flow regions is indicated by a thick line
hind the base by the free shear layer separation from the base edge. Again the wake of the support disturbs the symmetry of the recirculation, as can be seen in the shift of the vortex centers and in the inclination of the connection line between the two stagnation points of the base flow (see Fig. 5) as well as in the direction of the streamlines downstream of the recirculation zone. 4.2. Comparison and assessment of RANS models The three 2-equation turbulence models described in section 3 are utilized for both configurations. 4.2.1. Hypersonic base flow Fig. 6 shows the Mach number details of the base flow, computed by the Wilcox k-ω model (Fig. 6(a)), Menter-SST model (Fig. 6(b)) and the Hellsten EARSM model (Fig. 6(c)). The Mach number contours and streamlines allow an easy identification of the shear layer and the recirculation region. The general flow patterns of the three figures are almost the same. The centers of the recirculation regions stay on the lower side of the base. The angle between a horizontal line and the shear layer separating
8
B. Buanga, V. Hannemann, H. Ludeke, ¨ A. Mack & Y. You Z
Z
0 .1 Y
0.1593
X
593
946
X
71
0.1472
0.1866
X
Y
0.1724
0.
17
Y
0.1866
0 .1
0.1908
Z
0 .1
0 .1 6 6
72
4
8
59 0 .1 2 47 0 .1
3
(a) k-w model
0.1360
0.1257
16 0 .1 1 16 0 .1
1
(b) SST model
0.1668
0.1593 0.1593 472 0 .1
(c) EARSM model
F IGURE 7. Distributions of the pressure coefficient on the base of the hypersonic configuration
from the lower edge of the base increases slightly from the k-ω result (≈ 26◦ ) over the EARSM result (≈ 28◦ ) to the SST result (≈ 31◦ ). The length of the recirculation region shortens with an increasing shear layer angle. The base pressure distributions of the three models are compared because of their significant contribution to the prediction of base drag. Fig. 7 displays the distribution of the pressure coefficient, the normalized difference of the base pressure and the uniform free stream pressure. A higher pressure region is observed in the part of the base, where the wake of the support influences the free shear layer. Although the shapes of the pressure distributions are quite similar, the pressure level is different for the SST result. The pressure from the k-ω result (Fig. 7(a)) reaches the highest values on the whole plane while the result of the Menter-SST model (Fig. 7(b)) shows the lowest values. The result of the EARSM model (Fig. 7(c)) agrees well with the k-ω model on most parts of the base plane, except the peak region, where the pressure coefficient stays about 5% smaller. 4.2.2. Subsonic base flow The detailed structure of the recirculation region under subsonic conditions is exhibited in Fig. 8, showing Mach number contours and streamlines in the symmetry plane. The asymmetric ring vortex is divided via a thick line between the two stagnation points. The upper recirculation zone is thicker than the lower one in all three solutions, as a result of the support wake influence. The longest recirculation zone is predicted by the k-ω model while the SST model still provides a slightly shorter recirculation length compared to the EARSM model. The two vortex centers of the k-ω results are located slightly downstream of the other two solutions. The asymmetry of the k-ω result is stronger compared to the other solutions as can be seen in the angle of the vortex dividing line. The pressure distributions on the base generated with the different models are hardly distinguishable and therefore not shown. Fig. 9 shows the velocity directions in the recirculating regions. Please note that in
Modeling of plume/external flow interaction Mach_number:
0.02
0.04
0.07
0.09
0.11
0.13
0.15
0.18
0.20
Mach_number:
0.02
(a) k-ω model Mach_number:
0.04
0.07
0.09
9 0.11
0.13
0.15
0.18
0.20
(b) SST model 0.02
0.04
0.07
0.09
0.11
0.13
0.15
0.18
0.20
(c) EARSM model F IGURE 8. Details of the subsonic base flow: Mach number contours, streamlines, marked stagnation points and connecting line
order to have a better comparison with the experimental results discussed in the next section, the Z coordinate points downwards, which differs from the results shown before, e.g. Fig. 8. The support is still in the symmetry plane but now below the model. Again the two vortex centers predicted by the Menter-SST model stay slightly upstream of the other two results. The vortex centers calculated via the k-ω model are located at the most downstream position while the result of the EARSM model has an intermediate position. At the exit plane of Fig. 9 (0.13m downstream from the base), the width of the wake in the three results is also different. The wake given by the Menter-SST model is smaller, while the widths of the the other results seem equivalent. The distributions of the x-velocity-component in the symmetry plane are plotted in Fig. 10. In Fig. 10(a), the result of k-ω model shows the largest wake, while in Fig. 10(b), the SST model’s result displays the shortest one. The dark blue elliptical region indicating maximal negative x-velocities is the largest in the k-ω model’s result. Though the wake length of the EARSM result is slightly longer than that of SST result, its corresponding peak reverse velocity region, (see Fig. 10) seems to be smaller than that of SST result. 4.3. Preliminary comparison with experimental results First PIV (Particle Image Velocity) measurements of the subsonic base flow from the university of Aachen are available for a preliminary comparison with the numerical results. Fig. 9(d) shows the time averaged velocity directions processed from the PIV results. Compared to the numerical solutions of Fig. 9, it can be seen that the main flow char-
10
B. Buanga, V. Hannemann, H. Ludeke, ¨ A. Mack & Y. You
(a) k-ω model
(c) EARSM model
(b) SST model
(d) Preliminary experimental values
F IGURE 9. Normalized velocity vectors in the symmetry plane of the subsonic base flow
acteristics are caught. Two recirculating zones are captured by all the three turbulence models and the calculated shape of the shear layers agree well with the experimental result. The recirculation zone predicted by the k-ω model seems to be too large compared to the experimental result, while the other two flow fields are observed in the correct range. Fig. 10(d) depicted the X velocity component measured by the PIV system. These first experimental values preliminarily indicate that the backflow velocities are overpredicted by all three numerical solutions. With respect to this quantity the EARSM model compares best to the experiments.
Modeling of plume/external flow interaction
(a) k-ω model
(c) EARSM model
11
(b) SST model
(d) Preliminary experimental values
F IGURE 10. X velocity distribution on the symmetry plane of the subsonic base flow
5. Conclusions and beyond In the present study the base-flow of a generic blunt rocket configuration was investigated for two generic model configurations under sub- and hypersonic flow conditions. The configuration for the hypersonic environment was numerically studied with different angles of the model support. The flow field analysis shows that as long as the base has to stay in the vicinity of the support there is no advantage of a slanted support. The subsonic as well as the hypersonic configuration are numerically investigated on the level of the Reynolds averaged Navier Stokes equations. In both cases but more prominent for the hypersonic configuration the support causes an asymmetry in the base flow. Whether the support additionally changes the level of the base pressure will be addressed in a following study, computing a configuration with a base support. The base
12
B. Buanga, V. Hannemann, H. Ludeke, ¨ A. Mack & Y. You
pressure integrated in time and space as part of the overall drag of the configuration is an important issue for the design. The ability to predict the base pressure with a RANS solution will be further investigated via simulations of the unsteady flow. Amplitudes and frequencies of the unsteady flow fields are not resolved by the RANS solutions, but will provide additional comparisons against respective measurements. Restricted to the RANS solutions the investigated turbulence models reveal the following tendencies: The original k-ω model predicts the largest recirculation zones behind the base and the SST model the smallest. The EARSM model shows an intermediate ability, closer to the k-ω results in the hypersonic case and to the SST results in the subsonic case. The preliminary experimental results for the subsonic configuration agree best with the SST results. The comparisons will be enhanced as soon as more experimental data will become available. The numerical investigation on the RANS level will be extended to other models and a study about the influence of compressibility corrections on the free shear layers of the base flow.
Acknowledgments Financial support has been provided by the German Research Council (Deutsche Forschungsgemeinschaft - DFG) in the framework of the Sonderforschungsbereich Transregio 40. For the permission to compare against the unpublished preliminary experimental results we thank our colleague C. Wolf from the institute of aeronautics and astronautics of the RWTH Aachen.
References ¨ [1] L UDEKE , H., C ALVO, J.B. AND F ILIMON , A. (2006). Fluid Structure Interaction at the Ariane 5 Nozzle Section by advanced Turbulence Models. Proceedings of the European Conference on Computational Fluid Dynamics ECCOMAS CFD, Egmond aan zee, NL. ¨ [2] L UDEKE , H. (2005). Investigation of the Ariane 5 Nozzle Section by DES. 6th International Symposium on Launcher Technologies, Munich, Germany. [3] M ACK , A. AND H ANNEMANN , V. (2002). Validation of the unstructured DLR-TAU Code for Hypersonic Flows. AIAA 2002-3111. [4] R EIMANN , B., J OHNSTON , I. AND H ANNEMANN , V. (2004). DLR-TAU Code for High Enthalpy Flows. Notes on Numerical Fluid Mechanics and Multidisciplinary Design, 87, 99–106, Springer DE. [5] W ILCOX , D.C. (1998). Turbulence Modeling for CFD. 2nd ed., DCW Industries, ˜ La Canada, California [6] M ENTER , F. (1993). Zonal Two Equation k-ω Turbulence Models for Aerodynamic Flows. AIAA 93-2906. [7] WALLIN , S. (1999). An efficient explicit algebraic Reynolds stress k/ω model (EARSM) for aeronautical applications. Technical report, FFA TN 1999-71. [8] H ELLSTEN , A. (2004). New Two-Equation Turbulence Model for Aerodynamics Applications. PhD thesis, Helsinki University of Technology, Laboratory of Aerodynamics, Finnland.