MBoC | ARTICLE
Distinct fusion properties of synaptotagmin-1 and synaptotagmin-7 bearing dense core granules Tejeshwar C. Raoa, Daniel R. Passmorea, Andrew R. Pelemana, Madhurima Dasa, Edwin R. Chapmanb, and Arun Anantharama a
Department of Biological Sciences, Wayne State University, Detroit, MI 48202; bHoward Hughes Medical Institute, Department of Neuroscience, University of Wisconsin, Madison, WI 53705
ABSTRACT Adrenal chromaffin cells release hormones and neuropeptides that are essential for physiological homeostasis. During this process, secretory granules fuse with the plasma membrane and deliver their cargo to the extracellular space. It was once believed that fusion was the final regulated step in exocytosis, resulting in uniform and total release of granule cargo. Recent evidence argues for nonuniform outcomes after fusion, in which cargo is released with variable kinetics and selectivity. The goal of this study was to identify factors that contribute to the different outcomes, with a focus on the Ca2+-sensing synaptotagmin (Syt) proteins. Two Syt isoforms are expressed in chromaffin cells: Syt-1 and Syt-7. We find that overexpressed and endogenous Syt isoforms are usually sorted to separate secretory granules and are differentially activated by depolarizing stimuli. In addition, overexpressed Syt-1 and Syt-7 impose distinct effects on fusion pore expansion and granule cargo release. Syt-7 pores usually fail to expand (or reseal), slowing the dispersal of lumenal cargo proteins and granule membrane proteins. On the other hand, Syt-1 diffuses from fusion sites and promotes the release of lumenal cargo proteins. These findings suggest one way in which chromaffin cells may regulate cargo release is via differential activation of synaptotagmin isoforms.
Monitoring Editor Adam Linstedt Carnegie Mellon University Received: Feb 3, 2014 Revised: Jun 9, 2014 Accepted: Jun 11, 2014
INTRODUCTION It was once believed that exocytosis occurred in an all-or-none manner, in which, after a secretory granule fused, it was committed to release all of its contents. More recent evidence suggests that in the adrenal chromaffin cell, mechanisms have evolved to regulate content release after fusion by controlling the rate or the extent of fusion pore expansion (Taraska et al., 2003; Taraska and Almers, 2004; Perrais et al., 2004; Fulop et al., 2005, 2008; Anantharam et al., 2011). The fusion pore is the aqueous passage through which essential signaling molecules (neurotransmitters, hormones, This article was published online ahead of print in MBoC in Press (http://www .molbiolcell.org/cgi/doi/10.1091/mbc.E14-02-0702) on June 18, 2014. Address correspondence to: Arun Anantharam (
[email protected]). Abbreviations used: A.F.U., arbitrary fluorescence units; CgB, chromogranin B; diD, 1,1’-dioctadecyl-3,3,3’,3’-tetramethylindodicarbocyanine, 4-chlorobenzenesulfonate salt; NPY, neuropeptide-Y; P+2S, (p-pol emission) + 2 (s-pol emission); P/S, (p-pol emission)/(s-pol emission); PSS, physiological saline solution; pTIRFM, polarized total internal reflection microscopy; VAMP, vesicle-associated membrane protein. © 2014 Rao et al. This article is distributed by The American Society for Cell Biology under license from the author(s). Two months after publication it is available to the public under an Attribution–Noncommercial–Share Alike 3.0 Unported Creative Commons License (http://creativecommons.org/licenses/by-nc-sa/3.0). “ASCB®,” “The American Society for Cell Biology®,” and “Molecular Biology of the Cell®” are registered trademarks of The American Society of Cell Biology.
2416 | T. C. Rao et al.
neuropeptides, etc.) are expelled into the extracellular space. Control over the sieving properties of the fusion pore greatly expands the physiological range of exocytosis. It allows, for example, cells to release contents selectively on the basis of size exclusion; smaller hormones leave small pores more readily than larger proteins, which are retained. Such selective content release may be relevant to different functions of the adrenal medulla as part of the sympathetic nervous system. Under basal conditions, chromaffin cells release catecholamines (epinephrine and norepinephrine) at a low basal rate set by the sympathetic tone (de Diego et al., 2008). Basal secretion is linked with the cavicapture fusion mode, in which granules fuse and release contents through a transient opening, which reseals (Taraska et al., 2003; Perrais et al., 2004). Acute stress dramatically up-regulates not only the level of catecholamines in the circulation, but also a variety of neuropeptides with roles in the peripheral response (Damase-Michel et al., 1993; Edwards and Jones, 1993; de Diego et al., 2008). The increased sympathetic activation of the adrenal medulla during stress is linked with full-collapse fusion. In this mode, the pore expands widely, allowing for more thorough release of granule lumen constituents. Despite these observations, there is a gap in our knowledge with respect to the molecular events that regulate fusion Molecular Biology of the Cell
pore expansion and concomitant content dispersal. Because of the importance of adrenal hormones for physiological homeostasis, this is a major limitation. In chromaffin cells, the trigger for stimulus-evoked exocytosis is a rise in intracellular Ca2+. The level of intracellular Ca2+ accumulation varies with the stimulus intensity and secretogogue (Augustine and Neher, 1992; Garcia et al., 2006; de Diego et al., 2008). Ca2+ regulates release by acting on the Ca2+-binding synaptotagmin (Syt) protein family (Brose et al., 1992; Voets et al., 2001; Schonn et al., 2008), driving their association with membranes that harbor anionic lipids (Tucker et al., 2004). This interaction between the Syt-Ca2+ complex and the membrane is proposed to serve as a critical step in excitation–secretion coupling (Brose et al., 1992). Although there are at least 17 Syt isoforms, chromaffin cells express only two: Syt-1 and Syt-7 (Schonn et al., 2008). The two isoforms differ in their affinity for Ca2+ in the presence of anionic phospholipids and their rate of disassociation from phospholipids (Sugita et al., 2002; Tucker et al., 2003; Bhalla et al., 2005; Hui et al., 2005). The goal of the present study was to determine whether the divergent biochemistry of the two Syt isoforms expressed in chromaffin cells imposes functionally divergent effects on dense core granule exocytosis. That the roles of Syt isoforms in chromaffin cells are distinct is suggested by previous studies in the PC12 cell line. PC12s express 4 Syt isoforms: 1, 4, 7, and 9 (Fukuda, 2004; Fukuda et al., 2002, 2004). Overexpression studies suggest that isoforms harbor a size preference for secretory granules (Zhang et al., 2011) and endow the fusion event with different functional and kinetic properties (Moghadam and Jackson, 2013). Syt-4, for example, negatively regulates exocytosis, increasing the probability that pores will reseal after fusion (Wang et al., 2001; Zhang et al., 2011). Syt-1 fusion also produces more cavicapture events than either Syt-7 or Syt-9 (Wang et al., 2001, 2003, 2006; Bai et al., 2004). Suppression of Syt-1 and Syt-9 expression abolishes Ca2+-dependent release, suggesting that these two isoforms account for all regulated exocytosis in PC12 cells (Lynch and Martin, 2007). In this study, we identify fundamentally different roles for Syt-1 and Syt-7 in chromaffin cell exocytosis. We find that endogenous Syt-1 and Syt-7 rarely colocalize on granules, with most expressing only one isoform or the other. Syt isoform effects on fusion, fusion pore expansion, and endocytosis were also distinct. When overexpressed, Syt-1 enables the rapid expansion of fusion pores and promotes the release of granule membrane and lumenal proteins. On the other hand, Syt-7 fusion pores usually fail to expand (or reseal) and restrict cargo release. Consistent with these results, granules with Syt-1 overwhelmingly undergo the full-collapse mode of fusion, whereas those with Syt-7 exhibit higher rates of endocytosis. Finally, we find that isoforms have different requirements for activation. A more strongly depolarizing stimulus, and a correspondingly greater increase in intracellular Ca2+, is necessary to activate Syt-1 than it is to activate Syt-7. On the basis of these results, we propose that selective, stimulus-dependent activation of the Syt isoforms play an important role in controlling chromaffin cell fusion modes.
RESULTS Synaptotagmin isoforms are sorted to different granule populations Chromaffin cells express two protein isoforms of synaptotagmin (Syt-1, Syt-7). An important question is whether they are sorted to the same or separate secretory granules. A recent study in PC12 cells, which express Syt-1, 4, 7, and 9, showed there to be significant differences in isoform sorting (Zhang et al., 2011). Therefore our first goal was to visualize chromaffin cell granules and determine how frequently they express one or both isoforms. We transfected Volume 25 August 15, 2014
cells with neuropeptide Y–Cerulean (NPY-Cer) to label granules and identified isoforms using antibodies against Syt-1 and Syt-7. We then counted the number of fluorescent Syt-1 and/or Syt-7 puncta that colocalized with NPY. The data are shown in Figure 1, A and B. Across 17 cells, almost 69% of NPY-labeled granules expressed either Syt-1 or Syt-7. Fewer than 20% of NPY granules did not have any Syt-protein, whereas an even smaller number (5 s. When observed, P + 2S also tended to defluorescence of Syt-1 in the plane of the plasma membrane was crease rather than increase, suggesting a widening pore. In contrast, further analyzed by calculating the diffusion coefficient (D) for a subat sites of Syt-7 fusion, P + 2S usually increased (34 of 37) rather than set of events. D was calculated from the slope of the plot of w2 verdecreased (3 of 37), with most lasting for >5 s. P + 2S changes after sus time, where w2 is the variance of the Gaussian fit of the Syt-1 VMAT-2 granule fusion were again intermediate, with roughly equivfluorescence (Figure 5C). The diffusion coefficient for the event alent numbers of events associated with increases and decreases shown in Figure 5A was calculated to be 0.53 × 10⁻² μm2/s. The (Supplemental Figure S3C). mean diffusion coefficient from 17 Syt-1 fusion events with approxiThus fusion of Syt-7 granules results in the formation of a pore mately linear increases in w2 versus time was calculated as 0.63 × that frequently reseals, resulting in endocytosis (29% of events). 10−2 ± 0.15 μm2/s. This value is more than an order of magnitude The remaining 71% of events may either be progressing to cavsmaller than that calculated for vesicular monoamine transporter icapture or, alternatively, full-collapse fusion with slower kinetics. (VAMP) in chromaffin cells (Allersma et al., 2004). This suggests that In contrast, Syt-1 pores expand widely after fusion. A small minoreven when Syt-1 diffuses out of fusion sites, it does so slowly. Only ity of these fusion events end in endocytosis (8% of events; 8% (3 of 36) of Syt-1 pHluorin fusion events are punctate for 40 s or Figure 6B). When a much larger number of events is considered— more. that is, from cells expressing Syt-1 or Syt-7 pHluorin but not stained Volume 25 August 15, 2014
Syt isoforms and exocytosis | 2419
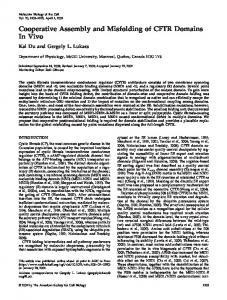
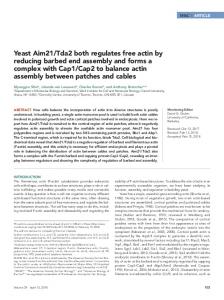
FIGURE 3: Syt-7 fluorescence persists at sites of fusion for tens of seconds. (A) The fusion of a Syt-7–pHluorin granule and concomitant increases in diD-labeled membrane curvature (P/S) and concentration (P + 2S). Scale, 960 nm. (B–D) Intensity vs. time for images in A. Dotted line at time 0 indicates the prefusion. Black bars indicate duration of pH 5.5 PSS washes. (E) Based on computer simulations (as described in Anantharam et al. (2010), the increases in P/S and P + 2S are consistent with a fusion pore that fails to expand.
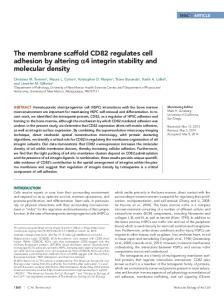
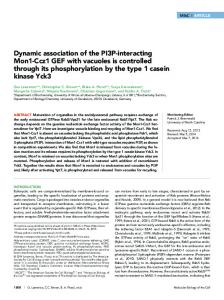
FIGURE 4: Fusion of Syt-7 granules sometimes results in cavicapture. (A) Two Syt-7 pHluorin fusion events (circle and arrow). Before fusion (Pre-stim) no fluorescence is visible at either site. With stimulation (6.0 s), puncta are evident within the circled region and at the arrow. Syt-7 fluorescence within the circled region is not quenched by pH 5.5 PSS, suggesting that this event has undergone endocytosis at the site of fusion (cavicapture). Syt-7 fluorescence at the arrow is sensitive to a wash of pH 5.5 PSS, suggesting that the granule lumen is accessible to the extracellular space via a pore. Scale, 960 nm. (B–D) Graphs for pHluorin, P/S, and P + 2S emission images within circled region of A. (E) The emission intensity changes observed are consistent with an endocytosed membrane remaining within the evanescent field, yielding increases in P/S and P + 2S.
with diD—the frequency of endocytosis remains considerably lower for Syt-1 than for Syt-7. Three of 289 Syt-1 fusion events resulted in endocytosis versus 68 of 310 Syt-7 fusion events (Supplemental Figure S3D). This demonstrates that diD staining did not, on its own, change the prevailing fusion mode for Syt-1 and Syt-7 granules.
fusion fluorescence intensity from many fusion events is shown in Figure 8E. Fluorescence intensity decays to baseline in roughly 4 s for VMAT-2 + Syt-1 events, whereas it is resistant to decay in the case of VMAT-2 + Syt-7 events.
Syt-7 slows dispersal of granule cargo proteins and membrane proteins
Membrane depolarization opens voltage-gated channels, allowing Ca2+ to accumulate within cells and trigger exocytosis. The level of
The topological changes observed in Figure 6 demonstrate that Syt-7 fusion pores widen slowly (or reseal), whereas Syt-1 pores expand widely. If the presence of Syt-7 on the granule retards pore expansion, the dispersal of lumenal granule contents should also be slowed. To determine whether this was the case, we transfected cells to express Syt-1 or Syt-7-mCherry and chromogranin B (CgB) pHluorin. We monitored the release of CgB out of granules with either Syt-1 or Syt-7. Representative CgB-pHluorin release events from Syt-1 and Syt-7 granule are shown in Figure 7, A–D. On average, CgB release from Syt-1 granules (circles in graph) occurred more rapidly than from Syt-7 granules (squares in graph). We also studied the effects of Syt-7 expression on the diffusion of a granule membrane protein, VMAT-2, out of the fused granule/ plasma membrane domain. VMAT2-pHluorin ordinarily diffuses rapidly from sites of Syt-1 granule fusion, exhibiting a roughly twofold higher diffusion coefficient than Syt-1 (Figure 8, A and B, and Supplemental Figure S3D). However, when VMAT-2 is coexpressed with Syt-7, its movement out of fusion sites is significantly disrupted (Figure 8, C and D). Indeed, VMAT-2 fluorescence shows a strong tendency to persist at the fusion site along with Syt-7. The post 2420 | T. C. Rao et al.
Synaptotagmins are differentially activated by depolarizing stimuli
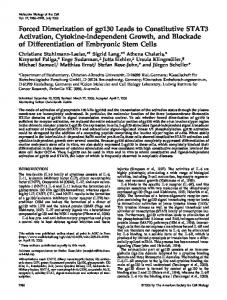
FIGURE 5: Syt-1 diffusion. (A) Syt-1-pHluorin diffusing from a fusion site. Scale, 960 nm. (B) Syt-1-pHluorin intensity decay. (C) The diffusion coefficient (D) of Syt-1 was calculated from the variance (w2) vs. time of Gaussian fits by using D = Δw2/4Δt. The diffusion coefficient for the Syt-1 fusion event shown was calculated to be 0.53 × 10⁻² μm2/s. For clarity, radial intensity profiles every 400 ms are shown (images were actually acquired at 5 Hz). Molecular Biology of the Cell
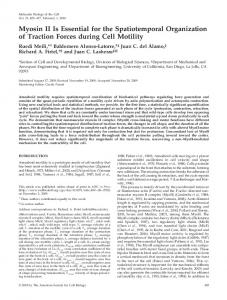
FIGURE 6: (A) Averaged, normalized intensities of Syt-1 (n = 36; seven cells) and Syt-7 (n = 51; six cells) fusion events ± SEM. Means are significantly different after 2.8 s (*p < 0.05, Student’s t test). (B) Chromaffin cells expressing Syt-1 or Syt-7 pHluorin were exposed to low-pH (5.5) PSS for ∼8-s intervals after an initial 30-s stimulation with 56 mM KCl in the presence of bafilomycin. Low-pH-insensitive events were assumed to have undergone endocytosis and are expressed as percentage of total fusion events. The probability of a fusion event undergoing endocytosis (cavicapture) with Syt-7 (six cells) was significantly different from that with Syt-1 (seven cells; **p < 0.01, binomial probability). P/S (C) and P + 2S (D) lifetimes for individual Syt-1 and Syt-7 fusion events. Syt-1 events are short lived. Only nine of 36 P/S increases and one of 23 P + 2S changes (increases and decreases) persist for >5 s for Syt-1. In contrast, most Syt-7 fusion events are associated with P/S (48 of 51 events) and P + 2S (22 of 37 events) changes lasting >5 s.
Ca2+ accumulation is commensurate with stimulus intensity (Augustine and Neher, 1992). Changes in stimulus intensity are tied to two different fusion modes for chromaffin cell secretory granules (Fulop et al., 2005). Therefore the goal of the following experiments was to determine whether Syt isoforms were differentially activated by elevations in intracellular Ca2+ to promote these different fusion modes. To perform these studies, we first monitored qualitative changes in near-membrane Ca2+ in cells transfected with gCaMP5G (Tucker et al., 2003) and exposed to 10, 25, and 56 mM KCl for 50–60 s. The greatest increases in Ca2+ were observed with 56 mM KCl. This demonstrates that Ca2+ accumulation at the membrane and near fusion sites is sensitive to how strongly the cell is depolarized (Figure 9A). With decreasing amounts of KCl in the depolarizing solution, the ΔF/F is significantly lower (averaged ΔF/F data are shown ± SEM). Next we transfected cells with Syt-1–GFP or Syt-7–GFP and monitored whether granules expressing fluorescent isoforms were differentially responsive to KCl Volume 25 August 15, 2014
depolarization. At the lowest KCl concentration, only a handful of fusion events (seven of 2041 docked granules across 25 cells) were observed for Syt-1, and a similar number (35 of 1994 docked granules across 25 cells) were observed for Syt-7. With a moderate 25 mM KCl stimulation, ∼17% of docked Syt-7 granules fused, whereas the number of recorded Syt-1 events remained low. Large numbers of fusion events for Syt-1 were only observed with 56 mM KCl, which also evokes the greatest increases in near-membrane Ca2+ (Figure 9, A and B). In fact, the 56 mM stimulation is more effective at activating Syt-1 than Syt-7, with 32% of docked Syt-1 granules fusing as compared with 25% of docked Syt-7 granules. These experiments demonstrate that activation of Syt isoforms is strongly Ca2+ dependent. Mild depolarization and small elevations in intracellular Ca2+ preferentially trigger Syt-7 granule fusion. Although higher elevations in Ca2+ activate both isoforms, it is the Syt-1 granules that fuse with greater frequency. We further examined the data in Figure 9B to determine whether the time between stimulus application and fusion was different for the two isoforms. As shown in Figure 9, C and D, we separated events into bins, with the first bin constituting events occurring within the first 5 s of the stimulus, the next between 5 and 10 s of the stimulus, and so on. With 25 mM KCl, although the total number of Syt-1 fusion events was small (51 events across 25 cells), ∼50% of the granules that fused did so within the first 10 s of the stimulus. Forty percent of Syt7–GFP granules fused in the same period (Figure 9C). More dramatic effects were observed with 56 mM KCl. With this stimulus, there was a significantly shorter time delay between KCl application and fusion for Syt-1 than Syt-7 in all the bins (Figure 9D). Indeed, almost 80% of Syt-1 granules fused within the first 10 s of the stimulus, compared with only 48% for Syt-7. Only 20% of docked Syt-1 granules fused 10 s or more after the stimulus, compared with 52% of Syt-7 granules. Thus, with a strongly depolarizing stimulus, Syt-1 granules not only fuse more readily than Syt-7 granules, they also tend to fuse earlier.
DISCUSSION The major findings of this study are that 1) synaptotagmin isoforms Syt-1 and Syt-7 are usually sorted to different secretory granules; 2) the isoforms drive different fusion modes of exocytosis, with Syt-1 favoring rapid and wide fusion pore expansion and Syt-7 slowing or limiting this process; 3) when Syt-1 drives fusion, lumenal and membrane constituents of the granule are released more rapidly and more thoroughly than when Syt-7 granules fuse; and 4) the isoforms are differentially activated by membrane depolarization and concomitant intracellular Ca2+ elevations. These results are summarized in Figure 10. This study began with the surprising observation that in bovine chromaffin cells, unlike PC12 cells (Zhang et al., 2011), there is little colocalization of synaptotagmin isoforms on secretory granules. Even with overexpression, both proteins are detected together on only a fraction of granules screened. A significant functional consequence of isoform segregation is that individual granules are endowed with unique Ca2+ sensitivities, allowing for rapid, local control of the fusion mode based on local Ca2+ levels. Thereby stimuli that differentially elevate cytosolic Ca2+ (Augustine and Neher, 1992; Garcia et al., 2006; Fulop and Smith, 2007; de Diego et al., 2008; Moghadam and Jackson, 2013) can differentially activate granules that will release only some (in the case of Syt-7) or more/all of their contents (in the case of Syt-1). There is consequently a strong Ca2+dependent component to pore expansion, which may be regulated by the synaptotagmins. Mild KCl depolarization (25 mM), which moderately elevates intracellular Ca2+, selectively triggers the fusion of docked Syt-7 Syt isoforms and exocytosis | 2421
global change in [Ca2+]i, both Syt-1 and Syt-7 fusion events are observed. Syt-1 granules, however, fuse more readily and fuse earlier than Syt-7 granules (Figure 9, B and D). Thus it is possible that both Syt-1 and Syt-7 granules are found in a ready releasable pool, with differences in their relative distances to Ca2+ channels/microdomains accounting for differences in their time courses of activation (Voets et al., 1999). Despite these similarities, absolute comparisons between electrophysiological and optical measurements are difficult to make for several reasons. For example, differences in release kinetics between the granule pools defined by capacitance are already apparent within tens of milliseconds after depolarization (Horrigan and Bookman, 1994; Voets et al., 1999). This undoubtedly reflects the ability of the electrophysiological approaches to measure early events. In our study, temporal differences in latency to fusion using the high-K+ stimulation are not apparent for at least 1 s to several seconds (Figure 9, C and D). In addition, the duration of imaged cavicapture events (Figure 4) is FIGURE 7: Syt-1 granules release lumenal contents more quickly than Syt-7 granules. (A) Fusion slower than the tens of milliseconds–long of a Syt-1-Cherry granule. CgB-pHluorin intensity increases (indicating fusion) at time 0.2 s “stand-alone feet” detected by amperome(within circled region). Syt-1 and CgB disperse quickly after fusion (dotted line). Note loss of fluorescence within circled region (A, B). (C) Syt-7 remains punctate after fusion (bottom). CgB is try (Zhou et al., 1996). Our data may be on released slowly. (D) Graphs for C. (E) On average, CgB is more rapidly released from fusing Syt-1 the time scale of longer stepwise capacirather than Syt-7 granules. n = 19 for Syt-1 plus CgB; n = 21 for Syt-7 plus CgB. After 2 s, tance changes measured by Lindau and averages ± SEM are significantly (*p < 0.05) different by Student’s t test. Scale bar, 960 nm. colleagues (Albillos et al., 1997) and “kissand-run” events in PC12 cells imaged by granules (Figure 9B). We define “docked” as a granule resident in Jackson, Chapman, and colleagues (Zhang et al., 2011). The reason the evanescent field for at least 10 s before the stimulus is applied. for these discrepancies is not clear. An answer will likely require a KCl 56 mM depolarization and correspondingly higher elevations in systematic comparison of optical and electrical measurements in the intracellular Ca2+ activate both isoforms but favor fusion of Syt-1 same group of cells or combinatorial approaches capable, for granules. In addition, with this stimulus, differences in the time of example, of imaging fusion at the same time as amperometric isoform activation become apparent. Specifically, the latency bedetection of catecholamine release (Hafez et al., 2005). tween KCl application and fusion is significantly shorter for Syt-1 Syt-1 and Syt-7 granules diverge not only in their depolarization than Syt-7. Almost 80% of docked Syt-1 granules fuse within 10 s of dependence of activation, but, as noted earlier, in the rate at which 56 mM KCl application as opposed to 48% of docked Syt-7 granules they release lumenal and membrane constituents. For instance, during the same period of time (Figure 9D). Syt-1 releases CgB with more rapid kinetics than Syt-7. Likewise, Syt-1 and Syt-7 are differentially responsive to the strength of VMAT-2 is released and spreads along the membrane after fusion of stimulation with varying time courses for activation even in response Syt-1 granules, with a diffusion coefficient (8.92 ± 1.61 × 10⁻² μm2/s, to the same depolarizing stimulus (56 mM KCl). One therefore wonn = 25) that is roughly 10 times that of Syt-1 itself. VMAT-2 diffusion ders whether Syt-1 and Syt-7 are the Ca2+ sensors for functionally out of Syt-7 granules, however, is negligible. The differences in distinct granule “pools.” Such pools are believed to account for the release properties result from the divergent postfusion fates of fused distinct kinetic components of membrane capacitance increases Syt-1 and Syt-7 granules. These fates were monitored with pTIRFM. evoked by depolarizing voltage pulses or flash photolysis of Ca2+ We previously used diI and polarized excitation light from a 514-nm (Neher and Zucker, 1993; Chow et al., 1994, 1996; Heinemann et al., laser to detect the rapid changes in membrane topology that occur 1994; Voets et al., 1999; Neher and Sakaba, 2008). The fast kinetic with granule fusion (Anantharam et al., 2010, 2011). In this study, the component of the capacitance burst is suggested to reflect an iminstrument setup was modified so that a polarized 561-nm beam mediately releasable pool (IRP) of granules, which require only mild excited the fluorescence of a different membrane probe—diD. DiD depolarization for release. Whereas there are important kinetic difwas used because its red-shifted emission spectrum enables twoferences between electrophysiological measurements and imaged color imaging studies requiring GFP or pHluorin, which the overlapsecretory responses, the selective activation of Syt-7 in response to ping emission spectra of diI and GFP/pHluorin all but preclude. Inmild KCl depolarization is qualitatively consistent with its sorting to deed, in earlier studies, two-color imaging was performed with diI the IRP. These granules may be closely localized to Ca2+ channels, and Cerulean (Anantharam et al., 2010). Although brighter than providing basal catecholamine secretion at a minimal metabolic excyan fluorescent protein, Cerulean has a lower extinction coefficient pense (Voets et al., 1999). With strong depolarization and a higher and quantum yield and exhibits decreased pH sensitivity compared 2422 | T. C. Rao et al.
Molecular Biology of the Cell
FIGURE 8: A granule membrane protein is released slowly from Syt-7 granules upon fusion. (A) VMAT2-pHluorin fluorescence rapidly disperses from fusing Syt-1 granules (within circled region). (B) Graph for A indicates Syt-1 intensity diminishes after fusion (dotted line), whereas VMAT2 intensity increases and then diminishes. (C, D) VMAT2 movement is restricted from fused Syt-7 granules (D). n = 24 for Syt-1 plus VMAT2; n = 17 for Syt-7 plus VMAT2. Averages ± SEM are significantly different after 1 s (*p < 0.05) by Student’s t test. Only negative (–) error bar is shown for VMAT2 plus Syt-7 and positive (+) error bar for VMAT2 plus Syt-1. Scale bar, 960 nm.
with pHluorin or even GFP (Rizzo et al., 2004). Most important, the modification we now introduced makes it possible to extract topological data from fusion events while directly monitoring the recycling kinetics of a protein of interest (e.g., Syt-1, Syt-7, VMAT-2, and CgB). This protein is fused to pHluorin and detects changes in lumenal pH that occur normally during cavicapture (i.e., reacidification) or when a fused granule is experimentally exposed to a low-pH extracellular solution (Anantharam et al., 2010). Our data show that when Syt-1 drives fusion, the overwhelming outcome is rapid curvature decay of the fused granule/plasma membrane domain. Indeed, 75% (27/36) of Syt-1 events show curvature decay to prefusion levels within 5 s of fusion. The overall probability of endocytosis is accordingly quite low. On the other hand, when Syt-7 drives fusion, indentations representing the fused granule can be remarkably stable. In the majority of cases, they were observed to persist for >80–90 s, the duration of the imaging protocol. Whether the indentation eventually collapses into the plasma membrane or is retrieved via a form of clathrin-dependent endocytosis that occurs at or near the site of fusion (Bittner et al., 2013) was not investigated. The divergent effects of the isoforms on fusion pore expansion may be a functional consequence of their distinct biochemistry. Syt-1 and Syt-7 exhibit different affinities for Ca2+ in the presence of Volume 25 August 15, 2014
phospholipid membranes. In biochemical assays, the Syt cytoplasmic domains are predicted to vary >10-fold in their [Ca2+]1/2 (15 s). of synaptotagmin and other regulators at For Syt-7 at 25 mM KCl, 48/371 (0–5 s), 99/371 (5–10 s), 150/371 (10–15 s), and 74/371 (>15 s). the fusion site. For Syt-1 at 56 mM KCl, 347/1089 (0–5 s), 529/1089 (5–10 s), 156/1089 (10–15 s), and 57/1089 Overall, this study provides strong evi(>15 s). For Syt-7 at 56 mM KCl, 103/662 (0–5 s), 217/662 (5–10 s), 265/662 (10–15 s), and dence that molecular heterogeneity, rather 77/662 (>15 s). Statistical differences between groups were calculated using the Student’s t test than homogeneity, may be a defining fea(*p < 0.05; ****p < 0.0001). ture of chromaffin cell secretory granules. Given that this is the case, the obvious question is, to what end? The implication here is that heterogeneity with respect to synaptotagmins provides cells with a tunable, Ca2+dependent mechanism to control and define the properties of regulated exocytosis. The regulation of the secretory response via synaptotagmin diversity and segregation may also be generalizable to other systems. The design is eminently scalable, so that for cells (e.g., neurons) that receive more complex stimuli, only a greater number of synaptotagmin isoforms is required to regulate release. FIGURE 10: On the basis of membrane topological data, measurements of endocytosis, and imaging of lumenal/membrane protein release, we propose that Syt isoforms favor different fusion modes in adrenal chromaffin cells. The isoforms themselves are preferentially activated by mild (Syt-7) and strong (Syt-1) depolarization. Postfusion topologies of Syt-1 granules are consistent with a rapid transition between an initial and wide pore (i → iii), thereby promoting the release of granule lumen and membrane constituents. On the other hand, postfusion topologies of Syt-7 granules indicate a slow transition between an initial and wide pore (i → ii), thereby restricting the release of granule lumen and membrane constituents. In addition, Syt-7 fusion events more frequently result in endocytosis at the site of fusion (i.e., cavicapture) than do Syt-1 events. 2424 | T. C. Rao et al.
MATERIALS AND METHODS Polarized total internal reflection fluorescence microscopy Detailed description for the specialized excitation system used to create the orthogonal p- and s-polarized 561-nm beams and further superimpose them onto the 488-nm beam is provided elsewhere (Anantharam et al., 2010). The system uses Lambda SC smart-shutter controllers (Sutter Instruments, Novato, CA) that allow for rapid selection of three shutter openings sequentially—p- and s-polarized 561 nm excitation and the 488-nm excitation (one at a time)—and repeats the cycle using MetaMorph software (Molecular Devices, Molecular Biology of the Cell
Sunnyvale, CA). The common beam path was focused through a custom side port to a side-facing filter cube placed below the objective turret of an Olympus IX81 (inverted) microscope (Center Valley, PA) to produce objective-based TIRF illumination. The dichroic mirror/emission filter cube combinations used for the experiments were as follows: z488/561 rpc and z488/561m_TIRF for syt-pHl/ DiD or CgB pHl/syt-Cherry imaging and z488/640 rpc and z488/640m for imaging antibody staining in TIRF (Chroma Technology, Brattleboro, VT). For directing the incident beam at ∼70° from the normal on the coverslip, the beam was focused on the periphery of the back focal plane of a 60×/1.49 numerical aperture (NA) oil immersion objective (Olympus), thereby giving a decay constant for the evanescent field of ∼110 nm. Two additional lenses (1.6× and 2×) in the emission path between the microscope and electron-multiplying charge-coupled device (EM CCD) camera give a final pixel size of ∼80 nm. Images were acquired using a cooled EM CCD camera (iXon3, Andor Technology, South Windsor, CT). The acquisition of the digital image was in synchrony with the opening of the smart shutters specific for the individual beams. The images were acquired at ∼5 Hz with 25-ms exposures and 300 gain (EM setting). One complete cycle of three exposures lasted ∼200 ms.
Chromaffin cell preparation and transfection The chromaffin cells were isolated from bovine adrenal medulla, and transient transfections were performed as described earlier (Wick et al., 1993). To facilitate cell adhesion, cells were plated on 35-mm tissue culture dishes with cover glass bottom (refractive index, 1.51; World Precision Instruments, Sarasota, FL) precoated with poly-dlysine and bovine collagen. Cells were transiently transfected by electroporation with plasmid(s) using the Neon transfection system (Invitrogen, Carlsbad, CA). The procedure for electroporation was standardized, and the cells were transfected with a single pulse of 1100 mV for a period of 40 ms. The Syt-1–pHluorin and Syt-7xpHluorin constructs in pCI vector were transfected alone in DiD experiments. The Syt-1–Cherry and Syt-7–Cherry constructs were cotransfected with CgB-pHluorin or VMAT2-pHluorin. The VMAT2-pHluorin plasmid was a gift from Robert Edwards (University of California, San Francisco, San Francisco, CA). Syt isoform sorting was determined in two ways: 1) expression of NPY-Cer alone, followed by immunocytochemistry using antibodies toward the Syt isoforms; or 2) cotransfection of Syt-1–Cherry, Syt-7–GFP, and NPY-Cer. The parent NPY plasmid was a gift from Wolfhard Almers (Vollum Institute, Oregon Health and Science University, Portland, OR). Stimulation-evoked surface distribution was visualized by TIRF microscopy of cells by coexpression of Syt-1–WT and myc-tagged Syt-7 (gift of Thomas Sudhof, Stanford University, Palo Alto, CA) with immunocytochemistry. All experiments were performed 2–5 d after transfection.
Cell stimulation Before imaging, cells were stained with diD added directly to cells bathed in PSS at 1:200 dilution. The cells were quickly washed several times in PSS to get rid of the excessive dye and then used immediately. All TIRF experiments were performed in PSS containing 145 mM NaCl, 5.6 mM KCl, 2.2 mM CaCl2, 0.5 mM MgCl2, 5.6 mM glucose, and 15 mM 4-(2-hydroxyethyl)-1-piperazineethanesulfonic acid (HEPES), pH 7.4. A computer-controlled perfusion system, ALA-VM4 (ALA Scientific Instruments, Westbury, NY), was used to perfuse individual cells with a needle (100-μm inner diameter) under positive pressure. Normally, cells were perfused with PSS for 10 s and then stimulated with high-K+-containing solution to secrete (95 mM NaCl, 56 mM KCl, 5 mM CaCl2, 0.5 mM MgCl2, 5.6 mM Volume 25 August 15, 2014
glucose, 15 mM HEPES, pH 7.4) for ∼60 s to trigger exocytosis. Endocytosis was measured as previously described (Anantharam et al., 2011). Briefly, cells were first perfused with elevated-K+ PSS at pH 7.4 for 30 s and then exposed to pH 5.5 PSS (HEPES was substituted by 2-(N-morpholino)ethanesulfonic acid buffer) to quench the fluorescence of any extracellular facing pHl. The cells were then again exposed to normal PSS at pH 7.4, and the cycle was repeated every 10 s. Bafilomycin (Santa Cruz Biotechnology, Santa Cruz, CA), an inhibitor of vacuolar-type H+-ATPase that reacidifies endocytosed granules, was added to PSS at a final concentration of 5 μM. Experiments were performed at ambient temperatures of 30–32°C.
Image analysis The Syt-pHluorin, diD s- and p-polarization emission images were captured sequentially using MetaMorph software. The P/S and P + 2S ratios were calculated after normalization on a pixel-to-pixel basis for every image, and custom software written in IDL (ITT, Boulder, CO) was used to align the transformations to the Syt-pHluorin images. Individual granules undergoing exocytosis were evident by increase in the pHluorin intensity after fusion with the plasma membrane as a result of change in pH of the granule. The P/S and P + 2S changes were calculated by centering the region of interest over localized increase in P/S ratio at the site of exocytosis in a radius of ∼240 nm. Multiple factors, such as relative intensities of the p- and s-polarized excitations, biases in optical system, and certain interference fringes, can result in variations in the P/S ratio. To reduce this discrepancy and further allow for a theoretical comparison, a solution of 10 mM rhodamine 6G (Invitrogen), a dye predicted to be randomly oriented, was used to normalize the P/S data from DiD emission. The spatial mean of rhodamine 6G emission excited by each of the p- and s-polarized 561-nm beams was used for normalization of data. Similarly, for correcting the P + 2S values, the amplitudes of p relative to s were calculated by calibration of rhodamine 6G. Topological changes were considered significant if P/S and P + 2S increased above 7% (3× SD of the mean) with respect to baseline within five frames of the fusion event (indicated by pHluorin or GFP intensity changes). Emission intensity changes that did not cross the 7% threshold were not included in the data set for analysis. The average fluorescence change of gCaMP5G in response to different depolarizing stimuli (10, 25, and 56 mM KCl) was estimated not as [Ca2+], but as the pseudoratio ∆F/F = (F − Fbase)/(Fbase − B), where F is the measured fluorescence intensity of the genetically encoded Ca2+ indicator, Fbase the fluorescence intensity of the Ca2+ indicator in the cell before stimulation, and B the background signal determined from the average of areas adjacent to the cell.
Immunocytochemistry For immunofluorescence microscopy to detect synaptotagmin isoform distribution in cells expressing NPY Cerulean, isolated chromaffin cells on the glass cover dish were fixed with 4% paraformaldehyde in phosphate-buffered saline (PBS) for 30 min. The cells were then rinsed and quenched with 50 mM NH4Cl in PBS. After washing, the cell membrane was permeabilized for 7 min with acetone to preserve the cell cytoskeleton. The cells were further washed with Tris-buffered saline (TBS) and blocked with 1% gelatin in TBS and 4% donkey serum for 30 min each. Primary and secondary antibodies were diluted in a solution of 2–4 mg/ml BSA. Cells were incubated for 2 h at room temperature with a combination of the following antibodies: monoclonal anti–Syt-1 antibody (antibody 41.1) and polyclonal anti-Syt-7 antibody (Synaptic Systems, Göttingen, Germany). The cells were then washed five times in TBS and incubated for 70 min with Alexa-conjugated anti-rabbit and anti-mouse Syt isoforms and exocytosis | 2425
secondary antibodies (Molecular Probes/Invitrogen, Eugene, OR). The cells were washed five times after the incubation and imaged by confocal microscopy. Alternatively, to visualize the stimulation-evoked surface distribution of the Syt isoforms, the cells expressing Syt-1 WT and myctagged Syt-7 were first washed with PSS at room temperature, followed by stimulation with either a high-K+-containing PSS solution (56 mM KCl) or low-K+-containing PSS solution (10 mM KCl) for 1 min at room temperature. All activity within the cell after stimulation was arrested using cold PSS. The cells were further incubated with the following antibodies for 2 h on ice (4°C): monoclonal anti– Syt-1 antibody and myc-tag antibody for Syt-7 (Cell Signaling Technology, Danvers, MA). The cells were washed five times with TBS and then fixed at 37°C using the procedure described. After blocking, the cells were stained by incubation with Alexa-conjugated antirabbit and anti-mouse secondary antibodies (Molecular Probes/Invitrogen) for 70 min at room temperature as previously described.
Confocal microscopy For transfected and immunostained cells showing a fluorescence signal, images were acquired on a Leica TCS SP5 confocal microscope with a 63×/1.40 NA oil objective. For imaging, a 405-nm diode laser, an argon 488-nm laser, and a HeNe red 594-nm laser were used. The images obtained were analyzed with ImageJ software (National Institutes of Health, Bethesda, MD). Statistical calculations were performed using Prism 6 software (GraphPad, La Jolla, CA).
ACKNOWLEDGMENTS We thank Ronald W. Holz, Daniel Axelrod, and Mary Bittner for helpful suggestions on all aspects of this study. We also thank James T. Taylor, Johan Edvinsson, Rachel L. Aikman, and Praneeth Katrapati for technical assistance. This research was supported by National Institutes of Health Grant MH 61876 (to E.R.C.), American Heart Association Grant 13SDG14420049, and start-up funds from Wayne State University (to A.A.).
REFERENCES
Albillos A, Dernick G, Horstmann H, Almers W, Alvarez de Toledo G, Lindau M (1997). The exocytotic event in chromaffin cells revealed by patch amperometry. Nature 389, 509–512. Allersma MW, Wang L, Axelrod D, Holz RW (2004). Visualization of regulated exocytosis with a granule-membrane probe using total internal reflection microscopy. Mol Biol Cell 15, 4658–4668. Anantharam A, Bittner MA, Aikman RL, Stuenkel EL, Schmid SL, Axelrod D, Holz RW (2011). A new role for the dynamin GTPase in the regulation of fusion pore expansion. Mol Biol Cell 22, 1907–1918. Anantharam A, Onoa B, Edwards RH, Holz RW, Axelrod D (2010). Localized topological changes of the plasma membrane upon exocytosis visualized by polarized TIRFM. J Cell Biol 188, 415–428. Andrews NW, Chakrabarti S (2005). There’s more to life than neurotransmission: the regulation of exocytosis by synaptotagmin VII. Trends Cell Biol 15, 626–631. Augustine GJ, Neher E (1992). Calcium requirements for secretion in bovine chromaffin cells. J Physiol 450, 247–271. Bai J, Wang CT, Richards DA, Jackson MB, Chapman ER (2004). Fusion pore dynamics are regulated by synaptotagmin*t-SNARE interactions. Neuron 41, 929–942. Berberian K, Torres AJ, Fang Q, Kisler K, Lindau M (2009). F-actin and myosin II accelerate catecholamine release from chromaffin granules. J Neurosci 29, 863–870. Bhalla A, Tucker WC, Chapman ER (2005). Synaptotagmin isoforms couple distinct ranges of Ca2+, Ba2+, and Sr2+ concentration to SNARE-mediated membrane fusion. Mol Biol Cell 16, 4755–4764. Bittner MA, Aikman RL, Holz RW (2013). A nibbling mechanism for clathrinmediated retrieval of secretory granule membrane after exocytosis. J Biol Chem 288, 9177–9188.
2426 | T. C. Rao et al.
Brose N, Petrenko AG, Südhof TC, Jahn R (1992). Synaptotagmin: a calcium sensor on the synaptic vesicle surface. Science 256, 1021–1025. Chakrabarti S, Kobayashi KS, Flavell RA, Marks CB, Miyake K, Liston DR, Fowler KT, Gorelick FS, Andrews NW (2003). Impaired membrane resealing and autoimmune myositis in synaptotagmin VII-deficient mice. J Cell Biol 162, 543–549. Chan SA, Doreian B, Smith C (2010). Dynamin and myosin regulate differential exocytosis from mouse adrenal chromaffin cells. Cell Mol Neurobiol 30, 1351–1357. Chow RH, Klingauf J, Heinemann C, Zucker RS, Neher E (1996). Mechanisms determining the time course of secretion in neuroendocrine cells. Neuron 16, 369–376. Chow RH, Klingauf J, Neher E (1994). Time course of Ca2+ concentration triggering exocytosis in neuroendocrine cells. Proc Natl Acad Sci USA 91, 12765–12769. Damase-Michel C, Tavernier G, Giraud P, Montastruc JL, Montastruc P, Tran MA (1993). Effects of clonidine, dihydralazine and splanchnic nerve stimulation on the release of neuropeptide Y, MET-enkephalin and catecholamines from dog adrenal medulla. Naunyn-Schmiedeberg’s Arch Pharmacol 348, 379–384. de Diego AM, Gandia L, Garcia AG (2008). A physiological view of the central and peripheral mechanisms that regulate the release of catecholamines at the adrenal medulla. Acta Physiol (Oxf) 192, 287–301. Doreian BW, Fulop TG, Smith CB (2008). Myosin II activation and actin reorganization regulate the mode of quantal exocytosis in mouse adrenal chromaffin cells. J Neurosci 28, 4470–4478. Edwards AV, Jones CT (1993). Autonomic control of adrenal function. J Anat 183, 291–307. Engisch KL, Nowycky MC (1998). Compensatory and excess retrieval: two types of endocytosis following single step depolarizations in bovine adrenal chromaffin cells. J Physiol 506, 591–608. Fukuda M (2004). RNA interference-mediated silencing of synaptotagmin IX, but not synaptotagmin I, inhibits dense-core vesicle exocytosis in PC12 cells. Biochem J 380, 875–879. Fukuda M, Kanno E, Satoh M, Saegusa C, Yamamoto A (2004). Synaptotagmin VII Is targeted to dense-core vesicles and regulates their Ca2+dependent exocytosis in PC12 cells. J Biol Chem 279, 52677–52684. Fukuda M, Kowalchyk JA, Zhang X, Martin TFJ, Mikoshiba K (2002). Synaptotagmin IX regulates Ca2+-dependent secretion in PC12 cells. J Biol Chem 277, 4601–4604. Fulop T, Doreian B, Smith C (2008). Dynamin I plays dual roles in the activity-dependent shift in exocytic mode in mouse adrenal chromaffin cells. Arch Biochem Biophys 477, 146–154. Fulop T, Smith C (2007). Matching native electrical stimulation by graded chemical stimulation in isolated mouse adrenal chromaffin cells. J Neurosci Methods 166, 195–202. Fulop T, Radabaugh S, Smith C (2005). Activity-dependent differential transmitter release in mouse adrenal chromaffin cells. J Neurosci 25, 7324–7332. Garcia AG, Garcia-De-Diego AM, Gandia L, Borges R, Garcia-Sancho J (2006). Calcium signaling and exocytosis in adrenal chromaffin cells. Physiol Rev 86, 1093–1131. Gonzalez-Jamett AM, Baez-Matus X, Hevia MA, Guerra MJ, Olivares MJ, Martinez AD, Neely A, Cardenas AM (2010). The association of dynamin with synaptophysin regulates quantal size and duration of exocytotic events in chromaffin cells. J Neurosci 30, 10683–10691. Gonzalez-Jamett AM et al. (2013). Dynamin-2 regulates fusion pore expansion and quantal release through a mechanism that involves actin dynamics in neuroendocrine chromaffin cells. PLoS One 8, e70638. Hafez I, Kisler K, Berberian K, Dernick G, Valero V, Yong MG, Craighead HG, Lindau M (2005). Electrochemical imaging of fusion pore openings by electrochemical detector arrays. Proc Natl Acad Sci USA 102, 13879–13884. Heinemann C, Chow RH, Neher E, Zucker RS (1994). Kinetics of the secretory response in bovine chromaffin cells following flash photolysis of caged Ca2+. Biophys J 67, 2546–2557. Horrigan FT, Bookman RJ (1994). Releasable pools and the kinetics of exocytosis in adrenal chromaffin cells. Neuron 13, 1119–1129. Hui E, Bai J, Wang P, Sugimori M, Llinas RR, Chapman ER (2005). Three distinct kinetic groupings of the synaptotagmin family: candidate sensors for rapid and delayed exocytosis. Proc Natl Acad Sci USA 102, 5210–5214. Jaiswal JK, Chakrabarti S, Andrews NW, Simon SM (2004). Synaptotagmin VII restricts fusion pore expansion during lysosomal exocytosis. PLoS Biol 2, E233. Molecular Biology of the Cell
Jaiswal JK, Rivera VM, Simon SM (2009). Exocytosis of post-Golgi vesicles is regulated by components of the endocytic machinery. Cell 137, 1308–1319. Lynch KL, Martin TFJ (2007). Synaptotagmins I and IX function redundantly in regulated exocytosis but not endocytosis in PC12 cells. J Cell Sci 120, 617–627. Moghadam PK, Jackson MB (2013). The functional significance of synaptotagmin diversity in neuroendocrine secretion. Front Endocrinol 4, 124. Neco P, Fernandez-Peruchena C, Navas S, Lindau M, Gutierrez LM, Alvarez de Toledo G, Ales E (2008). Myosin II contributes to fusion pore expansion during exocytosis. J Biol Chem 283, 10949–10957. Neher E, Sakaba T (2008). Multiple roles of calcium ions in the regulation of neurotransmitter release. Neuron 59, 861–872. Neher E, Zucker RS (1993). Multiple calcium-dependent processes related to secretion in bovine chromaffin cells. Neuron 10, 21–30. Perrais D, Kleppe IC, Taraska JW, Almers W (2004). Recapture after exocytosis causes differential retention of protein in granules of bovine chromaffin cells. J Physiol Online 560, 413–428. Rizzo MA, Springer GH, Granada B, Piston DW (2004). An improved cyan fluorescent protein variant useful for FRET. Nat Struct Biol 22, 445–449. Schonn JS, Maximov A, Lao Y, Sudhof TC, Sorensen JB (2008). Synaptotagmin-1 and -7 are functionally overlapping Ca2+ sensors for exocytosis in adrenal chromaffin cells. Proc Natl Acad Sci USA 105, 3998–4003. Sugita S, Shin OH, Han W, Lao Y, Sudhof TC (2002). Synaptotagmins form a hierarchy of exocytotic Ca(2+) sensors with distinct Ca(2+) affinities. EMBO J 21, 270–280. Sun T et al. (2010). The role of calcium/calmodulin-activated calcineurin in rapid and slow endocytosis at central synapses. J Neurosci 30, 11838–11847. Taraska JW, Almers W (2004). Bilayers merge even when exocytosis is transient. Proc Natl Acad Sci USA 101, 8780–8785. Taraska JW, Perrais D, Ohara-Imaizumi M, Nagamatsu S, Almers W (2003). Secretory granules are recaptured largely intact after stimulated exocytosis in cultured endocrine cells. Proc Natl Acad Sci USA 100, 2070–2075. Tucker WC, Edwardson JM, Bai J, Kim HJ, Martin TF, Chapman ER (2003). Identification of synaptotagmin effectors via acute inhibition of secretion from cracked PC12 cells. J Cell Biol 162, 199–209.
Volume 25 August 15, 2014
Tucker WC, Weber T, Chapman ER (2004). Reconstitution of Ca2+-regulated membrane fusion by synaptotagmin and SNAREs. Science 304, 435–438. Voets T, Moser T, Lund PE, Chow RH, Geppert M, Sudhof TC, Neher E (2001). Intracellular calcium dependence of large dense-core vesicle exocytosis in the absence of synaptotagmin I. Proc Natl Acad Sci USA 98, 11680–11685. Voets T, Neher E, Moser T (1999). Mechanisms underlying phasic and sustained secretion in chromaffin cells from mouse adrenal slices. Neuron 23, 607–615. Wang CT, Bai J, Chang PY, Chapman ER, Jackson MB (2006). Synaptotagmin-Ca2+ triggers two sequential steps in regulated exocytosis in rat PC12 cells: fusion pore opening and fusion pore dilation. J Physiol 570, 295–307. Wang CT, Grishanin R, Earles CA, Chang PY, Martin TFJ, Chapman ER, Jackson MB (2001). Synaptotagmin modulation of fusion pore kinetics in regulated exocytosis of dense-core vesicles. Science 294, 1111–1115. Wang CT, Lu JC, Bai J, Chang PY, Martin TF, Chapman ER, Jackson MB (2003). Different domains of synaptotagmin control the choice between kiss-and-run and full fusion. Nature 424, 943–947. Wang P, Chicka MC, Bhalla A, Richards DA, Chapman ER (2005). Synaptotagmin VII is targeted to secretory organelles in PC12 cells, where it functions as a high-affinity calcium sensor. Mol Cell Biol 25, 8693–8702. Wick PW, Senter RA, Parsels LA, Holz RW (1993). Transient transfection studies of secretion in bovine chromaffin cells and PC12 cells: generation of kainate-sensitive chromaffin cells. J Biol Chem 268, 10983–10989. Zanin MP, Mackenzie KD, Peiris H, Pritchard MA, Keating DJ (2013). RCAN1 regulates vesicle recycling and quantal release kinetics via effects on calcineurin activity. J Neurochem 124, 290–299. Zhang Z, Wu Y, Wang Z, Dunning FM, Rehfuss J, Ramanan D, Chapman ER, Jackson MB (2011). Release mode of large and small dense-core vesicles specified by different synaptotagmin isoforms in PC12 cells. Mol Biol Cell 22, 2324–2336. Zhou Z, Misler S, Chow RH (1996). Rapid fluctuations in transmitter release from single vesicles in bovine adrenal chromaffin cells. Biophys J 70, 1543–1552.
Syt isoforms and exocytosis | 2427