VISUAL AND USEFUL SOFTWARE FOR PID CONTROLLER DESIGN M. Bakoˇsov´ a, J. Oravec Slovak University of Technology in Bratislava, Faculty of Chemical and Food Technology, Institute of Information Engineering, Automation and Mathematics Abstract The new version of software PIDTOOL has been developed. The software is focused mainly on simple and fast PID controller tuning for SISO controlled systems. A wide scale of experimental and analytical methods is implemented in the software. Actually, the software enables to user to choose up to seventy various controllers. User can compare the quality of the tuned controller by simulation of control. The set-point tracking and disturbance rejection can be evaluated. Influence of input constraints can be analyzed and integral antiwindup configuration can be checked. The control performance and control input trajectories are evaluated to analyze the quality in a visual way. The calculated quality criteria enable to judge the control performance analytically from various viewpoints. The robustness of the tuned controller can be checked by modifying the parameters of the controlled model as the influence of uncertainties. The obtained parameters are stored and can be processed into a visual summary table. It enables to compare and judge the quality of various considered control scenarios. In case, the model of controlled process is unknown, the software enables to run step-response-based identification of aperiodic and damped periodic processes. The software enables to use filtration or identification tuning to increase the quality of identification. The software has been developed in MATLAB-Simulink programing environment and uses its graphical user interface to make software more user friendly. Languages of graphical user interface are English and Slovak. The properties of the software determines its usage especially for teaching purposes. It is used for teaching at the IIEAM FCFT STU in courses oriented on process control.
1
Introduction
The aim of this paper is to present a new version of software for PID controller tuning called PIDTOOL 2.0 [11], [2]. It has been developed at the Institute of Information Engineering, Automation, and Mathematics of the FCFT SUT in Bratislava [21], [11] in the MATLAB – Simulink programming environment and uses its graphic user interface (GUI). The PID controllers still belong to the most used type of feedback controllers in industry, due to the structural simplicity, robustness, not demanding design and ease of implementation [16], [15], [5], [23], [20], [19], [13]. Considering the feedback control scenario, the PID controller should be tried as the first solution, because they are suitable to control wide range of processes in effective way [15]. Increased implementation of model predictive control often requires well tuned PID controllers at the basic level to manage fast interactions [15]. In case the feedback is used, there is a threat that the closed–loop system will become unstable [15]. Hence, the primary requirements are stability, robustness and simple handling [15]. The software PIDTOOL 2.0 is oriented mainly on PID controller tuning. The software enables to tune PID controllers using various analytical and experimental methods, and new methods described in [9], [26], [14], [1], [8], [10], [22], [7], [25], [18], [3], [6], and [24] were added. If a transfer function of the controlled process is unknown, this software enables to identify the controlled process from its step response [4]. The identified step response can be either dumped periodic or aperiodic. The step–response data can be set directly or loaded from the data file. If noisy step–response data have been loaded, designed software enables to run filtration. Properties of the tuned controller can be judged visually and analytically, as PIDTOOL 2.0 displays simulated control response, time
behavior of the manipulated variable and values of various integral performance indexes. So, it is easy to compare several closed–loop step responses generated using various PID controllers with different values of set-points, disturbances and constraints on manipulated variables. The software PIDTOOL 2.0 can be used especially for teaching purposes in laboratory exercises oriented on process control. It can be also useful for those who need to identify controlled process from its step–response data, to filter noisy data, to tune PID controllers or to compare various types of control algorithms with simple PID control.
2
PIDTOOL 2.0
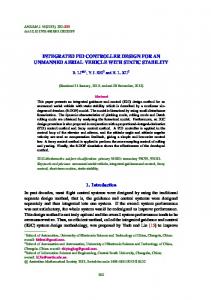
PIDTOOL 2.0 solves two basic problems, identification and controller tuning (Fig. 1). The software enables to identify a controlled process from its step response. The software distinguishes identification from an aperiodic or a dumped periodic step response.
Figure 1: Basic window of PIDTOOL 2.0
Figure 2: Basic window of identification
The Strejc method [1], [8], [7] is applied for identification from the aperiodic step response and the method described in [8] is used for identification from the dumped periodic step response. The result of identification is a controlled process model described by the transfer function (1) for aperiodic or (2) for dumped periodic step response G(s) = G(s) =
2 s2 Tpe
K e−Ds (T s + 1)n
(1)
K e−Dpe s + 2ξpe Tpe s + 1
(2)
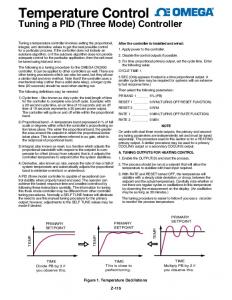
where n is the order of the system, K is the gain, T and Tpe represent the time constant, ξpe is the dumping coefficient, D and Dpe represent the time delay. The identification can be simply started using button Identification located in the basic window (Fig. 1). The next window (Fig. 2) offers three identification possibilities. The first button Step Response Data enables to identify the controlled process directly from data obtained from the measured and recorded step response. The second button Load the Data File serves to run identification from the data stored in external datafile. The third button Process Model Data enables to identify process model with required properties of transfer function. For detail information of using the possibilities of the button Step Response Data and button Process Model Data see [12]. Using the second button Load the Data File (Fig. 2) opens the new window (Fig. 3), where user can comfortably find out a required data file containing recorded step– response data. PIDTOOL 2.0 enables to load the data file which includes not only the column vectors of time and output variable, but also the third vector of manipulated variable (Fig. 4). If several step responses are included in the loaded data file, they are automatically recognized and the nominal step response is evaluated (Fig. 5). It enables to reach the nominal transfer
function of identified non-linear controlled process. This possibility makes the identification from step response using this software even user–friendlier.
Figure 3: Window for loading the datafile
Figure 4: Step response data loaded from external datafile
Figure 5: sponses
Nominal and normalized step re-
In the next window, there is a choice of data processing (Fig. 6). To obtain the aperiodic model of controlled process, user can directly use the button Identification. When the dumped periodic model is required, user can simply activate the checkbox Periodic process and then use the button Identification. If the controlled process has been identified using the Strejc method, the tangent to the step response is also depicted and its equation is given (Fig. 7). In the new window, the parameters of model (1) or (2) of identified process are shown (Fig. 8, Fig. 9).
Figure 6: Choice of processing of loaded data
Figure 7: Step response of identified process
Figure 8: Identified parameters of aperiodic system
Figure 9: Identified parameters of dumped periodic system
Figure 10: Additional options of identification The new parameters of identified transfer function are directly shown. It helps to check whether the identified transfer function has still required properties, e.g. the order n. If the loaded data are noisy, the user can use the filtration before identification, simply using the button Filtration (Fig. 6). Then the new window for filtration is opened (Fig. 11). By using the button Save (Fig. 11), user can simply store reached filtered data into the new data file for later usage. After filtration, identification can be started.
Figure 11: Window of filtration
Figure 12: Window for PID controller tuning
The software PIDTOOL 2.0 is oriented mainly on PID controller tuning. PID controllers can be designed for controlled process models with either dumped periodic or aperiodic step responses described by the transfer functions (1) or (2). To run direct controller tuning, user can use the button Controller Tuning located in the basic window (Fig. 1), or use this button after identification (Fig. 9, Fig. 8). Then, a window is opened where the user can choose a required type of PID controller and a type of a tuning method (Fig. 12).
Figure 13: List of experimental methods used for PI controller tuning
Figure 14: List of analytical methods used for PID controller tuning
It is possible to choose a P, PI, PID or PD controller. In case the zero offset is not required or the process model contains the integrator, the integral part could be omitted [3], [22], [15]. In case the time delay D is relatively large subject to the model time constant T , or if the controlled process is described using model of first order transfer function, the derivative part could be omitted [15]. For simpler handling, the methods for controller tuning are divided into two main groups: analytical and experimental methods. Various types of analytical (Fig. 14) and experimental (Fig. 13) methods can be used for controller tuning. In case, the controller design algorithm requires the additional controller tuning parameter, the new window is opened. Most of the parameters have the preset values to make controller tuning more comfortable. For example the analytical pole–placement method requires setting of the reference polynomial [8]. Software enables user to use standard reference polynomials, such as binomic, Butterworth, minimum t5% , minimum ITAE criterium using simple popup menu (Fig. 15). Naslin method [8] requires setting the value of maximal overshoot (Fig. 16). Method based on gain and phase margin [25] requires setting the values of the phase in degrees and gain margin in decibels (Fig. 18). These parameters have preset values. The experimental Rivera–Morari method [10] requires the value of closed–loop time constant T CL (Fig. 17). The important values are displayed to simplify the calculations. Evaluated parameters of the tuned controller are shown in the new window (Fig. 19), where Z R is the gain, T I is the reset time and T D is the derivative time of the controller. In the top right part of the opened window (Fig. 19), the parameters of the transfer function of the controlled process are also shown. These parameters can be modified and the tuned controller can be so tested in the presence of model uncertainty. The properties of the closed loop with the tuned controller can be judged by simulation of control. Using the button Step Response (Fig. 19) runs quality evaluation of control. The set–point tracking and the disturbance rejection can be simulated in the presence of boundaries on the control input. For simpler handling, the parameters have preset default values. In the case, the manipulated variable is constrained, user can compare the closed-loop step responses and the time behaviors of the manipulated variable before and after the saturation. After simulation, the closed–loop step responses (Fig. 20) and the time behaviors of the manipulated variable (Fig. 21) are shown. In the case the legend
Figure 15: Choice of the standard polynomial using analytical pole placement method
Figure 16: Choice of the maximal overshoot using analytical Naslin method
Figure 17: Parameter setting using experimental Rivera – Morari method
Figure 18: Parameter setting using analytical method based on gain and phase margin
overlaps the displayed graph (Fig. 20), it is possible to deactivate the checkbox Legend and to hide the shown legend. Using the checkbox Grid leads to displaying the grid of the shown graph. Both of these possibilities are included in all displayed graphs, generated by this software. The quality of control (Fig. 22) can by also judged by calculating several integral performance indexes [8], [3], [26], [15], [11], [21]. Using the possibilities of window shown in Fig. 19, it is easy to compare several step responses and values of performance indexes reached with different values of set–points, disturbances and constraints on the manipulated variables. The values of all the parameters, which are necessary for simulations are stored by PIDTOOL 2.0. Calculated values of performance indexes are also stored. These stored data can be simply shown by using Setup/Show results located in basic window (Fig. 23). The stored data are transformed into html-file. The stored data are shown in simple summary table with date and time of simulation. This new ability can be helpful in the case, when many simulations at different conditions have been evaluated and user wants to compare obtained results to make decision, which controller is the most suitable for control. It is easy to change a language of graphic user interface. Actually, there is a possibility to choose between English and Slovak language (Fig. 23). Also other languages can be simply added into the software PIDTOOL 2.0.
3
Conclusion
The software PIDTOOL 2.0 has been developed in the MATLAB R13 v6.5– Simulink v5.0 programming environment using its Graphical User Interface and offers to the user a comfort-
Figure 19: Window for evaluating the quality of control
Figure 20: Closed–loop step response
Figure 21: Control input
able and visual environment for fast identification, simple PID controller tuning and effective evaluating the quality of control in various conditions. The values necessary for evaluating the quality of control and calculated quality criteria are stored and can be displayed in a simply summary table. Using this new ability helps to decide, which controller is the most suitable for control. This software has been tested by students at the FCFT in two courses; in the course Process Dynamics and Control that is taught in the first year of the Master study and the course Integrated Control in the Process Industry that is taught in the third year of the Bachelor study. Using the software is limited especially for a teaching purposes. There exist various software applications, which enables to design the PID controller, for example see [7], [17] or [27]. The comparison of the available applications will be subject of our next work.
Acknowledgments The authors are pleased to acknowledge the financial support of the Cultural and Educational Grant Agency KEGA of the Slovak Republic under grant No. 3/7245/09 and of the Scientific Grant Agency VEGA of the Slovak Republic under the grants 1/0537/10.
Figure 22: Values of performance indexes
Figure 23: Setup menu of PIDTOOL 2.0
References [1] M. Bakoˇsov´a and M. Fikar. Process Control (in Slovak). STU Press, Bratislava, 2008. [2] M. Bakoˇsov´a and J. Oravec. Software for PID controller tuning. V Proceedings of the 17th Interantional Conference on Porcess Control’09, FCFT SUT in Bratislava, pages 524–527, 2009. ˇ Cirka, ˇ [3] M. Bakoˇsov´a, L. and M. Fikar. Automatic control fundaments (in Slovak). Vydavateˇlstvo STU, 1st ed. edition, 2003. [4] M. Fikar and J. Mikleˇs. System identification (in Slovak). STU Press, Bratislava, 1999. [5] Onur Karasakal, Mujde Guzelkaya, Ibrahim Eksin, and Engin Yesil. An error-based on-line rule weight adjustment method for fuzzy PID controllers. Expert Systems with Applications, 38:10124–10132, 2011. [6] S. Kub´ık and Z. Kotek. Automatic control theory (in Czech). SNTL, 1st ed. edition, 1983. [7] J. Loˇsonsk´ y. System for support of control loops (in Slovak). Master’s thesis, Trnava: MTF SUT in Bratislava, 2006. [8] J. Mikleˇs and M. Fikar. Process Modelling, Identification, and Control. Springer Verlag, Berlin Heidelberg, 2007. [9] Aidan O’Dwyer. Handbook of PI and PID controller tuning rules. Imperial College Press, 3rd ed. edition, 2009. [10] B.A. Ogunnaike and W. H. Ray. Process dynamics, modeling and control. Oxford University Press, New York, 1994. [11] J. Oravec. Design of a program system for controller tuning (in slovak). Master’s thesis, FCFT SUT in Bratislava, 2010. [12] J. Oravec and M. Bakoˇsov´a. PIDTOOL - Software for PID Controller Tuning. In Technical Computing Bratislava 2010, volume 18, 2010. [13] Rames C. Panda. Synthesis of PID controller for unstable and integrating processes. Chemical Engineering Science, 64:2807–2816, 2009.
[14] K. ˚ Astr¨ om and T. H¨agglund. PID controllers: theory, design and tuning. Triangle Park, 2nd ed. edition, 1995. [15] K. J. ˚ Astr¨ om and T. H¨agglund. The future of PID control. Control Engineering Practice, 9:1163–1175, 2001. [16] K. J. ˚ Astr¨ om and T. H¨agglund. Revisiting the Ziegler–Nichols step response method for PID control. Journal of Process Control, 14:635–650, 2004. ˇ [17] M. Schlegel and M. Cech. Internet PID controller design : www.pidlab.com. IBCE 04, pages 1–6, 2004. [18] J. A. Shaw. The PID Control Algorithm [online]. http://www.docstoc.com/docs/20312583, 2nd ed., version 2.2 edition, 2006. [19] Jing-Chung Shen. New tuning method for PID controller. ISA Transactions, 41:473–484, 2002. [20] Rosario Toscano and Patrick Lyonnet. Robust PID controller tuning based on the heuristic Kalman algorithm. Automatica, 45:2099–2106, 2009. ˇ [21] L. Cemanov´ a. Design of GUI for controller tuning (in Slovak). Master’s thesis, FCFT SUT in Bratislava, 2007. [22] A. V´ıteˇckov´a and M. V´ıteˇcek. Automatic control fundamentals (in Czech). TU Ostrava, 2006. [23] Damir Vranˇci´c, Stanko Strmˇcnik, Juˇs Kocijan, and P.B. de Moura Oliveira. Improving disturbance rejection of PID controllers by means of the magnitude optimum method. ISA Transactions, 49:47–56, 2010. ˇ ˇ [24] B. Sulc and M. V´ıteˇckov´a. Theory and praxis of control design (in Czech). CVUT Press, Praha, 2004. [25] K. H. Weng, C. H. Chang, and S. C. Lisheng. Tuning of PID Controllers Based on Gain and Phase Margin Specifications. Pergamon, Automatica, 31(3):497–502, 1995. [26] D. Xue and Y. Q. Chen. Analysis and Design with MATLAB (Advanced in Design and Control). Society for Industrial Mathematics, 1st ed. edition, 2008. [27] J. Z´ avack´a. Design of robust PID controllers for chemical processes with parametric uncer´ tainties. PhD thesis, UIAM FCHPT STU v Bratislave, Radlinsk´eho 9, 812 37 Bratislava, 28.06.2011 2011.
Monika Bakoˇsov´a
[email protected] Juraj Oravec
[email protected]