Jun Lee, William R. Hazelwood & Sy-Miaw Lin, who have been involved in the implementation and testing of Indiana University's visualization tool kit.
Börner, Katy, Penumarthy, Shashikant, DeVarco, Bonnie Jean and Kerney, Carol. (2005) Visualizing Social Patterns in Virtual Environments on a Local and Global Scale. In Peter van den Besselaar & Satoshi Koizumi (Eds), Digital Cities III. Information Technologies for Social Capital: Cross-cultural Perspectives, Lecture Notes in Computer Science, Vol. 3081. Springer Verlag, pp. 325-340.
Lecture Notes in Computer Science
1
Visualizing Social Patterns in Virtual Environments on a Local and Global Scale Katy Börner 1, Shashikant Penumarthy2, and Bonnie Jean DeVarco3, Carol Kerney4 1
School of Library and Information Science, Indiana University 10th Street & Jordan Avenue, Bloomington, IN 47405, USA http://ella.slis.indiana.edu/~katy 2 Computer Science, Indiana University, Bloomington, IN 47405, USA 3 MediaTertia, 821 Walnut Ave., Santa Cruz, CA. 95060, USA 4 San Diego County Office of Education, 6401 Linda Vista Road, San Diego, CA 92111, USA
Abstract. Today a wide variety of virtual worlds, cities, gaming environments etc. exist and become part of life of their human inhabitants. However, our understanding on how technology influences the way people can use these virtual places to access information, expertise, to socialize, etc. is very limited. Previous work [1-3] introduced a tool set that generates visualizations of user interaction data to support social navigation, aid designers of virtual worlds in the evaluation and optimization of world content and layout as well as the selection of interaction possibilities, and enables researchers to monitor, study, and research virtual worlds and their evolving communities. This paper applies an advanced version of this tool set to visualize and analyze local and global usage patterns in a virtual learning environment called Linkworld.
1 Introduction Multi-user 3D collaborative environments, or virtual worlds are a mature technology to design online ‘learning places’ that foster community experiences for geographically distributed students. As part of a growing genre of Collaborative Virtual Environments (CVE’s), virtual worlds offer diverse opportunities for community centered learning [4] and are encouraging a redefinition of teacher and student roles as well as of the relationships between school and society [5]. Because participants in 3D virtual worlds have a ‘social body’ or ‘avatar,’ identity construction and community building can be much richer than in text-based collaborative environments [6]. To use virtual worlds effectively, novel ways of facilitating online social interactions are needed [5, 7, 8]. Social ‘design principles’ become key to design and sustain successful virtual worlds for learning [9]. This paper reports first results from a collaboration of the BorderLink Project of Southern California with the Information Visualization lab at Indiana University on the utilization of social visualizations tools. The visualization tools used in conjunction with 3D virtual worlds provide a means to support social navigation,
Börner, Katy, Penumarthy, Shashikant, DeVarco, Bonnie Jean and Kerney, Carol. (2005) Visualizing Social Patterns in Virtual Environments on a Local and Global Scale. In Peter van den Besselaar & Satoshi Koizumi (Eds), Digital Cities III. Information Technologies for Social Capital: Cross-cultural Perspectives, Lecture Notes in Computer Science, Vol. 3081. Springer Verlag, pp. 325-340.
Lecture Notes in Computer Science
2
augment the design and optimization of virtual worlds, and to study evolving user communities. The tools have been applied to map LinkWorld’s ‘social landscapes’ providing the user population with navigation maps and a level of self-reflexivity that allows a group to see the effectiveness of the virtual environment and their own collaborative patterns through time [1-3]. The remainder of the paper is organized as follows. Section 2 introduces the BorderLink Project and its 3D virtual LinkWorld. Section 3 presents world evaluation and visualization objectives. Section 4 introduces the visualization toolset and provides sample visualizations of LinkWorld events. The paper concludes with a discussion and outlook.
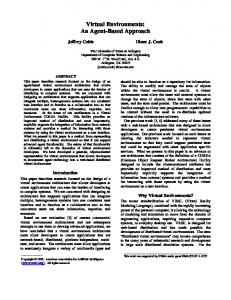
2 The BorderLink Project and LinkWorld The BorderLink Project1 is a Technology Innovation Challenge Grant funded by the U.S. Department of Education. The project is directed by the Imperial County Office of Education in partnership with the San Diego County Office of Education. It endeavors to impact the lives of high school students of Imperial and rural San Diego Counties through the use of technology in education. It utilizes video conferencing and distance courses to deliver advanced placement (AP) courses and provides a support infrastructure for online college prep and career counseling. The project serves 11 school districts and 12 high schools. Its goals are to (1) Increase the number of students who qualify for universities and highly skilled careers, (2) Provide college and career success skills, (3) Prepare students to select a college, (4) Provide comprehensive staff development, (5) Reduce student/teacher isolation, (6) Provide equitable access to technologies. Borderlink schools are physically distributed across 6704.2 square miles of rural South California. Most schools are miles and hours away from the other schools. The geographic distribution of Borderlink schools is shown in the map in Figure 1. Students from these twelve school districts benefit greatly from the awareness that they are part of an important distributed virtual community. LinkWorld2 is a 3D multi-user virtual world designed using ActiveWorlds technology. It is spearheaded by Carol Kerney and Bonnie Devarco and is an integral part of the BorderLink Project. LinkWorld provides a low-cost way to provide regular learning, counseling, and collaboration opportunities to a geographically distributed group of students, teachers and counselors in the BorderLink Project. In addition to one-to-one and one-to-many video conferencing and online course delivery, LinkWorld offers many-to-many synchronous communication and a collaborative social space with access to realtime resources for student mentoring,
1 2
http://www.borderlink.org/ http://www.borderlink.org/LinkWorld.html
Börner, Katy, Penumarthy, Shashikant, DeVarco, Bonnie Jean and Kerney, Carol. (2005) Visualizing Social Patterns in Virtual Environments on a Local and Global Scale. In Peter van den Besselaar & Satoshi Koizumi (Eds), Digital Cities III. Information Technologies for Social Capital: Cross-cultural Perspectives, Lecture Notes in Computer Science, Vol. 3081. Springer Verlag, pp. 325-340.
Lecture Notes in Computer Science
3
guidance and support activities. The students can get to know each other as mentors, colleagues and friends in a Borderlink community.
Figure 1. Map showing the geographic distribution of BorderLink Schools Many participants in the BorderLink Project represent the first generation in their family who are able to attend college. Hence, they do not grow up in a community that emphasizes the importance of college or exhibit a background and experience with early college preparation during their high school years. LinkWorld aims to immerse students in a “college culture” in a virtual social setting that offers them regular opportunities to communicate and think about college options with college recruitment officers, university student mentors, counselors and other college-bound students. LinkWorld is also used to augment course delivery with collaborative learning activities extending regular coursework in the arts, sciences, and humanities. Learning has been shown to be “socially constructed” during interactions with others. Students learn more by cooperating with their peers in problem-solving, idea exchange and skill sharing experiences [10, 11]. To ease acceptance, the areas in LinkWorld correspond to the natural biomes of the areas in Southern California covered by the BorderLink Project. The project serves twelve high schools in eleven districts in Imperial and San Diego Counties, the two counties that comprise the entire southern border of California with Mexico. BorderLink territory stretches from the Arizona border in the east for 170 miles to the west. It includes the sand dunes in east Imperial County that are so frequently seen in movies such as "Star Wars," "The Scorpion King," and "Lawrence of Arabia." The Anza Borrego Desert, Salton Sea, Cuyamaca and Laguna Mountains, an old gold mining town, and the Warner Ranch are all parts of BorderLink country. These areas are replicated in the nine regions of the virtual world using custom-made modular landscape components reflecting the mountain, meadow, desert and salton sea areas of San Diego and Imperial Counties.3
3
Descriptions and comparison screenshots of the virtual and real world locations can be found at http://www.borderlink.org/history/biomes.html.
Börner, Katy, Penumarthy, Shashikant, DeVarco, Bonnie Jean and Kerney, Carol. (2005) Visualizing Social Patterns in Virtual Environments on a Local and Global Scale. In Peter van den Besselaar & Satoshi Koizumi (Eds), Digital Cities III. Information Technologies for Social Capital: Cross-cultural Perspectives, Lecture Notes in Computer Science, Vol. 3081. Springer Verlag, pp. 325-340.
Lecture Notes in Computer Science
4
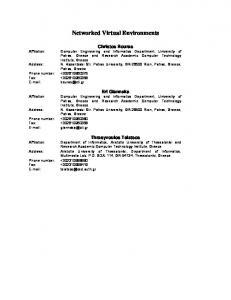
The initial sketch of the one-kilometer by one-kilometer large world is shown in Figure 2, left. The right hand side of Figure 2 shows the spatial layout of the world compiled from aerial views of the “satellite areas” of LinkWorld. Clearly visible are the nine discreet areas providing spaces for private meetings and events. Each satellite area features a different biome of Imperial and San Diego Counties.
Figure 2. Spatial layout map of LinkWorld (left) and its biomes (right) Subsequently, we describe the diverse activities that have been carried out in LinkWorld in the first four years of the BorderLink Project. The first year was devoted to the plan, design, and develop the LinkWorld biomes. In year two, a number of leadership committee meetings and content development meetings were held and support resources were counseled. Drop-in tutoring and scheduled SAT prep began. The third year featured special outreach sessions for teachers and the design of new customized content to serve a range of user groups in the BorderLink Project. A special subject-area event series introduced veteran Awedu community members and their projects in the arts, humanities and sciences to LinkWorld teachers, counselors and leadership committee members. In year four, eight subject-specific areas featured resources based on the California A-G subject area requirements (http://pathstat1.ucop.edu/ag/ag/index.html). The CollegeQuest guidance game area was designed and deployed for counselors to take students through college prep activities using a highly interactive gaming approach. Focus groups of counselors and teachers tested CollegeQuest and the subject area materials in all satellite areas. A vigorous activity schedule for students was launched in many areas of LinkWorld including: 1. College recruitment question/answer sessions for AVID (Advancement Via Individual Determination) students to meet with recruitment officers from six different California colleges and universities. 2. Art gallery opening for students in Julian High School Modern Art course to show their Cubist artwork and discuss their motivations and understanding of Cubism with students from other high schools. AWedu guests from around the world joined this event, see Figure 3.
Börner, Katy, Penumarthy, Shashikant, DeVarco, Bonnie Jean and Kerney, Carol. (2005) Visualizing Social Patterns in Virtual Environments on a Local and Global Scale. In Peter van den Besselaar & Satoshi Koizumi (Eds), Digital Cities III. Information Technologies for Social Capital: Cross-cultural Perspectives, Lecture Notes in Computer Science, Vol. 3081. Springer Verlag, pp. 325-340.
Lecture Notes in Computer Science
Figure 3. Art Gallery event screenshot (user names have been removed to preserve anonymity)
Figure 4. Cinco de Mayo Snapshot (user names have been removed to preserve anonymity)
5
Börner, Katy, Penumarthy, Shashikant, DeVarco, Bonnie Jean and Kerney, Carol. (2005) Visualizing Social Patterns in Virtual Environments on a Local and Global Scale. In Peter van den Besselaar & Satoshi Koizumi (Eds), Digital Cities III. Information Technologies for Social Capital: Cross-cultural Perspectives, Lecture Notes in Computer Science, Vol. 3081. Springer Verlag, pp. 325-340.
Lecture Notes in Computer Science
3.
4.
6
CollegeQuest counseling sessions and games in which counselors lead students through college prep resources linked to tokens in a scavenger hunt game (similar to Super Mario) with four separate areas underground, on land, and in a sky “castle”, see description at http://www.borderlink.org/history/quest.html. “Treasure Hunt” language games for students in beginning Spanish. ‘Cinco de Mayo’ historical role-play for advanced Spanish students, see Figure 4.
As LinkWorld evolves to serve a broad range of uses, it becomes important to create a “social compass” for teachers, moderators and students who collaborate in this unique environment. Planning and conducting one-to-many, one-to-one and many-to-many collaborative activities involving minors and 10-100 simultaneous participants (and sometimes a larger number of participants when simultaneous sessions occur in different areas of LinkWorld) requires answering questions such as: How do we train, moderate and support chat-based discussions? How do we implement safeguards for appropriate behavior through netiquette and automated functions? What activities can most successfully use a “natural” environment in which students have a representative self and have a sense of social space as they meet with virtual participants? What design features are most useful for ease of use and navigation in this environment? In order to answer these questions, evaluative tools that enable participants, world designers, and project leaders to analyze and view participant activity become essential.
3 Evaluation and Visualization Objectives This section describes LinkWorld’s user groups and their information needs. We then discuss how data analysis techniques and social visualizations can help to support these user groups. LinkWorld was designed to serve three distinct Borderlink user groups: (1) Teachers/Counselors/Mentors, including selected teachers from all Borderlink high schools, counselors in San Diego and Imperial Schools, mentors from universities, colleges and the local communities, college counselors, college recruitment officers and SAT test preparation advisors; (2) Borderlink High School Students ranging in age from 14-18 years, and (3) Borderlink principals including members of the leadership committee, administrators of the project and special evaluators for the project and LinkWorld designers and inworld content and activity developers (so refinement of the world can follow user needs). Teachers/Counselors need a way to assess student engagement, needs and learning styles. Moderators needed to become more effective in guiding participants through the activity both temporally and spatially. Students need to have a way to gauge their performance in relationship to others in a task-based activity.
Börner, Katy, Penumarthy, Shashikant, DeVarco, Bonnie Jean and Kerney, Carol. (2005) Visualizing Social Patterns in Virtual Environments on a Local and Global Scale. In Peter van den Besselaar & Satoshi Koizumi (Eds), Digital Cities III. Information Technologies for Social Capital: Cross-cultural Perspectives, Lecture Notes in Computer Science, Vol. 3081. Springer Verlag, pp. 325-340.
Lecture Notes in Computer Science
7
Because Borderlink serves high school students, the primary challenge in LinkWorld is to ensure continued appropriate behavior in all activities and events. Realtime chat environments have rarely been used and scaled by the K12 community without huge constraints automatically in place. This has to do with the accelerated experience of off-task behavior and conversation that has initiated the standard netiquette rules to be put in place by all schools before each 1st grader is introduced to the WWW. Moderation of realtime chat is difficult because the amount of time needed to monitor behavior and the need for self-regulation of participants. User groups from the K12 are even more challenging since participants are minors and self-regulation of behavior is not an option. The user groups of LinkWorld are in the critical ages between 14 and 18; because of this, safeguards for appropriate behavior were rigorously put into place before a scaling up the user base in LinkWorld could be undertaken. Mapping social activities such as movement and interactions with the world (web page access or teleport usage) and with other participants (via chat) can help: • To automatically identify inappropriate words in chat in real time, their originators, as well as major areas and times in which inappropriate speech is typically observed. • To visualize and regulate appropriate behavior (including polite listening behaviors, following directions and staying on task). • To better articulate the ideal conditions in the design of the virtual environment (including easy navigation, orienting materials in an aesthetically and spatially compelling way, ensuring presentations can be engaged in by all participants). • To understand and model successful moderation strategies (including setting expectations, adequate explanation, student learning style assessment, engaging students in the material through guiding activities, regular encouragement and completing lessons in a reasonable amount of time). • To present content in compelling and easy to use ways (including adequately complex materials, simple and engaging layout and easy access to and comparison of varied materials). • To assist a teacher to plan lesson better beforehand or have a better “bird’s-eyeview” of their content (type of objects, when objects were created, what they are linked to) in the spatial environment. • To enable students to effectively navigate through the world and the content of the lesson in it, assess their own progress in meeting the milestones of the activity, engage in peer to peer learning and mentoring and compare their personal performance to other students doing the same activity. • To identify social networks based on physical closeness of people.
4 Visualization Toolkit and Application Research on social visualizations aims to analyze and visualize data about a person, to illuminate relationships among people, or to visualize user group activity.
Börner, Katy, Penumarthy, Shashikant, DeVarco, Bonnie Jean and Kerney, Carol. (2005) Visualizing Social Patterns in Virtual Environments on a Local and Global Scale. In Peter van den Besselaar & Satoshi Koizumi (Eds), Digital Cities III. Information Technologies for Social Capital: Cross-cultural Perspectives, Lecture Notes in Computer Science, Vol. 3081. Springer Verlag, pp. 325-340.
Lecture Notes in Computer Science
8
For a detailed review of lifeline visualizations, the visualization of very large-scale conversations, visualization of Web activity and user trails, representation of people by avatars, visualizations that support social interactions of participants, or visualization of MUDs or 3-D virtual worlds themselves, please consult [2]. To our knowledge nobody has yet attempted to analyze and visualize spatiallyreferenced user interaction data such as navigation, object manipulation, Web access, or chatting in 3-D virtual environments. This may be due to the fact that most 3-D online browser systems provide an exclusive chat log (oftentimes restricted to a fixed number of closeby avatars) of a 3-D world experience. Information about when and where a certain utterance was made, user positions, object movements, teleports/warp usage, or Web accesses is lost. However, the spatial reference is vital to identify places in which people typically speak, to find teleport designs that work, etc. The social visualization tool set developed at Indiana University comprises algorithms for visualizing the evolution of 3D virtual worlds, for mapping dynamic user trails and chat activity in space and time, and to analyze and visualize chat activity [1-3] . The subsequent section demonstrates the application of those tools to provide guidance for the three major LinkWorld user groups. The subsequently presented data was recorded in LinkWorld in Spring 2003. There are two main types of activities in LinkWorld: 1. Highly mobile game style treasure hunts, interactive galleries or student presentations and 2. Highly conversant historical role-plays, guidance or recruitment question and answer sessions. For the first type of activity, maps for movement are very useful. For type two activities, it is valuable to analyze the number of utterances of each participant, to identify dominant chatters, and key-words used in chat. Since LinkWorld consists of nine different areas for private chat and activities and a commons area in Ground Zero, separate events sometimes occur simultaneously in more than one area. Log bots were distributed in nine different areas of the world to collect the chat and movement data from all areas at once. Each event included up to 35 participants, and up to five moderators/presenters. Looking at just one day, April 30, we can see three separate activities. For beginning Spanish language students, two separate leaders conducted “treasure hunt” activities. These consisted of theme-based questions and answers on Web pages linked to “tokens” distributed throughout two separate areas of LinkWorld. The El Juego del Tesoro treasure hunt took place in the Foreign Language satellite area of LinkWorld, see Figure 5, lower right corner. It was led by MatthewC. The other treasure hunt, named Comida!!, was conducted in the Palm Oasis area (a small part of the Mountain Valley and Meadowlands, see Figure 5, upper right). It was led by Profesora Lima and concentrated on the food theme. Participants in the treasure hunt activities were from Holtville and Brawley high schools. A college recruitment session also occurred during this day. It was led by Carolk and participants were from Rancho Bernardo and Carlsbad high schools. All classes entered in ground zero and teleported to the activity locations.
Börner, Katy, Penumarthy, Shashikant, DeVarco, Bonnie Jean and Kerney, Carol. (2005) Visualizing Social Patterns in Virtual Environments on a Local and Global Scale. In Peter van den Besselaar & Satoshi Koizumi (Eds), Digital Cities III. Information Technologies for Social Capital: Cross-cultural Perspectives, Lecture Notes in Computer Science, Vol. 3081. Springer Verlag, pp. 325-340.
Lecture Notes in Computer Science
9
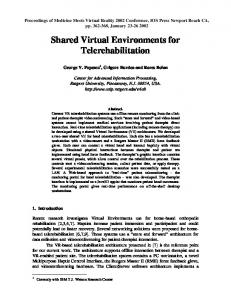
Figure 5 shows a map of LinkWorld. The map was automatically generated based on the objects that make up LinkWorld. Each object, e.g., houses, vegetation, etc., is represented by an object of appropriate size. Younger objects are shown in light blue. Older objects appear darker. Web links and teleport places are indicated by blue squares and red plus signs respectively.
Figure 5. April 30 treasure hunt movement visualization
Börner, Katy, Penumarthy, Shashikant, DeVarco, Bonnie Jean and Kerney, Carol. (2005) Visualizing Social Patterns in Virtual Environments on a Local and Global Scale. In Peter van den Besselaar & Satoshi Koizumi (Eds), Digital Cities III. Information Technologies for Social Capital: Cross-cultural Perspectives, Lecture Notes in Computer Science, Vol. 3081. Springer Verlag, pp. 325-340.
Lecture Notes in Computer Science
10
The user trails recorded during the treasure hunt in LinkWorld on April 30th are overlaid on this map. Each user is represented by a color-coded polyline. Idle times are denoted by cycles the size of which represents the amount of time during which no movement took place. The color of lines and circles corresponds to the time at which the data was logged. The gray polyline denotes the path of Profesora Lima.
Figure 6. April 30 treasure hunt visualization of chat activity
Börner, Katy, Penumarthy, Shashikant, DeVarco, Bonnie Jean and Kerney, Carol. (2005) Visualizing Social Patterns in Virtual Environments on a Local and Global Scale. In Peter van den Besselaar & Satoshi Koizumi (Eds), Digital Cities III. Information Technologies for Social Capital: Cross-cultural Perspectives, Lecture Notes in Computer Science, Vol. 3081. Springer Verlag, pp. 325-340.
Lecture Notes in Computer Science
11
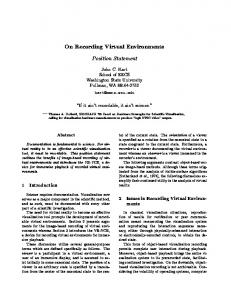
Obviously, more participants actively took part in Profesora Lima’s treasure hunt. The visualization immediately reveals areas of high activity, enables to correlate the trails of the main organizer with those of the participants, and points out areas that were used for talking while ‘idling’. A chat visualization of the same event time and place is shown in Figure 6. Here color coded triangles indicate the places where the treasure hunt participants chatted. Tesoro and Comida treasure hunt event participants can be compared based on the amount of utterances. The most active chat was by moderator Carolk who moderated the recruitment session, MatthewC who led Tesoro and Profesora Lima who led Comida. Profesora Lima, who gave regular feedback to her students, shows the most dominant chat behavior. It is also clear from the chat visualization how verbal various students were in the activities. Figure 7 shows the number of chat utterances per user for the second treasure hunt. Profesora Lima (right most bar #19) holds the record with about 170 separate chat utterances. User names have been replaces by numbers to preserve anonymity. 200 180
Number of Utterances
160 140 120 100 80 60 40 20 0 1
2
3
4
5
6
7
8
9 10 11 12 13 14 15 16 17 18 19
User
Figure 7. Number of chat utterances per user during the Treasure Hunt "Comida!!!" In this case study, social movement maps showed how active the treasure hunt sessions were and the chat visualizations assisted us in understanding the engagement of students through the number of utterances per student, and differences in moderation styles of various presenters (which presenters encouraged active dialogue, etc.).
Börner, Katy, Penumarthy, Shashikant, DeVarco, Bonnie Jean and Kerney, Carol. (2005) Visualizing Social Patterns in Virtual Environments on a Local and Global Scale. In Peter van den Besselaar & Satoshi Koizumi (Eds), Digital Cities III. Information Technologies for Social Capital: Cross-cultural Perspectives, Lecture Notes in Computer Science, Vol. 3081. Springer Verlag, pp. 325-340.
Lecture Notes in Computer Science
12
5 Discussion & Outlook In 2003, a large number of LinkWorld Spring events were logged, analyzed, and visualized. The movement and chat visualizations helped the coordinators of the project to picture how effective directions given at the start of each event were. If students were wandering all over the map, then students clearly did not understand or follow directions. This in return lead to increased efforts to presenting clear instructions for students and management techniques to keep the students together in the right area. Were introduced. Subsequently, the visualizations were used to ‘test’ to what degree the new instructions and techniques improved students’ engagement and interested, i.e., if they abstain from wandering off during a presentation. The maps and graphs that show participation through chat provided an objective way to evaluate the importance of verbal encouragement for students. Interestingly, the most effective teachers in a virtual environment talk unceasingly with the students, giving feedback, encouraging them, etc. Borderlink, teachers and presenters are able to learn which classes were more successful by showing students active and engaged in both chat and in moving around the gaming and event areas. Borderlink principals will be able to design larger event areas where the density of movement seems more contained and design richer experiences for larger student groups. Through a combination of reportage from logs, visualizations and assessment of the Spring 2003 events, we have established a new set of resources for LinkWorld. These include (1) a new set of netiquette and reporting procedures suited for a 3D multi-user environment serving high school students (2) training materials and moderation guidelines for teachers, moderators and presenters, (3) lesson plans and teacher templates for selected lessons and activities and (4) A new pre- and post-event profiling and documentation procedure for each activity. Starting this year, the visualizations will be included in the evaluation report for the project. They will also be used to report the success of LinkWorld events to potential adopters and partners in the next phase. Objectives for the 2003/2004 school year will include the further refinement of the event cycle and a wider distribution of visualizations to Borderlink teachers, counselors, moderators, evaluators, and the LinkWorld development team. Through the adoption of a new coding procedure similar to one being pioneered by Joen Janssen, et.al, with nine distinctive categories of chat (orientating, instructing, grounding, monitoring, testing, evaluating, rest, cognitive and off-task) [12], we are planning to visualize more qualitative conversational behaviors in LinkWorld. A close collaboration with the visualization team will be necessary to further optimize visualizations. Pre-event profiles, event locations, exact times, age groups, number of students, type of activity and information on preferred visualizations will be shared in advance. The focus will be on visualizations for specific time durations (specific classes rather than complete day visualization of all) in order to carry out side-by-side comparisons. Moderated events such as treasure hunts (shown in the figures above) will show a more directed, homogeneous series of trails and patterns
Börner, Katy, Penumarthy, Shashikant, DeVarco, Bonnie Jean and Kerney, Carol. (2005) Visualizing Social Patterns in Virtual Environments on a Local and Global Scale. In Peter van den Besselaar & Satoshi Koizumi (Eds), Digital Cities III. Information Technologies for Social Capital: Cross-cultural Perspectives, Lecture Notes in Computer Science, Vol. 3081. Springer Verlag, pp. 325-340.
Lecture Notes in Computer Science
13
by each group (similar to color-coded “theme-based” tour paths in the Vatican Library in Rome). The self-directed paths of single-player collegequest journeys will show a broader range of individual trails over a larger spread of time. Taken together, the visualizations provide a reliable, automated methodology for collecting meaningful assessment data. They will assist a new group of teachers and activity leaders in developing better content, lesson plans, events and moderation methodologies in LinkWorld. We believe they will also help us to identify moderator strategies that will enable student groups perform successfully in the LinkWorld environment and could also provide a “social compass” for a wide range of learning activities by enabling teachers to assess student group behavior and collaborative engagement as well as student self-assessment through visualizing their own experience from a different point of view.
7 Acknowledgements Borderlink Partners include the Imperial County Office of Education who serves as the Local Educational Agent, San Diego County Office of Education, the University of California Prep Initiative, San Diego State University-Imperial Valley Campus, Imperial Valley College, Imperial Irrigation District, Digital High School Project, and the twelve target high schools. The BorderLink Project operates under the auspices of Mr. John Anderson, Superintendent of the Imperial County Office of Education and Dr. Rudy Castruita, Superintendent of the San Diego County Office of Education. Project directors are Todd Finnell and Harry Bloom. We would like to thank Penny Twining, Craig Twining and Chad Rooney for their developmental and reporting assistance in the LinkWorld Project and Gyeongja Jun Lee, William R. Hazelwood & Sy-Miaw Lin, who have been involved in the implementation and testing of Indiana University’s visualization tool kit. This research is supported by Indiana University's High Performance Network Applications Program and an academic equipment grant by Sun Microsystems. The BorderLink Project is a five-year project (1999-2004) funded through a Technology Innovation Challenge Grant from the United States Department of Education.
References 1.
2. 3.
Börner, K., Twin Worlds: Augmenting, Evaluating, and Studying ThreeDimensional Digital Cities and Their Evolving Communities, in Digital Cities II: Computational and Sociological Approaches, M. Tanabe, P. van den Besselaar, and T. Ishida, Editors. 2002, Springer Verlag. p. 256-269. Börner, K. and Y.-C. Lin. Visualizing Chat Log Data Collected in 3-D Virtual Worlds. In International Information Visualisation Conference. 2001. London, England, p. 141-146. Börner, K., R. Hazlewood, and S.-M. Lin. Visualizing the Spatial and Temporal Distribution of User Interaction Data Collected in Three-
Börner, Katy, Penumarthy, Shashikant, DeVarco, Bonnie Jean and Kerney, Carol. (2005) Visualizing Social Patterns in Virtual Environments on a Local and Global Scale. In Peter van den Besselaar & Satoshi Koizumi (Eds), Digital Cities III. Information Technologies for Social Capital: Cross-cultural Perspectives, Lecture Notes in Computer Science, Vol. 3081. Springer Verlag, pp. 325-340.
Lecture Notes in Computer Science
4. 5. 6. 7. 8. 9. 10. 11.
12.
14
Dimensional Virtual Worlds. In Sixth International Conference on Information Visualization. 2002. London, England: IEEE Press, p. 25-31. Bransford, J., A. Brown, and R. Cocking, How People Learn: Brain, Mind, Experience and School. National Academy Press, 1999. Riel, M., New Designs for Connected Teaching and Learning. White Paper for the U.S. Department of Education Secretary's Conference on Educational Technology, 2000(http://www.gse.uci.edu/mriel/whitepaper/). Talamo, A. and B. Ligorio. Identity in Cyberspace: The Social Construction of Identity through On-line Virtual Interactions. In First Dialogical Self Conference. 2000 Berge, Z.L., Facilitating Computer Conferencing: Recommendations from the Field. Educational Technology, 1995. 35(1): p. 22-30. Jo Kim, A., Community Building on the Web: Secret Strategies for Successful Online Communities. 2000, Berkeley, CA: Peachpit Press. Börner, K., M. Corbit, and B. DeVarco, Building Blocks for Virtual Worlds. 2003: p. Final Project Report. Available at http://vw.indiana.edu/buildingblocks/report.pdf. Vygotsky, L.S., Mind in Society: The Development of Higher Psychological Processes. 1978, Cambridge, MA: Harvard University Press. Hogan, D.M. and J.R.H. Tudge, Implications of Vygotsky's Theory for Peer Learning, in Cognitive Perspectives on Peer Learning, A.M. O'Donnell and A. King, Editors. 1999, Lawrence Erlbaum Associates: Mahwah, NJ. p. 3965. Janssen, J., H.v.d. Meijden, and M. Winkelmolen. Collaborating in a 3D Virtual Environment for Culture and the Arts: Metacognitive Regulation in a 3D CSCL Environment. In Proceedings of EARLI 2003 - European Association for Research in Learning and Instruction. 2003. Padova, Italy