34
IEEE TRANSACTIONS ON NANOBIOSCIENCE, VOL. 4, NO. 1, MARCH 2005
Voltage-Gated Ion Channels Francisco Bezanilla
Abstract—Voltage-dependent ion channels are membrane proteins that conduct ions at high rates regulated by the voltage across the membrane. They play a fundamental role in the generation and propagation of the nerve impulse and in cell homeostasis. The voltage sensor is a region of the protein bearing charged amino acids that relocate upon changes in the membrane electric field. The movement of the sensor initiates a conformational change in the gate of the conducting pathway thus controlling the flow of ions. Major advances in molecular biology, spectroscopy, and structural techniques are delineating the main features and possible structural changes that account for the function of voltage-dependent channels. Index Terms—Gating currents, ionic currents, S4 segment, voltage sensor.
I. INTRODUCTION
T
HE BIT OF information in nerves is the action potential, a fast electrical transient in the transmembrane voltage that propagates along the nerve fiber. In the resting state, the membrane potential of the nerve fiber is about 60 mV (negative inside with respect to the extracellular solution). When the action potential is initiated the membrane potential becomes less negative and even reverses sign (overshoot) within 1 ms and then goes back to the resting value in about 2 ms, frequently after becoming even more negative than the resting potential. In a landmark series of papers, Hodgkin and Huxley studied the ionic events underlying the action potential and were able to describe the conductances and currents quantitatively with their classical equations [1]. The generation of the rising phase of the action potential was explained by a conductance to Na ions that increases as the membrane potential is made more positive. This is because, as the driving force for the permeating ions (Na) was in the inward direction, more Na ions come into the nerve and makes the membrane more positive initiating a positive feedback that depolarizes the membrane even more. This positive feedback gets interrupted by the delayed opening of another voltage dependent conductance that is K-selective. The driving force for K ions is in the opposite direction of Na ions; thus, K outward flow repolarizes the membrane to its initial value. The identification and characterization of the voltage-dependent Na and K conductances was one of the major contributions of Hodgkin and Huxley. In their final paper of the series, they even proposed that the conductance was the result of increased permeability in discrete areas under the control of charges or Manuscript received November 4, 2004; revised November 15, 2004. This work was supported in part by the U.S. Public Health Service National Institutes of Health under Grant GM30376. The author is with the Departments of Physiology and Anesthesiology, D. Geffen School of Medicine and the Biomedical Engineering Interdepartmental Program, University of California, Los Angeles, CA 90095 USA (e-mail:
[email protected]). Digital Object Identifier 10.1109/TNB.2004.842463
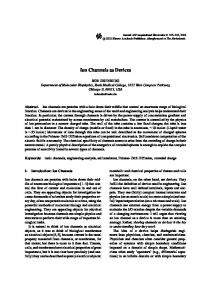
Fig. 1. General architecture of voltage-gated channels. Top part shows the channels). The gray basic subunit (or domain in the case of Na and Ca background represents the lipid bilayers. The cylinders are transmembrane segments. The region between S5 and S6 forms the pore. Segments 1 through 4 are called the voltage sensor part of the channel. The or signs in white indicate charges that have been implicated in voltage sensing. In the bottom part, a schematic view of the channel from the outside showing the assembled four subunits or domains.
+ 0
dipoles that respond to the membrane electric field. This was an insightful prediction of ion channels and gating currents. Many years of electrical characterization, effects of toxins on the conductances, molecular biological techniques, and improvement of recording techniques led to the identification of separate conducting entities for Na and K conductances. These conductances were finally traced to single-membrane proteins, called ion channels, that can gate open and closed an ion conducting pathway in response to changes in membrane potential (see introductory paper by P. Jordan in this issue). II. VOLTAGE-DEPENDENT ION CHANNELS ARE MEMBRANE PROTEINS The first voltage-dependent ion channel that was isolated and purified was extracted from the eel electroplax where there is a large concentration of Na channels [2]. Several years later, the sequence of the eel Na channel was deduced from its mRNA [3]. The first K channel sequence was deduced from the Shaker mutant of Drosophila melanogaster [4]. These initial sequences were the basis to subsequent cloning of a large number of Na ,
1536-1241/$20.00 © 2005 IEEE
BEZANILLA: VOLTAGE-GATED ION CHANNELS
35
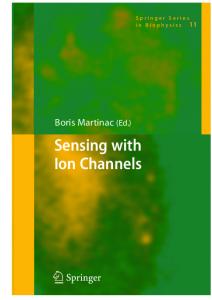
Fig. 2. Comparison between a field-effect transistor (FET) and a voltage-gated ion channel. The FET transistor is represented as a p-channel device to make a closer analogy to a cation selective voltage-gated channel. (a) and (c) are the closed states; (b) and (d) are the open states. Notice that, in contrast with the FET, the gate in the voltage-gated channel indicates the actual point of flow interruption. BLM is the lipid bilayer. In the FET, D is the drain, S is the source, and G is the gate. For details, see text.
K and Ca channels in many different species. Hydropathy plots were helpful in deciding which parts of the sequence was transmembrane or intra or extracellular. A basic pattern emerged from all these sequences: the functional channels are made up of four subunits (K channels) or one protein with four homologous domains (Na and Ca channels). Each one of the domains or subunits has six transmembrane segments and a pore loop. (see Fig. 1). The fifth and sixth transmembrane segments (S5 and S6) and the pore loop were found to be responsible for ion conduction. The fourth transmembrane segment (S4) contains several basic residues, arginines or lysines and was initially postulated to be the voltage sensor [3] In addition S2 and S3 contain acidic residues such as aspartate and glutamate. Most of the channels have additional subunits that modify the basic function but they are not necessary for voltage sensing and ion conduction. III. THE PARTS OF THE VOLTAGE DEPENDENT CHANNEL We think of voltage-dependent channels as made of three basic parts: the voltage sensor, the pore or conducting pathway and the gate. These three parts can be roughly mapped in the putative secondary structure (Fig. 1). The pore and the gate are in the S5-loop-S6 region and the voltage sensor in the S1–S4 region. As the conduction is dependent on the voltage across the membrane, a useful analogy is a field effect transistor (see
Fig. 1). If we take a typical V-dependent K channel, its voltage sensor corresponds to the gate of a p-channel FET transistor, the conducting pathway of the ion channel corresponds to the p-channel (Fig. 2) and the gate of the channel is the space charge in the p-channel. As we will see below, this analogy is useful to discuss the parts of the channel but it cannot be pushed very far because, although the functions are similar, the actual mechanisms are quite different. A. The Conducting Pathway Living cells, and in particular nerve fibers, are surrounded by a thin membrane made of a bimolecular layer of lipids. The permeability of ions through the lipid bilayer is extremely low because it takes a large amount of energy to put a charged ion species inside the low dielectric constant lipid bilayer [5]. The conducting pathway of ion channels lowers that energy barrier by providing a favorable local environment, thus allowing large flows under an appropriate driving force. Details of the ion conduction pore structure, conductance, and selectivity are covered in other papers in this issue [6]. What is important to emphasize here is that the ion flow is proportional to the driving force for the selected ion. The driving force corresponds to the difference between the voltage applied and the voltage at which there is no flow, or reversal potential . If the channel is perfectly selective to one type of ion, say, K , then is the Nernst potential;
36
IEEE TRANSACTIONS ON NANOBIOSCIENCE, VOL. 4, NO. 1, MARCH 2005
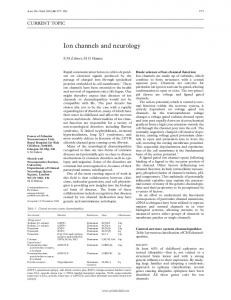
Fig. 3. Time course of single-channel and macroscopic ionic currents. The applied voltage is in the top trace and the current recorded through one channel is shown for four different trials. The mean current is the result of thousands of trials. (a) Small depolarization to 30 mV opens the channel infrequently. (b) A large depolarization (to 30 mV) opens the channel most of the time. c is the closed state and o is the open state.
0
+
otherwise, is predicted by the Goldman–Hodgkin and Katz equation that considers concentrations and relative permeabilities. Knowing the conductance of the conducting pathway ,we can compute the current flow through the open conducting pore as (1) The – curve of an open channel may be nonlinear because in general is voltage dependent. B. The Gate The ion conduction through the pore may be interrupted by closing a gate (see Fig. 2). Thermal fluctuations will close and open the gate randomly and the current will have interruptions. In voltage-dependent channels, the probability that the gate is depends on the membrane potential. In the majority open of -dependent Na , K , and Ca channels from nerve and muscle, the increases with membrane depolarization (i.e., decrease in the resting potential). There are a few cases, such as increases on hyperpolarization. Kat1 channel, where The operation of the gate can be seen by recording the current flowing through a single ion channel. This is possible with the patch clamp technique [7], which records currents from a very small patch of membrane with a small glass pipette and a lownoise system that can resolve currents in the order of 1 pA. An example of the operation of one K channel is shown in a simulation in Fig. 3. As the internal concentration of K is more than 10 times higher in the cell as compared to the extracellular space, the reversal potential for K channels is around 80 mV. Starting with a negative membrane potential 100 mV , the channel is closed most of the time. A depolarizing voltage pulse to 30 mV increases the open probability and the channel spends some time in the open state [Fig. 3(a)]. As we are dealing with one molecule, thermal fluctuations will generate different responses for each repetition of the same pulse (four of such are shown in the figure). A larger depolar30 mV increases the even more by increasing ization
the open times and decreasing the closed times, as seen in Fig. 3(b). Notice also that the time elapsed between the start of the pulse and the first opening (first latency) is decreased for the larger depolarization Apart from increasing the open times, the magnitude of the current through the pore was increased applied by the larger depolarization. This is because the is now further away from , increasing the driving force for ion movement. Thus, this increase in current is not a result of but is just a passive property of the open pore. An increasing average of several thousands of repetitions gives us the macroscopic ionic currents. Provided the channels do not interact, the average of thousands of repetitions is the same as having thousands of channels operating simultaneously. The bottom trace (labeled mean) in Fig. 3(a) and (b) shows the macroscopic and 30 mV, respectively. Notice that the currents for turn-on kinetics is faster for a more positive potential and that the current magnitude is also increased. The kinetics change is while the magnitude increase is the result of an increased the result of both increased and driving force. We can now write the expression for the macroscopic current as (2) where is the channel density and time-dependent open probability.
is the voltage- and
C. The Voltage Sensor How does become voltage dependent? It is clear that to detect changes in membrane potential, a voltage sensor is needed. The electric field in the bilayer could be detected by electric or magnetic charges or dipoles that change their position according to changes in the field. As there is no evidence of magnetic charges, electric charges or dipoles remain as the prime candidates. We will see below that the actual charges involved in voltage sensing have been identified and a schematic representation of their relocation is shown in Fig. 2(b). In the resting (hyperpolarized) condition, the membrane is negative inside and the positive charges are located in contact with the interior of
BEZANILLA: VOLTAGE-GATED ION CHANNELS
37
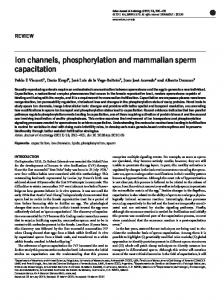
the cell. Upon depolarization, the positive charges are driven toward the outside. This movement in the electric field has two consequences: it is coupled to the gate resulting in pore opening [Fig. 2(b)] and the charge translocation produces another membrane current that is transient in nature, called gating current. It is called gating current because it ultimately gates the channel open and closed, and it is transient because the charge locations are bound to limiting positions as they are tethered to the protein. IV. GATING CHARGE AND THE VOLTAGE SENSOR An understanding of the voltage sensor requires a characterization of the gating charge movement and a correlation of that movement to structural changes in the protein. In this section, we will address two functional questions. The first question is what are the kinetics and steady state properties of the gating charge movement and how does this charge movement relate to channel activation. The second is how many elementary charges move in one channel to fully activate the conductance and how does this movement occur in one channel. A. The Gating Currents and the Channel Open Probability The movement of charge or dipole reorientation is the basic mechanism of the voltage sensor and was predicted by Hodgkin and Huxley [1]. Gating currents are transient and they only occur in the potential range where the sensor responds to the electric field; therefore, they behave like a nonlinear capacitance. In addition, as gating currents are small, to record them it is necessary to decrease or eliminate the ionic currents through the pore and eliminate the normal capacitive current required to charge or discharge the membrane. This is normally accomplished by applying a pulse in the voltage range that activates the current and then subtracting the current elicited by another pulse or pulses in the voltage range that does not activate the currents to eliminate the linear components [8], [9]. Using these subtraction techniques, the kinetics of Na gating currents were studied in detail in squid giant axon and other preparations where a high channel density was found. The combination of gating currents, macroscopic ionic currents and single-channel recordings were used to propose detailed kinetic models of channel operation (see [10]). When voltage-dependent channels were cloned and expressed in oocytes or cell lines, it was possible to achieve large channel densities on the surface membrane and study those channels in virtual absence of currents from other channels. In comparison to the currents in natural tissues such as the squid giant axon, the expression systems gating currents were much larger and made the recording easier and cleaner. In addition, the study of the pore region gave us the possibility of mutating the channel protein to eliminate ionic conduction but maintaining the operation of the gating currents [11]. We can illustrate the basic features of gating currents and their relation to ionic currents in recordings from Shaker K channels with fast inactivation removed (Shaker-IR) as shown in Fig. 4(a). In this figure, two separate experiments are shown. The top traces are the time course of the ionic currents recorded during pulses that range from 120 to 0 mV, starting and returning to 90 mV. The bottom traces are gating currents recorded for the
Fig. 4. Ionic and gating currents in Shaker-IR K channel. (a) Top traces: time course of ionic currents for pulses to the indicated potentials starting and returning to 90 mV. Bottom traces: time course of the gating currents for the pulses indicated. Notice the difference in the amplitude calibration for ionic as compared to gating currents. (b) The voltage dependence of the open probability P (V ) and the charge moved per channel Q(V ). For details, see text.
0
same set of pulses from Shaker-IR with a mutation that changes a tryptophan into a phenylalanine in position 434 (W434F) that renders the pore nonconducting [11]. Several features that are characteristic of most voltage-dependent channels can be observed. First, the ionic currents do not show significant activation for potential more negative than 40 mV while the gating currents are visible for all the pulses applied, implying that there is charge displacement in a region of potentials where most of the channels are closed. Second, the time course of activation of the ionic current is similar to the time course of decay of the gating current. Third, the time course of the return of the charge (gating current “tail”) changes its kinetics drastically when returning from a pulse more positive than 40 mV, which is precisely the potential at which ionic currents become clearly visible. The gating tails are superimposable for potentials more positive than 20 mV, showing that most of the charge has moved at 20 mV. The total charge moved at each potential may be computed as the time integral of the gating current for each pulse. As we will see below, it is possible to estimate the total charge moved per channel molecule; therefore, the voltage dependence of the charge moved can be plotted as shown in
38
Fig. 4(b). Knowing the number of channels present (see below), using (2) it is possible to estimate the voltage dependence of , as shown in the same figure. Fig. 4(b) establishes the relationship between the charge movement and channel opening and clearly shows that the opening of the channel is not superimposable with charge movement as expected from a simple two-state relation model. A striking feature of these plots is that the is displaced to the left of the curve so that there is quite is essentially a large charge movement in a region where the zero. This is an expected feature of a channel that requires several processes to occur to go from closed to open, such as the classical Hodgkin and Huxley model where four independent particles are needed to be simultaneously in the active position for the channel to be open. Current recordings of the type shown in Fig. 4(a) can be used to formulate kinetic models of channel gating. These models are normally written as a collection of closed and open states interconnected with rate constants that, in general, are a function of the membrane potential. Initially, kinetic models were developed from the macroscopic ionic currents only [1]. The addition of single-channel recordings and gating currents recordings imposes several constraints in the possible models and in the parameters fitted, thus obtaining a more robust representation of the kinetic parameters that characterize the channel. The common assumption in kinetic models is that the movement of the charge or dipole in the field has a finite number of low-energy positions and energy barriers in between them. According to kinetic theory, the transition rates across the energy barrier are exponentially related to the negative of the free energy amplitude of the barrier. This free energy contains nonelectrical terms, and an electrical term such that the membrane voltage can either increase or decrease the total energy barrier, resulting in changes in the forward and backward rates of crossing the barriers. There are multiple examples in the literature with varied levels of complexity that describe well the kinetic and steady state properties of several types of voltage-dependent channels (see, for example, [10], [12]–[14]). A more general approach to modeling is based on a representation of a landscape of energy using the charge moved as the reaction coordinate. In this type of modeling, the above-mentioned discrete kinetic models are also represented when the landscape of energy has surges that exceed 4 kT [15]. When gating currents are recorded with high bandwidth, new components are observed [16]. Fig. 5(a) shows a typical gating current trace recorded with a bandwidth of 10 kHz. Notice that before the initial plateau and decay of the gating current, there is a brief surge of current. When the bandwidth is increased to 200 kHz, the first surge of current is the predominant amplitude as shown in the fast timescale recording of Fig. 5(b). The large spike of current is followed by a long plateau of current that corresponds to the dip observed at 10 kHz in Fig. 5(a). However, the area spanned by the large spike is a very small fraction of the total charge moved during the entire time course of the gating current. The interpretation of this early component is best understood using the representation of the gating charge moving in a landscape of energy that undergoes a change in tilt when the membrane potential is changed such that the charge advances in its initial energy well before making the
IEEE TRANSACTIONS ON NANOBIOSCIENCE, VOL. 4, NO. 1, MARCH 2005
Fig. 5. Early component of the gating current. (a) Gating current recorded at 10-kHz bandwidth. (b) Gating current recorded at 200-kHz bandwidth. Notice the differences in the amplitude and time scales. (c) The time course of the charging of the membrane capacitance for the experiment in (b). Recordings done in collaboration with Dr. E. Stefani.
jump across the first energy barrier. Using this approach, Sigg et al. [16] computed the viscosity encountered by the gating charge in its well of energy. What have we learned with kinetic modeling? In fact, a great deal. It is now clear that voltage-dependent channels have multiple closed states and, in some cases, several open states. In general, the opening of the gate requires all four subunits to be activated, although there are cases where intermediate states have been observed. Each subunit undergoes several transitions before reaching the active state, and in the case of K channels, they do not seem to interact until the final step that opens the channel [17], [18]. However, in the muscle Na channel site-directed fluorescence studies show that the interdomain interactions are manifested prior to channel opening [19]. Kinetic modeling has given us a picture of the channel in terms of channel physical states with transitions between them that are regulated by voltage. Kinetic modeling is a critical step in developing a physical model of channel operation because all the predicted features of channel function should be reproduced by the structure of the protein and its voltage-induced conformational changes. B. Gating Charge Per Channel When the gating charge moves within the electric field, we detect a current in the external circuit. The time integral of that
BEZANILLA: VOLTAGE-GATED ION CHANNELS
39
current represents the charge moved times the fraction of the field it traverses; therefore, our measurement of gating charge does not represent the exact number of charges displaced because it includes the arrangement of the electric field. We must keep this in mind when we represent the reaction coordinate of the activation of the channel in the variable . A channel evolves to traversing many closed and/or open states. from Activation of the channel corresponds to the opening of the pore and, analogous to the chemical potential, we define the activation potential as (3) corresponds to the Then the activation charge displacement negative gradient of the activation potential (4) The equilibrium probabilities in each physical state of the channel can be explicitly written using the Boltzmann distribution knowing the potential of mean force for each state . Then, by assigning open or closed (or intermediate states) conductances to every state, we can wite an expression for that includes the voltage dependence of . The final result of the derivation [20] gives a relation between , , and the charge moving between open states (5) is the – curve shown in Fig. 5. This result is Note that general and includes cases with any number of open and closed states connected in any arbitrary manner. If there is no charge , then the – curve movement between open states superimposes on . In addition, it is possible to estimate , the total charge per channel, by taking the limiting value of that makes go to zero. In the typical case of a channel that closes at negative potentials, we obtain (6) a result that was first obtained by [21] for the special case of a sequential series of closed states ending in an open state. This method has been applied to several types of voltage-dependent channels, and the charge per channel obtained ranges between [22]–[24]. 9 and 14 Another way to estimate the charge per channel is to measure the maximum charge from the – curve and divide by method). The number of the number of channels present ( channels can be estimated by noise analysis [25] or by toxin binding [26]. The value of charge per channel estimated by method was 12–13 for the Shaker K channel, a the value that was not different from the value obtained by the limiting slope method [24]. As the limiting slope measures only the charge involved in opening the channel, the agreement between the two methods implies that in the case of the Shaker channel there is no peripheral charge. The large value of 12 to 13 per channel explains the very steep voltage dependence of the superfamily of voltage gated
ion channels. At very negative , has a linear dependence on , so that is exponential in , such that it increases by in only 2 mV (7) This very steep voltage dependence explains why the – curve of Fig. 4(b) shows no visible at potentials more negof less ative than 40 mV; in fact, there is a finite value of than 10 at potentials as negative as 100 mV. Voltage-dependent channels that have several open states , show plots of with charge moving between them – that may not be used to compute . One example is the maxi K channel, activated by voltage and Ca, that shows a – curve with a slope that decreases as the potential is made more negative. This result is consistent with the multiple-state allosteric model proposed for this channel [27]. Gating current of one channel. The previous paragraph shows that we can estimate the total charge that moves in one channel but does not give any ideas of how that charge movement occurs at the single-channel level. Two limiting cases can be proposed. In one case, the time course of the gating current is just a scaled-down version of the macroscopic gating current shown in Fig. 4. The other case assumes that the charge movement occurs in large elementary jumps and that the macroscopic gating current is the sum of those charge shots. In principle, if the charge is moving in discrete packets, it should be possible to detect those elementary events as it has been possible to detect the elementary events of pore conduction. The problem is that those events are predicted to be very fast and extremely small and not detectable above background noise with present techniques. However, if those events do exist, they should produce detectable fluctuations in the gating currents recorded from a relatively small number of channels. The fluctuation analysis is done by repeating the same voltage pulse and recording a large number of gating current traces. From these traces, an ensemble mean value and an ensemble variance are obtained that allows the estimation of the elementary event (Fig. 6) Gating current noise analysis was first done in Na channels expressed in oocytes [28] where indeed it was possible to detect fluctuations that were used to estimate an elementary charge of 2.2 . A similar analysis was done in Shaker-IR K channel [29], and the elementary charge was found to be 2.4 . This value corresponds to the maximum shot size, and if it were per subunit it would account for only 9.6 or 3.6 less than the measured for the whole channel. This means that there 13 is a fraction of the total charge that produces less noise and then it may correspond to smaller shots or even a continuous process. Fig. 6 shows the mean and variance for a large pulse (to 30 mV) and a smaller depolarization (to 40 mV). For the small depolarization [Fig. 6(b)], gating current noise increases by the time that more than half of the charge has moved. This indicates that at early times the elementary event is smaller than at longer times. The gating current decreases with two exponential components, which are more separated in time at small depolarizations. Therefore, it is possible to attribute the small shots to the fast component and the large shots to the slow component. This would indicate that the early transitions of the gating
40
IEEE TRANSACTIONS ON NANOBIOSCIENCE, VOL. 4, NO. 1, MARCH 2005
likely possibility. Since the first channel was cloned, it was recognized that the S4 segment with its basic residues would be the prime candidate for the voltage sensor. By introducing mutations that neutralize the charges in S4, several studies found that there were clear changes in the voltage dependence of the conductance. However, shifts in the voltage dependence of the – curve or even apparent changes in slope in the voltage range of detectable conductance do not prove that charge neutralization is decreasing the gating charge. The proof for requires the measurement of the charge per channel each one of the neutralizations. If, after neutralization of a charged residue, the charge per channel decreases, one may assume such charge is part of the gating current. Using the methods to measure total charge per channel discussed above in Shaker, two groups found that the four most extracellular positive charges in S4 and that one negative charge in the S2 segment were part of the gating charge [24], [26] (see white symbols in Fig. 1). It is interesting to note that in several instances a neutralization of one particular residue decreased the total gating charge by more than 4 . This indicates that somehow the charges interact with the electric field where they are located such that the elimination of one charge can affect the field seen by the remaining charges. If most of the gating charge is carried by the S4 segment (4 per subunit), it gives for the a total of 16 . Therefore, to account for the 13 total channel obtained from charge/channel measurements, they all must move at least 81% of the membrane electric field . Fig. 6. Current fluctuations in gating currents. (a) Top trace is the time course of a pulse to 10 mV; middle trace is the variance and bottom trace is the mean computed from several hundred traces. (b) Top trace is the time course of a smaller pulse to 40 mV; middle trace is the variance; lower trace is the mean computed from hundreds of traces. Modified from [28].
+
0
current are made up of several steps, each carrying a small elementary charge. The total movement of charge in the early transitions would have to account for the 3.6 needed to make the total of 13 per channel. We conclude from these experiments that the gating current of a single channel is made up of small shots at early times followed big shots of currents that in the average show two exponential decays. V. STRUCTURAL BASIS OF THE GATING CHARGES In this section, we will address the relation between the function of the voltage sensor and its structural basis. We will first ask where are the charges or dipoles in the structure of the channel and then how those charges or dipoles move in response to changes in membrane potential.
B. Movement of the Charges in the Field Knowing the residues that make up the gating charge is a big advance because it makes it possible to test their positions as a function of the voltage and, thus, infer the possible conformational changes. As we will see below, the literature contains a large number of papers (for a review, see [30] and [31]) with many types of biophysical experiments testing the accessibility, movement, and intramolecular distance changes. With all these data, models of the voltage sensor movement were proposed that could account for all the experimental observations but in total absence of solid information on the three-dimensional (3-D) structure of the channel. In Section VI, we will discuss many of the biophysical measurements of the voltage sensor and the models that have emerged from them and the recently solved crystal structure of KvAP [32].
VI. STRUCTURAL BASIS OF THE VOLTAGE SENSOR A. The Structures Responsible for the Gating Charge Movement There are many ways one could envision how the charge movement is produced by the channel protein. The putative -helical transmembrane segments have an intrinsic dipole moment that upon tilting in the field would produce an equivalent charge movement. Also, induced dipoles of amino acids per side chains could accomplish the same. However, 13 channel is very large, and charged amino acids become the most
A 3-D structure of the channel, even in only one conformation, would be invaluable as a guideline in locating the charges inside the protein and in proposing the other conformations that account for the charge movement consistent with all the biophysical measurements. We will see below that the only crystal structure of a voltage-dependent channel available is not in a native conformation. Therefore, we are still relying on data that can only be used to propose models that are still uncertain as they lack information on the 3-D structure of the channel.
BEZANILLA: VOLTAGE-GATED ION CHANNELS
41
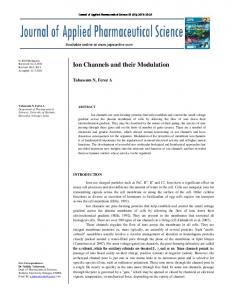
Fig. 7. Three models of the voltage sensor. (a) Helical screw model. (b) Transporter model. (c) Paddle model. Following the chemical convention, positively charged residues are in blue. For details, see text.
A. The Crystal Structure of KvAP Recently, the long-awaited first crystal structure of a voltagedependent channel, KvAP from archea Aeropirum pernix, has been published [32]. The structure was a surprise because it showed the transmembrane segments in unexpected positions with respect to the inferred bilayer. For example, the N-terminal was buried in the bilayer whereas it has been known to be intracellular; the S1–S2 linker is also buried although it has been previously shown to be extracellular. The S4 segment, along with the second part of S3 (S3B) formed the paddle structure that was intracellular and lying parallel to the bilayer, a location that would be interpreted as the closed position of the voltage sensor. However, the pore gates in the same crystal structure clearly correspond to an open state. Thus, the crystal structure is in a conformation that was never observed functionally, raising the question whether that crystal structure of KvAP is indeed representative of the native conformation of the channel in the bilayer. The authors mention that the channel is inherently floppy; therefore, in obtaining the structure, it was necessary to cocrystallize it with Fab fragments attached to the S3–S4 loop of the channel. This raises the possibility that the fragments may have distorted the channel structure that was in the final crystal. The authors functionally tested the structure by incorporating the channel in bilayers and recording the currents through the channel after Fab fragments were added to the inside or to the outside of the channel. The Fab fragment did not attach from the inside but only from the outside, showing that the position of the S3–S4 shown in the crystal structure (obtained in detergent) did not represent a native conformation of the channel in the bilayer [33].
Along with the crystal structure of the full KvAP channel, Jiang et al. [32] solved the crystal structure of just the S1 through S4 region of KvAP. This crystal showed similarities but was not identical to the S1–S4 region of the full KvAP crystal structure [34]. This second crystal was docked to the pore region of the full crystal maintaining the S2 segment within and parallel to the bilayer to obtain a new structure that was proposed in the open and closed conformations as the paddle model of channel activation. It is important to note here that the structures shown in the second paper [33] do not correspond to the original KvAP structure. In fact the proposed structures of the model depart so much from the crystal structure that we should treat them just like any other model of activation proposed before. B. Models of Sensor Movement A compact way of reviewing the large body of biophysical information on structural changes of the voltage sensor is to describe the models that are currently proposed to explain the operation of the voltage sensor. Fig. 7 shows schematically three classes of model that have been proposed to explain the charge movement in voltage-dependent channels. In all cases, only two of the four sensors are shown and the coupling from the sensor to the gate is not shown explicitly. In addition, the charge that moves resides completely in the first four charges of the S4 segment. The common feature of all three models is that the charge is translocated from the inside to the outside upon depolarization. However, there are important differences as of how those charges relocate in the protein structure. Fig. 7(a) shows the conventional helical screw model [35], [36]. Although there are variations on this model, the general
42
idea is that upon depolarization the S4 segment rotates along its axis and at the same time translates as a unit perpendicular to the membrane, thus changing the exposure of the charges from the intracellular to the extracellular solution, effectively per subunit [see Fig. 7(a)]. In the original translocating 4 version of the model, the change of exposure required a large 16- translocation of the S4 segment, and the positively charged arginines were making saline bridges with aspartate or glutamates residues that had to be broken to initiate the movement. In more recent versions [37]–[39], the charges are in water crevices in both the closed and open position, decreasing the amount of translation required of the S4 segment. Fig. 7(b) shows the transporter model [40]–[42]. In the closed position, the charges are in a water crevice connected to the intracellular solution, and in the open position they are in another water crevice connected to the extracellular solution. The translocation of the charges is achieved by a tilt and rotation of the S4 segment with little or no translation. In this case, the field is concentrated in a very small region that changes from around the first charge in the closed state to the fourth charge in the open state. Fig. 7(c) shows the paddle model introduced by the MacKinnon group [33] where the S4 segment is located in the periphery of the channel and the charges are embedded in the bilayer. The S4 segment makes a large translation such that the most extracellular charge goes from exposed to the extracellular medium in the open state to completely buried in the bilayer in the closed state. The helical screw and transporter models are similar but they differ dramatically from the paddle model in that the gating charges in the paddle model are embedded in the bilayer, while in the helical screw and transporter models, the charges are surrounded by water, anions, or making salt bridges. In contrast with the transporter model, the helical screw model has in common with paddle models the large translation of the S4 segment. In Sections VI-C–VI-E, we will review biophysical experiments that were designed to test the topology of the channel and the extent of the conformational changes of the gating charge. In the absence of a native crystal structure, these experiments are the only data that we can use to support or reject the available models of voltage sensor operation. C. The Topology of the Channel and Gating Charge Location Alanine and tryptophan scanning have been used to infer the relative positions of the transmembrane segments [43], [44], and the results indicate that the S1 segment is in the periphery of the channel. This result is at odds with the recent report by Cuello et al. [45] where using electron paramagnetic resonance (EPR) scanning, they found that in KvAP the S1 segment is not exposed to the bilayer but rather surrounded by the rest of the protein. This difference could be an inherent limitation in the ala or tryp scanning techniques that test the function of the channel, or it could be a genuine difference between eukaryotic and prokaryotic channels. On the other hand, their report shows that the S4 segment seems to be exposed to the bilayer, in agreement with the paddle model although the charged residues seem
IEEE TRANSACTIONS ON NANOBIOSCIENCE, VOL. 4, NO. 1, MARCH 2005
to be protected, contrary to the location proposed in the paddle model. Laine et al. [46] found that the extracellular part of the S4 segment gets within a few Ångstroms of the pore region in the open state of Shaker-IR channel. This result is consistent with the helical screw and the transporter model but is inconsistent with the paddle model presented in [33] because in their model the extracellular portion of S4 is well separated from the rest beof the channel protein, giving a distance of about 98 tween segments across the pore region. In experiments using resonance energy transfer with lanthanides [47], [48] or with organic fluorophores [49], that distance was found to be around 50 A, also in agreement with measurements done with tethered TEA derivatives [50] These results indicate that the S4 segment is not extended into the bilayer but is against the bulk of the channel protein. If the paddle model were modified, so that the S4 segments would be almost perpendicular to the plane of the bilayer in the open state and almost parallel to the bilayer in the closed state but still flush against the rest of the protein, it would be consistent with the distance constraints just mentioned. In a more recent report, the MacKinnon group made such modification at least for the open-inactivated state [51]. However, even with these modifications the paddle model locates the charges in the bilayer, a proposal that is inconsistent with the EPR results [45] and several other biophysical experiments [52], [54]–[63]. Locating the charges in the bilayer has been a subject of intensive debate because the energy required in moving a charge into the low dielectric constant bilayer is extremely high [5]. If positively charged gating charges are neutralized by making salt bridges with acidic residues, the energy decreases [5] but there would not be any gating charge movement. Evidence obtained by charge measurements in the squid axon sodium channel has shown that the gating charges do not move in the bilayer [52] In these experiments, addition of chloroform increased the kinetics of translocation of the hydrophobic ion dipycrilamine while it did not change the kinetics of the sodium gating currents. The conclusion was that the gating charge, unlike hydrophobic ions, does not move in the bilayer. Ahern and Horn [38] have explored this subject in more detail. As in the paddle model the S4 segment is in the bilayer, they reasoned that on addition of more charges in the S4 segment, the net gating charge should increase. Their results show that the charge addition at several positions did not increase the gating charge, indicating that only the charges in aqueous crevices are responsible for gating and can sense the changing electric field. Both these experimental results are hard to reconcile with the paddle model where the voltage sensor is immersed in the hydrophobic core of the lipid bilayer. The S1–S2 loop has been clearly located in the extracellular region by several criteria. One is that a glycosylation site in Shaker occurs in this loop [53]. In addition, fluorescence signals from fluorophores attached in this loop are consistent with this region being extracellular [54], as well as the recent EPR scanning of KvAP [45]. These results are in agreement with the helical screw and transporter models but are again inconsistent with the location proposed in the paddle model. In the KvAP crystal structure the S1–S2 linker is buried in the bilayer with an S2 segment almost parallel and also buried in the bilayer.
BEZANILLA: VOLTAGE-GATED ION CHANNELS
In fact, this orientation of the S2 segment was the basis to dock the S1–S4 crystal to the rest of the crystal to propose the paddle model. D. Voltage-Induced Exposure Changes of the S4 Segment and Its Gating Charges Testing the exposure of the gating charges in the intra- or extracellular medium would give us an idea whether their voltageinduced movement takes them out of the protein core or from the lipid bilayer. There have been three different approaches to test exposure. The first method, cysteine scanning mutagenesis, consists of replacing the residue in question by a cysteine and then test whether a cysteine reagent can react from the extra or intracellular solution and whether that reaction is affected by voltage [55]–[59]. The second method, histidine scanning mutagenesis, consists on titrating with protons the charge in the residues. In this case, as the pKa of the arginine is very high, histidine was used as a replacement allowing the titration in a pH range tolerated by the cell expressing the channel [41], [60], [61]. The third method consists of replacing the residue in question with a cysteine, followed by tagging it with a biotin group and then testing whether streptavidin can react from the inside or outside depending on the membrane potential [33]. The outcome of all these experiments is that indeed the charged residues in S4 undergo changes in exposure when the membrane potential is changed. However, it is important to look at each of these procedures with their limitations and compare their results because that may reveal many details of the actual movement of the charge. Cysteine scanning mutagenesis. The experiments by Yang and Horn [55] were the first to test the accessibility of charged groups to the extra and intracellular solutions and its dependence on membrane potential. The idea of these experiments is to test whether a cysteine reacting moiety can attach to an engineered cysteine in the channel depending where the moiety is and what the electric field is. This method works provided the attachment induces a detectable change in the channel currents. In addition, the attachment of the moiety will depend on the local pH and state of ionization of the cysteine residue. Yang and Horn [55] showed that the reaction rate of MTSET to the cysteine replaced most extracellular charge of the S4 segment of the fourth domain of a sodium channel depended on membrane potential. To conclude that a particular site changes its exposure, the reaction rate must differ by more than an order of magnitude between the two conditions. This is important because if one just measures whether the reaction occurred or not, one may be sampling a rarely occurring conformational state. Their result showed for the first time that the accessibility of this group changed with voltage or alternatively that the ionization state was changed by voltage. This work was expanded to the deeper charges in the S4 segment of domain IV of the Na channel [56]. The conclusion was that upon depolarization the most extracellular charge was exposed and that at hyperpolarized potential it became buried. In addition, the two following charges could be accessed from the inside at hyperpolarized potential and from outside at depolarized potential. The next two deeper charges were always accessible from the inside regardless of the membrane potential. These results strongly suggest
43
that the three outermost charges change exposure with voltage and are consistent with the idea of a conformational change that translocates charges from inside to outside upon depolarization giving a physical basis to the gating currents. These studies were also done in the Shaker-IR K channel [57]–[59] and showed the same trend: the outermost charges were exposed to the outside upon depolarization and the innermost to the inside on hyperpolarization. While some residues were inaccessible from one side to the cysteine-reacting compound on changing the voltage, there were a few that reacted when the reactive agent was added to the other side. The conclusion from the cysteine scanning experiments is that the residues bearing the gating charges change their exposure with the voltage-dependent state of the channel. Another very important conclusion is that the charges are exposed to the solutions and not to the lipid bilayer, since the SH group in the cysteine has to be ionized to react with the cysteine modifying reagent. This would be energetically unfavorable in the low dielectric medium of the bilayer. It is important to note that the reactivity of thiol groups on some the sites tested was comparable to their reactivity in free solution. Histidine scanning mutagenesis. Testing the titration of the charged residues is a direct way to address exposure of the charges to the solutions. In this approach, each arginine or lysine is exchanged to a histidine residue that can be titrated in a pH range that is tolerated by the expression system. The titration of the histidine with a proton can be easily detected as a change in the gating current, provided the ionic current is blocked. For this reason, most of these experiments were carried out in the nonconducting Shaker-IR K channel that bears the W434F mutation. The logic of this procedure can be understood by taking some limiting cases. 1) If the histidine is not exposed to the solutions and/or if it does not move in the field, it would not be possible to titrate it from either side or under any membrane potential; therefore, no change in the gating currents are observed. 2) The histidine can be exposed to the inside or to the outside depending on the membrane potential and thus on the conformation of the voltage sensor. In this case, if a pH gradient is established, every translocation of the voltage sensor would also translocate a proton, thus producing a proton current. This proton current would be maximum at potentials where the sensor is making most excursions which occurs around the midpoint of the – curve. At extreme potentials, the gating current would be affected but no steady proton current would be observed. Therefore, the – curve of such proton current would be bell-shaped. 3) One particular conformation of the sensor locates the histidine as a bridge between the internal and external solutions forming a proton selective channel. In this case a steady current would be observed that would have an almost linear – curve in the range of potentials where that conformation is visited and would be zero otherwise. The analysis of histidine scanning was done in Shaker-IR K channels and six charges were tested starting from the most
44
Fig. 8. Results of histidine scanning mutagenesis. (a) Each mutant is listed with the type of current observed and their accessibility to the internal and external solutions. In the case of K374H and R377H, the histidine may not be accessible and/or they do not move in the field. (b) Interpretation of the histidine scanning experiments with the transporter model based on a molecular model built with KvAP and KcsA crystal structures [42], [80]. A change in tilt of the S4 segment exposes the first four charges to the outside in the depolarized condition and to the inside in the hyperpolarized condition. In the hyperpolarized condition, there is a very narrow region bridged by histidine in position 362 and in the depolarized condition a bridge is formed by histidine in position 371. For details, see text.
extracellularly located [41], [60], [61]. Fig. 8(a) shows the results where the accessibility of each of the mutant is shown. The first four charges are accessible from both sides depending on the membrane potential, while the next two are not titratable. These results are consistent with what we know about the role of each charge. Only the first four charges, which are responsible for most of the gating charge, seem to translocate, while the next two either do not move in the field or are never accessible from the solution. The results also show that some of the charges that appeared buried to the cysteine scanning mutagenesis method are accessible to protons indicating that they are pointing into deep crevices that are too narrow for the cysteine-modifying reagent but large enough for protons to reach. Fig. 8(b) shows how the results could be explained in terms of an actual structure of the S4 segment with its associated membrane segments and bilayer, based on a transporter-like molecular model [42], [80] built with the crystal structures of KvAP and KcSA. The alpha-helical S4 segment is represented by a cylinder showing the first four charged arginines, as labeled. The
IEEE TRANSACTIONS ON NANOBIOSCIENCE, VOL. 4, NO. 1, MARCH 2005
next two arginines are on the back side of the S4 helix and are not visible. The hydrophobic region, which includes other segments and the bilayer, is simply shown as a gray area. In the closed state, the first four charges are in contact with the internal solution by way of a water crevice (up arrow); however, the most extracellular charge (R362) is in the boundary between the intracellularly connected water crevice and the extracellular solution. If this arginine were replaced by a histidine, it would form a proton pore by making a bridge between both solutions. Upon depolarization, the S4 segment changes its tilt, and all four charges become exposed to a water crevice (down arrow) connected to the extracellular solution. Now the fourth charge is in the boundary between the extra and intracellular solutions so that a histidine in this position would form a proton pore. Notice that R365 (and also R368) change exposure in such a way that if each one were replaced by a histidine in the presence of a proton gradient, every transition would be able to shuttle one proton from one side to the other. It was found that R371H is a transporter but it can also form a proton pore at large depolarized potentials [61]. The consequence of these results is that in the two extremes positions the electric field is concentrated [62] in a very narrow region of the protein: near 362 in the closed position and near 371 in the open position. This means that there is no need for a large movement of the voltage sensor to transport a large amount of charge. Asamoah et al. [63] have shown that indeed the field is concentrated in this region by using a cysteine reactive electrochromic fluorophore. By attaching this fluorophore in different regions of the channel and comparing the fluorescence signal induced by voltage changes with the same electrochromic group in the bilayer, the field in the S4 region was found to be at least three times more intense. The results of histidine and cysteine scanning experiments suggest that the charged arginine residues are stabilized by water and possible anions residing in the water filled crevices. It has been shown by Papazian and collaborators [64], [65] that the acidic residues in S2 and S3 segments play a stabilizing role in the structure of Shaker-IR channel but they could also lower the energy of the ariginines in the crevices and possibly contribute to the gating charge by focusing the field in that region. Biotin and streptavidin scanning. Biotin has a length of about 17 and its cysteine modifying derivative can react with cysteines engineered in the channel protein. In addition, the biotin group binds avidin, a large soluble protein molecule that is not expected to cross the membrane. Jiang et al. [33] studied several positions by mutating residues to cysteine in S3b and S4 segments of KvAP and attached to it a biotin molecule. After incorporating these channels into bilayers, they tested whether the currents were affected by avidin in the external or internal solutions. They found that, depending on the site of biotin attachment, the currents were decreased by externally or internally applied avidin. There were two sites, (121 and 122) lying in between the second and third charges of KvAP, where they saw inhibition by avidin from both sides. They indicated that in the conventional model (helical screw or transporter models) it would be extremely difficult to relocate the linker of the biotin along with the charges moving within the protein core. Therefore, they proposed that those sites must move a large distance
BEZANILLA: VOLTAGE-GATED ION CHANNELS
within the bilayer to reach for the avidin present in the solution and gave them the basic restrictions on the extent that the paddle must move. Although this result is consistent with the paddle model, it is not inconsistent with the transporter model because those residues may in fact be facing the bilayer [42] and thus allowing the biotin to reach to either side of the bilayer to attach to the avidin. It should be noted that no reaction rate was measured in those experiments [33], so that it is also possible that their inferred conformations were rarely visited. E. Fluorescence Spectroscopy Reveals Conformational Changes of the Voltage Sensor Site-directed fluorescence is a powerful technique to follow conformational changes in a protein. In the case of voltage dependent channels, the idea is to label specific sites of the channel protein with a fluorophore and measure changes in fluorescence induced by changes in the field. The salient feature of this technique is that the changes measured reflect local changes in or near the site where the fluorophore is located in the protein as opposed to electrical measurements that reflect overall conformations of the protein. Two main types of measurements have been done with site-directed fluorescence. One is the detection of fluorescence intensity changes of one fluorophore in the labeled site, and the other is the estimation of distance and distance changes between two fluorophores using fluorescence resonance energy transfer (FRET). Site-directed fluorescence changes. In these experiments, the site of interest is mutated to a cysteine and then is reacted to a fluorophore that has a cysteine reactive group and the time course of fluorescence is monitored during pulses applied to open or close the channel [66], [67]. To detect a fluorescence change, the conformational change must change the environment around the fluorophore so that the intensity changes because of spectral shifts, quenching, or dye reorientation. In most cases, the changes in fluorescence have been traced to changes in the quenching environment around the fluorophore [67], [68], and in a few cases it is produced by spectral shifts of the fluorophore as the hydrophobicity of the environment changes with the change in conformation [54]. In some cases, the presence of quenching groups in the protein is crucial in obtaining a signal. For example, in the bacterial channel NaChBac, the signals are very small or in some sites not detectable [69], although there are four charges in the S4 segment following the classical pattern and the total gating charge was recently measured to be about 14 [70]. This result has been traced to the lack of quenching groups in the structure of this channel [69]. To obtain signals from sites near the S4 segment upon changes of membrane potential, a requirement seems to be the presence of glutamate residues in the nearby region that act as quenching groups [69]. Fluorescence changes in site-directed fluorescent labeling have provided information of local conformational changes around the S4 segment, the S3–S4 linker, the S1–S2 linker, and the pore region as a result of changes in membrane potential [66], [67], [71]. In the absence of 3-D structure, the interpretation of these fluorescence changes is not straightforward because the exact location of the fluorophore is unknown.
45
However, several important qualitative results have been obtained. For example, it has been found that the kinetics of the fluorescence changes in S4 are slower than around the S1–S2 linker, suggesting that there might be earlier conformational changes that precede the main conformational change normally attributed to the S4 segment [67]. Also, the time course of fluorescence changes near the pore region are much slower than channel activation and their kinetics can be traced to another gating process called slow inactivation in Shaker K channel [67], [71]. Probably one of the most informative results have been obtained in the sodium channel because, as this technique detects local changes, it has been possible to distinguish specific functions for each one of the four domains of the Na channel. Fast inactivation is another gate that operates by blocking the channel pore [1], [72], [73]. By labeling the S4 segment of each domain of the Na channel, it was found that the gating charge immobilization produced by inactivation only occurred in domains III and IV, thus locating the regions of the channel that interact with the inactivating particle [73]. The kinetics of the fluorescence of sites in S4 was found to be very fast in domains I–III but slower in domain IV, indicating that domain IV followed the other three domains [75]. Finally, by comparing the effect of a perturbation in one domain to the fluorescence signal in another domain, it was found that all four domains of the Na channel move in cooperative fashion. This result is important in explaining why sodium channels are faster than potassium channels, an absolute requirement in eliciting an action potential [19]. For more details on the voltage-dependent sodium channel, see the paper by French and Zamponi in this issue. Resonance energy transfer. By labeling the protein with a donor and an acceptor fluorophore, it is possible to estimate the distance between them using the Förster theory of dipole–dipole interaction [76]. Depending on the fluorophore pair used, those distances can be from a few to about 100 , thus enabling the measurements of intramolecular distances and changes in distances. This technique was used to estimate distances and distance changes between subunits in Shaker-IR channel by Cha et al. [47] and Glauner et al. [49]. Cha et al. [47] used a variant of FRET called LRET that uses a lanthanide (terbium) as a donor and has the advantage that the estimation of the distances are more accurate mainly because the orientation factor is bound between tight limits giving an uncertainty of 10 [77]). Both studies [47], [49] showed that the distances between S4 segments were around 50 and that it did not change very much from the closed to the open states. The maximum distance change measured by Cha et al. [47] was about 3 while Glauner et al. [49] measured about 5 . These measurements were all done between subunits; therefore, they do not completely rule out a translation across the bilayer, as proposed in the paddle model. In Shaker K channel, the linker between S3 and S4 is made of about 30 residues. At least six of the residues close to the extracellular part of S4 seem to be in alpha-helical conformation [78] suggesting that S4 is extended extracellularly as an alpha helix. This would explain why Cha et al. [47] measured changes in distance in the S3–S4 linker as a result of membrane potential changes. One of those changes is a rotation in the linker and
46
the other is a decrease in the tilt of the S4 with its extension upon depolarization, providing a possible mechanism for charge translocation (see Fig. 8). The question of how much translation the S4 undergoes across the bilayer with depolarization has been approached with two other variants of FRET. In the first series of experiments [79], green fluorescent protein (eGFP) was inserted after the S6 of Shaker K channel and was used as the donor to an acceptor attached in the extracellular regions of the channel. In this case, the acceptor was a sulforhodamine with an MTS reactive group that can react with an engineered cysteine in the channel but it also can be cleaved off with a reducing agent. This allows the measurement of donor fluorescence (intracellularly located) in presence and absence of acceptor (in the extracellular regions of the channel) to compute the energy transfer and the distance. These measurements were done in multiple sites of the S1–S2 loop, S3–S4 loop, and S4 segment under depolarized and hyperpolarized conditions giving changes in distance that did not exceed 2 . In fact, some sites increased while others decreased their distance to the intracellular donor upon depolarization, indicating that there is little translation of the S4 across the membrane. The second method used the hydrophobic ion dipycrilamine (dpa) as an acceptor that distributes in the edges of the bilayer according to the membrane potential [52], [80]. The donor was rhodamine attached to specific sites in the S4 segment. The experiment predicts a clear distinction for the outcome depending whether the S4 does or does not make a large translation across the membrane. If the S4 segment undergoes a large translation across the bilayer such that the donor crosses its midpoint, then a transient fluorescence decrease is expected because dipycrilamine and the fluorophore start and end in opposite sides of the membrane but there is a period where both donor and acceptor reside simultaneously in both sides of the membrane increasing transfer and consequently decreasing donor fluorescence. On the other hand, if there is no crossing of the bilayer midline by the donor, the fluorescence will increase if the donor is above the midline or decrease if it is below, but no transient should be observed. The results of at least four sites are consistent with no crossing of the midline strongly suggesting that the S4 does not make a large translation upon depolarization [80]. Finally, one more experiment using LRET confirms the lack of large translation of the S4 [81]. In this case, the donor is Tb (in chelate form) attached in several sites of the S4 segment and the S3–S4 linker while the acceptor is in a toxin that blocks the pore of Shaker from the extracellular side. Results show that the changes in distance between the toxin and several tested sites in the S3–S4 linker and S4 segment do not exceed 2 upon depolarization. A recent molecular dynamic calculation of the voltage sensor of a K channel under the influence of an electric field also supports a conformational change that involves minimum translation [82]. In summary, FRET experiments are inconsistent with a large transmembrane displacement of the S4 segment in response to a voltage pulse. As many other experiments, presented above and discussed in recent papers and reviews [34], [40], [46], [83], [84], do not support the idea that the charged residues are in
IEEE TRANSACTIONS ON NANOBIOSCIENCE, VOL. 4, NO. 1, MARCH 2005
the bilayer, the two main features of the paddle model become inconsistent with the available data. VII. COUPLING OF THE SENSOR TO THE GATE In contrast to a field-effect transistor where gating of the channel is produced by a change in space charge, the gate in voltage-gated channels seem to be a mechanical obstruction to flow [30]. The crystal structure of the bacterial channel KcSA reveals a closed state of the channel and Perozo et al. [85] found that when it opens the S6 makes a scissor-like action allowing ions to go through. The crystal structure of MtsH, another prokaryot channel, shows an open pore where a glycine in the S6 segment is shown to break the S6 in two segments [86]. This led MacKinnon to propose that the gate opens when the S6 segment is broken and the intracellular part is pulled apart [87]. In the crystal structure of the voltage-dependent prokaryot channel, KvAP the pore is in the open conformation by a break in the S6 segment in a glycine residue [32]. In the case of the eukaryotic Shaker K channel, there is a PVP sequence in the S6 segment that has been proposed to be the actual gate [88]. In addition to the main gate formed by the bundle crossing of the S6 segments, there is now very good evidence that the selectivity filter can also stops conduction, thus introducing another gate in series [89]. However, there is no evidence or a physical mechanism to couple this filter gate to the movement of the sensor. The question of how and what kind of physical movement of the sensor, mainly the S4 segment, couples the opening of the pore gate is far from resolved. Most of the proposals, including the paddle model, suggest that the change in position of the S4 couples via the intracellular S4–S5 linker to change the position of the S5 segment that in turn allows the opening of S6. In the transporter model [42], [80] the change in tilt of the S4 segment carries the S5 segment away from S6, allowing the break at the glycine and thus opening the pore. VIII. CONCLUSION The main component of the sensor of voltage-gated channels is the S4 segment with its basic residues moving in the field. The movement of the sensor in response to changes in the electric field produces the gating currents. The study of gating currents, single-channel currents, and macroscopic currents has generated detailed kinetic models of channel operation. The sensor couples to the gate possibly via the S4–S5 linker. The channel fully opens after all sensors have moved, and there is little cooperativity in the early movements of the sensor in the K channel but strong positive cooperativity in the Na channel. The results of a large variety of biophysical experiments have helped in delineating the conformational changes of the sensor. These data has shown that the S4 segment does not undergo large movements. Rather, the charges are in water crevices, and they only move a small distance because the field is focused in a narrow region within the protein core. In the absence of a crystal structure representative of the channel in its native form, we believe that the data support the transporter model or some of the most recent versions of the helical screw model of the voltage sensor. A detailed understanding of voltage gated channels means that we can represent the landscape of energy of the physical
BEZANILLA: VOLTAGE-GATED ION CHANNELS
states of the channel at atomic resolution together with the structural changes evoked by the electric field. To achieve this goal, it will not only require a static, high resolution 3-D structure, but also a detailed description of the kinetics of the voltage-induced conformational changes. The latter are expected to be obtained with spectroscopic and computational techniques. Fluorescence and EPR spectroscopies have started to unravel some of the details of conformational changes during gating but the study of detailed kinetics is still developing. For example, in the same way that single-channel current recordings were critical in understanding the operation of the pore and the gate, single-molecule fluorescence is expected to show the local conformational changes during voltage sensor operation and channel gating. These techniques are advancing very rapidly, and some results have already been published as just the conformational change [90], [91] or even correlated to current recordings [92], [93]. ACKNOWLEDGMENT The author would like to thank Drs. R. Blunck and B. Chanda for reading the manuscript and for their helpful and insightful comments. REFERENCES [1] A. L. Hodgkin and A. F. Huxley, “A quantitative description of membrane current and its application to conduction and excitation in nerve,” J. Physiol., vol. 117, pp. 500–544, 1952. [2] W. S. Agnew, S. R. Levinson, J. S. Brabson, and M. A. Raftery, “Purification of the tetrodotoxin-binding component associated with the voltage-sensitive sodium channel from electrophorus electricus electroplax membranes,” Proc. Nat. Acad. Sci. USA, vol. 75, pp. 2602–2610, 1978. [3] M. Noda, S. Shimizu, T. Tanabe, T. Takai, T. Kayano, T. Ikeda, H. Takahashi, H. Nakayama, Y. Kanaoka, and N. Minamino, “Primary structure of electrophorus electricus sodium channel deduced from cDNA sequence,” Nature, vol. 312, pp. 121–127, 1984. [4] T. M. Tempel, D. M. Papazian, T. L. Schwarz, Y. N. Jan, and L. Y. Jan, “Sequence of a probable potassium channel component encoded at Shaker locus in drosophila,” Science, vol. 237, pp. 770–775, 1987. [5] A. Parsegian, “Energy of an ion crossing a low dielectric membrane: Solutions to four relevant electrostatic problems,” Nature, vol. 221, pp. 844–846, 1969. [6] IEEE Trans. Nanobiosci. (Special Issue on Ion Channels), vol. 4, no. 1, pp. 1–9, Mar. 2005. [7] O. P. Hamill, A. Marty, E. Neher, B. Sackmann, and F. J. Sigworth, “Improved patch-clamp techniques for high-resolution current recording from cells and cell-free membrane patches,” Pflugers Arch., vol. 391, pp. 85–100, 1981. [8] C. M. Armstrong and F. Bezanilla, “Currents related to movement of the gating particles of the sodium channels,” Nature, vol. 242, pp. 459–461, 1973. [9] R. D. Keynes and E. Rojas, “Kinetics and steady-state properties of the charged system controlling sodium conductance in the squid giant axon,” J.Physiol. (London), vol. 239, pp. 393–434, 1974. [10] C. A. Vandenberg and F. Bezanilla, “A sodium channel model of gating based on single channel, macroscopic ionic and gating currents in the squid giant axon,” Biophys. J., vol. 60, pp. 1511–1533, 1991. [11] E. Perozo, R. MacKinnon, F. Bezanilla, and E. Stefani, “Gating currents from a nonconducting mutant reveal open-closed conformations in Shaker K channels,” Neuron, vol. 11, pp. 353–358, 1993. [12] W. N. Zagotta, T. Hoshi, J. Dittman, and R. Aldrich, “Shaker potassium channel gating III: Evaluation of kinetic models for activation,” J. Gen. Physiol., vol. 103, pp. 321–362, 1994. [13] F. Bezanilla, E. Perozo, and E. Stefani, “Gating of Shaker K channels. II. The components of gating currents and a model of channel activation,” Biophys. J., vol. 66, pp. 1011–1021, 1994. [14] N. E. Schoppa and F. J. Sigworth, “Activation of Shaker potassium channels. III. An activation gating model for wild-type and V2 mutant channel,” J. Gen. Physiol., vol. 111, pp. 313–342, 1998. [15] D. Sigg, H. Qian, and F. Bezanilla, “Kramers’ diffusion theory applied to gating kinetics of voltage dependent channels,” Biophys. J., vol. 76, pp. 782–803, 1999.
47
[16] D. Sigg, F. Bezanilla, and E. Stefani, “Fast gating in the Shaker K channel and the energy landscape of activation,” Proc. Nat. Acad. Sci., vol. 100, pp. 7611–7615, 2003. [17] R. Horn, S. Ding, and H. J. Gruber, “Immobilizing the moving parts of voltage-gated ion channels,” J. Gen. Physiol., vol. 116, pp. 461–476, 2000. [18] L. M. Mannuzzu and E. Y. Isacoff, “Independence and cooperativity in rearrangements of a potassium channel voltage sensor revealed by single subunit fluorescence,” J. Gen. Physiol., vol. 115, pp. 257–268, 2000. [19] B. Chanda, O. K. Asamoah, and F. Bezanilla, “Coupling interactions between voltage sensors of the sodium channel as revelaed by site-specific measurements,” J. Gen. Physiol., vol. 123, pp. 217–230, 2004. [20] D. Sigg and F. Bezanilla, “Total charge movement per channel: The relation between gating displacement and the voltage sensitivity of activation,” J. Gen. Physiol., vol. 109, pp. 27–39, 1997. [21] W. Almers, “Gating currents and charge movements in excitable membranes,” Rev. Physiol. Biochem. Pharmacol., vol. 82, pp. 96–190, 1978. [22] B. Hirschberg, A. Rovner, M. Lieberman, and J. Patlak, “Transfer of twelve charges is needed to open skeletal muscle Na channels,” J. Gen. Physiol., vol. 106, pp. 1053–1068, 1996. [23] F. Noceti, P. Baldelli, X. Wei, N. Qin, L. Toro, L. Birnbaumer, and E. Stefani, “Effective gating charges per channel in voltage-dependent K and Ca channel,” J. Gen. Physiol., vol. 108, pp. 143–155, 1996. [24] S.-A. Seoh, D. Sigg, D. M. Papazian, and F. Bezanilla, “Voltage-sensing residues in the S2 and S4 segments of the Shaker K channel,” Neuron, vol. 16, pp. 1159–1167, 1996. [25] N. E. Schoppa, K. McCormack, M. A. Tanouye, and F. J. Sigworth, “The size of gating charge in wild-type and mutant Shaker potassium channels,” Science, vol. 255, pp. 1712–1715, 1992. [26] S. K. Aggarwal and R. MacKinnon, “Contribution of the S4 segment to gating charge in the Shaker K channel,” Neuron, vol. 16, pp. 1169–1177, 1996. [27] F. T. Horrigan, J. Cui, and R. W. Aldrich, “Allosteric voltage gating of potassium channels I: mSlo ionic currents in absence of Ca ,” J. Gen. Physiol., vol. 114, pp. 277–304, 1999. [28] F. Conti and W. Stuhmer, “Quantal charge redistribution accompanying the structural transitions of sodium channels,” Eur. Biophys. J., vol. 17, pp. 53–59, 1989. [29] D. Sigg, E. Stefani, and F. Bezanilla, “Gating current noise produced by elementary transition in Shaker potassium channels,” Science, vol. 264, pp. 578–582, 1994. [30] G. Yellen, “The moving parts of voltage-gated ion channels,” Q. Rev. Biophys., vol. 31, pp. 239–295, 1998. [31] F. Bezanilla, “The voltage sensor in voltage-dependent channels,” Physiol. Rev., vol. 80, pp. 555–592, 2000. [32] Y. Jiang, A. Lee, J. Chen, V. Ruta, M. Cadene, B. T. Chait, and R. MacKchannel,” Nature, innon, “X-ray structure of a voltage-dependent K vol. 423, pp. 33–41, 2003. [33] Y. Jiang, V. Ruta, J. Chen, A. Lee, and R. MacKinnon, “The principle of gating charge movement in a voltage-dependent K channel,” Nature, vol. 423, pp. 42–48, 2003. [34] B. E. Cohen, M. Grabe, and L. Y. Jan, “Answers and questions from KvAP structure,” Neuron, vol. 39, pp. 395–400, 2003. [35] S. R. Durell and H. R. Guy, “Atomic scale structure and functional models of voltage-gated potassium channels,” Biophys. J., vol. 62, pp. 238–250, 1992. [36] W. A. Caterall, “Molecular properties of voltage-sensitive sodium channels,” Annu. Rev. Biochem., vol. 55, pp. 953–985, 1986. [37] C. S. Gandhi and E. Y. Isacoff, “Molecular models of voltage sensing,” J. Gen. Physiol., vol. 120, pp. 455–463, 2002. [38] C. A. Ahern and R. Horn, “Specificity of charge-carrying residues in the voltage sensor of potassium channels,” J. Gen. Physiol., vol. 123, pp. 205–216, 2004. [39] S. R. Durell, I. H. Shrivastava, and H. R. Guy, “Models of the structure and voltage-gating mechanism of the Shaker K channel,” Biophys. J., vol. 87, pp. 2116–2130, 2004. [40] F. Bezanilla, “Perspective: Voltage sensor movements,” J. Gen. Physiol., vol. 120, pp. 465–473, 2002. [41] D. M. Starace and F. Bezanilla, “A proton pore in a potassium channel voltage sensor reveals a focused electric field,” Nature, vol. 427, pp. 548–552, 2004. [42] F. Bezanilla and B. Roux, “Mechanism of voltage sensor operation in voltage-dependent channels,” Biophys. J., vol. 86, pp. 522a–522a, 2004. [43] S. A. Monks, D. J. Needleman, and C. Miller, “Helical structure and packing orientation of the S2 segment in the Shaker K channel,” J. Gen. Physiol., vol. 113, pp. 415–423, 1999. [44] Y. Li-Smerin, D. H. Hackos, and K. J. Swartz, “Alpha-helical structural elements within the voltage-sensing region domains of a K channel,” J. Gen. Physiol., vol. 115, pp. 33–50, 2000. [45] L. G. Cuello, M. Cortes, and E. Perozo, “Molecular architecture of the KvAP voltage dependent K channel in a lipid bilayer,” Science, vol. 306, pp. 491–495, 2004.
48
[46] M. Laine, M. C. Lin, J. P. Bannister, W. R. Silverman, A. F. Mock, B. Roux, and D. M. Papazian, “Atomic proximity between S4 segment and pore domain in Shaker potassium channels,” Neuron, vol. 39, pp. 467–481, 2003. [47] A. Cha, G. Snyder, P. R. Selvin, and F. Bezanilla, “Atomic scale movement of the voltage-sensing region in a potassium channel measured via spectroscopy,” Nature, vol. 402, pp. 809–813, 1999. [48] J. Richardson, D. M. Starace, F. Bezanilla, and A. M. Correa, “Scanning NaChBac topology using LRET,” Biophys. J., 2005, to be published. [49] K. S. Glauner, L. M. Mannuzzu, C. S. Gandhi, and E. Y. Isacoff, “Spectroscopic mapping of voltage sensor movements in the Shaker potassium channel,” Nature, vol. 402, pp. 813–817, 1999. [50] R. O. Blaustein, P. A. Cole, C. Williams, and C. Miller, “Tethered blockers as molecular ’tape measures’ for a voltage-gated K channel,” Nat. Struct. Biol., vol. 7, pp. 309–311, 2000. [51] Q.-X. Jiang, D.-N. Wang, and R. MacKinnon, “Electron microscopic analysis of KvAP voltage dependent K channel in an open conformation,” Nature, vol. 430, pp. 806–810, 2004. [52] J. M. Fernandez, F. Bezanilla, and R. E. Taylor, “Effect of chloroform on the movement of charges within the nerve membrane,” Nature, vol. 297, pp. 150–152, 1982. [53] Santacruz-Toloza, L. Y. Huang, S. A. John, and D. M. Papazian, “Glycosylation of Shaker potassium channel protein in insect cell culture and in xenopus oocytes,” Biochemistry, vol. 33, pp. 5607–5613, 1994. [54] O. K. Asamoah, B. Chanda, and F. Bezanilla, “A spectroscopic survey of gating-induced environmental changes in the Shaker potassium channel,” Biophys. J., vol. 86, p. 432a, 2004. [55] N. Yang and R. Horn, “Evidence for voltage-dependent S4 movement in sodium channels,” Neuron, vol. 15, pp. 213–218, 1995. [56] N. Yang, A. L. George, and R. Horn, “Molecular basis of charge movement in voltage-gated sodium channels,” Neuron, vol. 16, pp. 113–122, 1996. [57] O. S. Baker, H. P. Larsson, L. M. Mannuzzu, and E. Y. Isacoff, “Three transmembrane conformation and sequence-dependent displacement of the S4 domain in Shaker K channel gating,” Neuron, vol. 20, pp. 1283–1294, 1998. [58] H. P. Larsson, O. S. Baker, D. S. Dhillon, and E. Y. Isacoff, “Transmembrane movement of the Shaker K channel S4,” Neuron, vol. 16, pp. 387–397, 1996. [59] S. P. Yusaf, D. Wray, and A. Sivaprasadarao, “Measurement of the movement of the S4 segment during activation of a voltage-gated potassium channel,” Pflugers Arch. Eur. J. Physiol., vol. 433, pp. 91–97, 1996. [60] D. M. Starace, E. Stefani, and F. Bezanilla, “Voltage-dependent proton transport by the voltage sensor of the Shaker K channel,” Neuron, vol. 19, pp. 1319–1327, 1997. [61] D. M. Starace and F. Bezanilla, “Histidine scanning mutagenesis of basic residues of the S4 segment of the Shaker K channel,” J. Gen. Physiol., vol. 117, pp. 469–490, 2001. [62] L. D. Islas and F. J. Sigworth, “Electrostatics and the gating pore of Shaker potassium channels,” J. Gen. Physiol., vol. 117, pp. 69–89, 2001. [63] O. K. Asamoah, J. P. Wuskell, L. M. Loew, and F. Bezanilla, “A fluorometric approach to local electric field measurements in a voltage-gated ion channel,” Neuron., vol. 37, pp. 85–97, 2003. [64] D. M. Papazian, X. M. Shao, S.-A. Seoh, A. F. Mock, Y. Huang, and D. H. Weinstock, “Electrostatic interactions of S4 voltage sensor in Shaker K channel,” Neuron, vol. 14, pp. 1293–1301, 1995. [65] S. K. Tiwari-Woodruff, C. T. Schulteis, A. F. Mock, and D. M. Papazian, “Electrostatic interactions between transmembrane segments mediate folding of Shaker K channel subunits,” Biophys. J., vol. 72, pp. 1489–1500, 199. [66] L. M. Mannuzzu, M. M. Moronne, and E. Y. Isacoff, “Direct physical measure of conformational rearrangement underlying potassium channel gating,” Science, vol. 271, pp. 213–216, 1996. [67] A. Cha and F. Bezanilla, “Characterizing voltage-dependent conformational changes in the Shaker K channel with fluorescence,” Neuron, vol. 19, pp. 1127–1140, 1997. [68] , “Structural implications of fluorescence quenching in the Shaker K channel,” J. Gen. Physiol., vol. 112, pp. 391–408, 1998. [69] R. Blunck, D. M. Starace, A. M. Correa, and F. Bezanilla, “Detecting rearrangements of Shaker and NaChBac in real-time with fluorescence spectroscopy in patch-clamped mammalian cells,” Biophys. J., vol. 86, pp. 3966–3980, 2004. [70] A. Kuzmenkin, F. Bezanilla, and A. M. Correa, “Gating of the bacterial sodium channel NaChBac: Volatge dependent charge movement and gating currents,” J. Gen. Physiol., vol. 124, pp. 349–356, 2004. [71] E. Loots and E. Y. Isacoff, “Protein rearrangements underlying slow inactivation of the Shaker K channel,” J. Gen. Physiol., vol. 112, pp. 377–389, 1998.
IEEE TRANSACTIONS ON NANOBIOSCIENCE, VOL. 4, NO. 1, MARCH 2005
[72] C. M. Armstrong and F. Bezanilla, “Inactivation of the sodium channel. II. Gating current experiments,” J. Gen. Physiol., vol. 70, pp. 567–590, 1977. [73] T. Hoshi, W. N. Zagotta, and R. W. Aldrich, “Biophysical and molecular mechanisms of Shaker potassium channel inactivation,” Science, vol. 250, pp. 533–538, 1990. [74] A. Cha, P. C. Ruben, A. L. George, E. Fujimoto, and F. Bezanilla, “Voltage sensors in domains III and IV, but not I and II, are immobilized by Na channel fast inactivation,” Neuron, vol. 22, pp. 73–87, 1999. [75] B. Chanda and F. Bezanilla, “Tracking voltage-dependent conformational changes in skeletal muscle sodium channel during activation,” J. Gen. Physiol., vol. 120, pp. 629–645, 2002. [76] C. R. Cantor and P. R. Schimmel, Biophysical Chemistry. Part II. Techniques for the Study of Biological Structure and Function. New York: Freeman, 1980. [77] P. R. Selvin, “Lanthanide-based resonance energy transfer,” IEEE J. Select. Topics Quantum Electron., vol. 2, no. 4, pp. 1077–1087, Dec. 1996. [78] C. Gonzalez, E. Rosenman, F. Bezanilla, O. Alvarez, and R. Latorre, “Periodic perturbations in Shaker K channel gating kinetics by deletions in the S3–S4 linker,” Proc. Nat. Acad. Sci., vol. 98, pp. 9617–9623, 2001. [79] D. M. Starace, P. R. Selvin, and F. Bezanilla, “Resonance energy transfer measurements on transmembrane motion of Shaker K channel voltage sensing region,” Biophys. J., vol. 82, p. 174a, 2002. [80] B. Chanda, O. K. Asamoah, B. Roux, and F. Bezanilla, “Measuring the transmembrane movement of the voltage sensor in the Shaker potassium channel,” Biophys. J. Abstracts, to be published. [81] D. J. Posson, C. Miller, F. Bezanilla, and P. R. Selvin, “Luminescence resonance energy transfer studies of the Shaker K voltage-sensor using fluorescent scorpion-toxin acceptor,” Biophys. J. Abstracts, 2005, to be published. [82] W. Treptow, B. Maigret, C. Chipot, and M. Tarek, “Coupled motions between the pore and voltage-sensor domains: A model for Shaker B, a voltage-gated potassium channel,” Biophys. J., vol. 87, pp. 2365–2379, 2004. [83] C. A. Ahern and R. Horn, “Stirring up controversy with a voltage sensor paddle,” Trends Neurosci., vol. 27, no. 6, pp. 303–307, 2004. [84] K. J. Swartz, “Towards a structural view of gating in potassium channels,” Nature Rev. Neurosci., vol. 5, pp. 905–916, 2004. [85] E. Perozo, M. Cortes, and L. G. Cuello, “Structural rearrangements underlying K -channel activation gating,” Science, vol. 285, pp. 73–78. [86] Y. Jiang, A. Lee, J. Chen, M. Cadene, B. T. Chait, and R. MacKinnon, “Crystal structure and mechanism of a calcium-gated potassium channel,” Nature, vol. 417, pp. 515–522. , “The open pore conformation of potassium channels,” Nature, vol. [87] 417, pp. 523–526, 2002. [88] S. M. Webster, D. Del Camino, J. P. Dekker, and G. Yellen, “Intracellular gate opening in Shaker K channels defined by high-affinity metal bridges,” Nature, vol. 428, pp. 864–868, 2004. [89] F. Bezanilla and E. Perozo, “The voltage sensor and the gate in ion channels,” in Advances in Protein Chemistry, D. Rees, Ed. New York: Elsevier, 2003, vol. 63. [90] A. Sonnleitner, L. M. Mannuzzu, S. Terakawa, and E. Y. Isacoff, “Structural rearrangements in single ion channels detected optically in living cells,” Proc. Nat. Acad. Sci. USA, vol. 99, no. 20, pp. 12 759–12 764, 2002. [91] R. Blunck and F. Bezanilla, “Fluorescence recordings of a low number of voltage gated K channels,” Biophys. J., vol. 82, p. 267a, 2002. [92] V. Borisenko, T. Lougheed, J. Hesse, E. Fureder-Kitzmuller, N. Fertig, J. C. Behrends, G. A. Woolley, and G. J. Schutz, “Simultaneous optical and electrical recording of single gramicidin channels,” Biophys J., vol. 84, no. 1, pp. 612–622, 2003. [93] R. Blunck, J. L. Vazquez-Ibar, Y. S. Liu, E. Perozo, and F. Bezanilla, “Fluorescence measurements of KcsA channels in artificial bilayers,” Biophys. J., pt. 2, vol. 84, no. 2, pp. 124a–125a, 2003.
Francisco Bezanilla received the Ph.D. degree from the Catholic University, Santiago, Chile, in 1968. He held postdoctoral positions at the National Institutes of Health, Bethesda, MD, and at the University of Rochester, Rochester, NY. He held a position as a professor in The University of Chile. He is currently the Hagiwara Professor of Neuroscience in the Departments of Physiology and Anesthesiology at the D. Geffen School of Medicine, University of California, Los Angeles. His primary research is aimed at the understanding of the structure–function relation of ion channels and voltage-dependent membrane processes.