Environmental Technology
ISSN: 0959-3330 (Print) 1479-487X (Online) Journal homepage: http://www.tandfonline.com/loi/tent20
Wastewater treatment for nutrient removal with Ecuadorian native microalgae María Belén Benítez, Pascale Champagne, Ana Ramos, Andres F. Torres & Valeria Ochoa-Herrera To cite this article: María Belén Benítez, Pascale Champagne, Ana Ramos, Andres F. Torres & Valeria Ochoa-Herrera (2018): Wastewater treatment for nutrient removal with Ecuadorian native microalgae, Environmental Technology, DOI: 10.1080/09593330.2018.1459874 To link to this article: https://doi.org/10.1080/09593330.2018.1459874
View supplementary material
Accepted author version posted online: 30 Mar 2018. Published online: 12 Apr 2018. Submit your article to this journal
Article views: 50
View Crossmark data
Full Terms & Conditions of access and use can be found at http://www.tandfonline.com/action/journalInformation?journalCode=tent20
ENVIRONMENTAL TECHNOLOGY, 2018 https://doi.org/10.1080/09593330.2018.1459874
Wastewater treatment for nutrient removal with Ecuadorian native microalgae María Belén Benítez
a
, Pascale Champagneb, Ana Ramosc, Andres F. Torresd and Valeria Ochoa-Herreraa,e*
a
Colegio de Ciencias e Ingenierías, Universidad San Francisco de Quito, Quito, Ecuador; bDepartment of Civil Engineering, Queen’s University, Kingston, Canada; cDepartment of Biology, Queen’s University, Kingston, Canada; dColegio de Ciencias Biológicas y Ambientales, Universidad San Francisco de Quito, Quito, Ecuador; eInstituto Biósfera, Universidad San Francisco de Quito, Quito, Ecuador ABSTRACT
The aim of this project was to study the feasibility of utilizing native microalgae for the removal of nitrogen and phosphorus, as a potential secondary wastewater treatment process in Ecuador. Agitation and aeration batch experiments were conducted using synthetic secondary wastewater effluent, to determine nitrogen and phosphorus removal efficiencies by a native Ecuadorian microalgal strain. Experimental results indicated that microalgal cultures could successfully 3− remove nitrogen and phosphorus. NH+ 4 − N and PO4 − P removal efficiencies of 52.6 and − N production efficiencies of 87.0 and 93.1% were 55.6%, and 67.0 and 20.4%, as well as NO− 3 reported in agitation and aeration photobioreactors, respectively. Aeration was not found to 3− increase the nutrient removal efficiency of NH+ 4 − N. Moreover, in the case of PO4 − P, a negative impact was observed, where removal efficiencies decreased by a factor of 3.3 at higher aeration rates. To the best of our knowledge, this is the first report of the removal of nutrients by native Ecuadorian Chlorella sp., hence the results of this study would indicate that this native microalgal strain could be successfully incorporated in a potential treatment process for nutrient removal in Ecuador.
1. Introduction In developing countries, 90% of domestic streams are discharged directly into rivers, lakes and coastal zones without any treatment; Ecuador is not an exception [1]. Quito is the capital city of Ecuador with a population of 2,239,191 inhabitants according to the last census conducted in 2010 [2]. Quito’s wastewater collection system consists of 2500 km of sewers that collect municipal wastewater and stormwater from 21 drainage basins. These domestic effluents are being discharged directly into Machángara River, Monjas River,
ARTICLE HISTORY
Received 1 November 2017 Accepted 26 March 2018 KEYWORDS
Microalgae; wastewater; removal; ammonium; phosphorus
San Pedro River and Guayllabamba River without prior treatment [3]. It is estimated that almost 75% of the Machángara river flows correspond to untreated wastewater, garbage and debris [4]. In fact, water quality data of these rivers have confirmed that they are not suitable for irrigation, water supply nor recreational use [3]. The discharge of untreated wastewater into surface water bodies has several detrimental effects on receiving ecosystems; it contains chemical and biological contaminants and pollutants that could pose a risk to public health [5].
CONTACT Valeria Ochoa-Herrera
[email protected] Colegio de Ciencias e Ingenierías, Universidad San Francisco de Quito, El Politécnico, Diego de Robles y Vía Interoceánica, 17-1200-841, Quito, Ecuador; Instituto Biósfera, Universidad San Francisco de Quito, Diego de Robles y Vía Interoceánica, 17-1200-841, Quito, Ecuador *Present address: Department of Environmental Sciences and Engineering, Gillings School of Global Public Health, University of North Carolina at Chapel Hill, NC, United States. Supplemental data for this article can be accessed at https://doi.org/10.1080/09593330.2018.1459874. © 2018 Informa UK Limited, trading as Taylor & Francis Group
2
M. B. BENÍTEZ ET AL.
According to the Public Metropolitan Drinking Water and Sanitation Company (Empresa Pública Metropolitana de Agua Potable y Saneamiento, or EPMAPS for its acronym in Spanish), Quito has potable water coverage of 99.8% for urban areas and 94.9% for rural areas, from which 96.6% of urban areas and 82.0% of rural areas have sewer services [6]. The amount of water that the city consumes each day is 639 million L on average, equivalent to a consumption of 7400 L s−1. In fact, 81% of the rivers’ contamination comes from domestic wastewater and the remaining 19% comes from industrial discharges [6]. To date, there are few studies presented in the literature regarding the quality of the rivers in Ecuador. Voloshenko-Rossin et al. [7] studied the water quality characteristics and emerging organic pollutants in the San Pedro–Guayllabamba–Esmeraldas River [7]. It was found that four wastewater streams from Quito pollute the San Pedro River. Also, the concentrations of most water quality parameters in the wastewater of the Quito District are within their range in raw wastewater in developed countries [7]. In Ecuador, only approximately 8% of sewage is treated to some extent [3]. This could be related to the 6,54,555 cases of water transmitted diseases in 2013 [8]. In wastewater treatment systems, the removal of nutrients, mainly dissolved nitrogen and phosphorus, is very important. Nutrient concentrations present in untreated wastewater can lead to eutrophication in receiving water bodies, which is generally caused by the excessive growth of unwanted vegetation such as algae and aquatic macrophytes [9], that can adversely and even irreversibly affect ecosystems. Other consequences are the toxicity to fish and other aquatic organisms associated with exposure to non-ionized ammonia, interference with the free chlorine residual required in disinfection, and methemoglobinemia (reduced ability of red blood cells to release oxygen to tissues) associated with excessive nitrate concentrations (>45 g m−3) in drinking water [9]. A number of studies have demonstrated that microalgal systems hold a great potential for the removal of nitrogen and phosphorous from wastewater [10–13] even under cold temperatures [14]. For example, various species of Chlorella and Scenedesmus have been shown to provide very high (>80%) removals of ammonia, nitrate and total phosphorus from secondary wastewaters [15]. Similarly, the nutrient removals as high as 90% of the total nutrients load can be achieved by the time the cultures reach the stationary phase [16]. The use of microalgae to remove nitrogen and phosphorus has a number of benefits, foremost, the potential for reducing eutrophication. Nitrogen and
phosphorus are in the form of biomass, which could subsequently be suitable for biofuel and fertilizer production [16]. Additionally, the quantity of freshwater and commercial fertilizers needed for microalgal cultivation can be significantly reduced with the use of wastewater [10]. Furthermore, the benefits of using microalgae includes lower operating costs; the discharge of oxygenated effluent into receiving water bodies [17]; and, with the incorporation of adequate harvesting strategies, generates a potential biofuel or bio-product feedstock rather than additional waste streams that require further treatment like sludge [15]. Growing algae in wastewater for simultaneous wastewater treatment and biomass production was first suggested in the 1960s and it continues to be investigated in order to find more sustainable approaches to use microalgae as an integrated system as it has been extensively reviewed by Neveux et al. [18], Ge et al. [19] and Gonçalves et al. [13]. The underlying assumption is that microalgae can transform certain compounds to less hazardous forms, which can allow for the safer reuse or discharge of the wastewater. Nevertheless, wastewater typically carries a broad microbial consortium, leading to synergistic, as well as competitive interactions between microalgae and heterotrophic microorganisms in this wastewater bioremediation strategy [20,21]. In fact, many improvements have led to the use of algal–bacterial consortium in facultative ponds and high rate algal ponds (HRAPs) [21–23]. The aim of this study was to evaluate the feasibility of utilizing native microalgae for nutrient removal and as a potential wastewater treatment alternative in Ecuador. Upon physical-chemical and microbiological characterization of the domestic wastewater generated in Quito, agitation and aeration batch photobioreactors experiments were conducted to evaluate native Ecuadorian microalgae for nutrient removal using synthetic wastewater with a similar nutrient load as secondary wastewater effluent.
2. Material and methods 2.1. Nutrient media and synthetic wastewater composition The composition of the nutrient medium (NM) for the autotrophic cultivation of algae was 250 mg L−1 NaNO3, 25 mg L−1 CaCl2.2H2O, 75 mg L−1 MgSO4.7H2O, 75 mg L−1 K2HPO4, 175 mg L−1 KH2PO4, 25 mg L−1 NaCl, 100 mg L−1 NaHCO3 and 1000 mg L−1 proteose peptone. The synthetic wastewater (WW) contained 37.4 mg L−1 CaCl2.2H2O, 56.7 mg L−1 MgSO4.7H2O,
ENVIRONMENTAL TECHNOLOGY
297.9 mg L−1 (NH4)2CO3, 6.8 mg L−1 NaNO3, 55.8 mg L−1 KH2PO4, 0.3 mg L−1 FeSO4.7H2O, 0.1 mg L−1 ZnCl2, 0.2 mg L−1 CuSO4.5H2O, 9.3 mg L−1 C6H12O6 and 0.001 mg L−1 H3BO3. The nutrient medium and synthetic wastewater were sterilized in the autoclave for 15 min at 121°C prior to use.
2.2. Wastewater collection and characterization 2.2.1. Wastewater sampling Domestic wastewater samples were collected from six different discharge points in the southern area of Quito (Ecuador) in October 2014. Individual samples were collected in 1 L amber bottles and stored in coolers for transportation to the Laboratory of Environmental Engineering at Universidad San Francisco de Quito, Ecuador. Collection sites were selected based on recommendations from the Quito municipal water company (EPMAPS). Dissolved oxygen (DO) and temperature (SM 4500-O A), pH (SM 4500 H+ B), conductivity (SM 2510) and oxidation-reduction potential (ORP) (SM 2580 A) were measured in situ according to the Standard Methods [24] with a Thermo Scientific Orion 5-Star portable multi-parameter metre and corresponding probes (Thermo Specific Electrode, Orion). 2.2.2. Analytical methods Turbidity (EPA 180.1 Rev 2.0) was tested using a turbidimeter (Thermo Scientific turbidimeter, Orion AQ4500). − Ammonium (NH+ 4 ) (SM 4500-NH3), nitrate (NO3 ) (SM − − − 4500-NO3 D), chlorides (Cl ) (SM 4500 Cl D) and fluorides (F−) (SM 4500F−C) were tested using a Thermo Scientific Orion 5-Star portable multi-parameter metre and corresponding probes (Thermo Specific Ion Selective Electrode, ISE Orion) as described in Standard Methods [24]. For every test, a calibration curve was constructed between potential (mV) and concentration (R 2 = 0.99). Sulphides (S2−) (SM 4500 S2− D), chemical oxygen demand (COD) (SM 5520 B) and phosphates (PO3− 4 ) (SM 4500-P B) were measured by colorimetric method using a Spectronic 20D+ spectrophotometer (Thermo Fisher Scientific Inc. Waltham, MA, USA). Sulphates (SO2− 4 ) (SM 426 C) and total solids (TS) (SM 2540 B) were determined following filtrations using Whatman glass microfiber filters (Grade 934-AH) and drying in a 40 GC Lab Oven. 2.3. Microalgae cultivation A native Chlorella sp. strain was kindly donated by Universidad de las Fuerzas Armadas ESPE, Ecuador. Native microalgae was collected in the Province of Orellana in the Northern Ecuadorian Amazon [25]. The native microalgae were propagated in Beijerinck medium and they were
3
morphologically characterized with a set of dichotomous key according to Whitford and Schumacher [26]. Microalgae were cultivated in the nutrient medium (NM) in a 10 L bench-scale tubular photobioreactor (TPBR) equipped with an inlet upward aerator operated using atmospheric air at airflow of 3 mL min−1. Artificial light was provided by 5 fluorescent 20W OSRAM (91.8 μmol m−2 s−1) for 12 h photoperiods at room temperature (23 ± 0.5°C). The cell density at steady state was 1.8 × 10⁶ cells mL−1. Microalgae cell density was measured with a haemacytometer (1/10 mm Boeco Neubauer counting chamber). A 40 μL sample was diluted in 160 μL of Lugol’s solution (solution of iodine and potassium iodine) to immobilize the cells. The counting chamber was loaded with 10 μL of the mixture. Microalgae cell counting was performed using a 400× lens of a Leica CME microscope.
2.4. Photobioreactors 2.4.1. Set up and operational conditions All bioassays were performed in duplicate in 1000 mL flasks (Photobioreactors, PBRs) with autoclaved synthetic wastewater and placed in an orbital shaker (MAX-Q 2508 Barnstead LabLine, USA) at 100 rpm and room temperature (23 ± 0.5°C) with an initial pH of 8.7 ± 0.24 (no pH control). The photobioreactors were illuminated by tubular fluorescent lamps (OSRAM, 20W) using 12-hour photoperiods (91.8 μmol m−2 s−1) for 17 days. Three batch photobioreactors were examined: (1) nutrient removal (NR), (2) abiotic control (AC), and (3) nonviable microalgal cell control (NVC). 500 mL from the tubular photobioreactor (TPBR) were centrifuged at 5000 rpm for 10 min to separate the microalgae from the nutrient medium. The resulting microalgae pellet was re-suspended in 1000 mL of autoclaved synthetic wastewater to inoculate the nutrient removal photobioreactors (NR PBRs). Abiotic control photobioreactors (AC PBRs) consisted of 1000 mL of autoclaved synthetic wastewater without microalgae to account for abiotic nutrient removal. Non-viable microalgal cell controls photobioreators (NVC PBRs) consisted of 1000 mL of synthetic wastewater with a pellet of re-suspended microalgal cells both autoclaved; these controls were used to quantify nutrient removal by sorption onto algal biomass. Two sets of experiments were conducted: (1) agitation using orbital shaker mixing, (2) aeration using an air pump that provided an atmospheric air flux of 1 L s−1 and mixing through a stone diffuser and orbital shaker. In the experiments with agitation the initial microalgal concentration in the nutrient removal photobioreactors (NR PBRs) was 3.5 × 10⁶ cells mL−1 (215.6 mg L−1, dry weight), while in aeration experiments
4
M. B. BENÍTEZ ET AL.
the initial cell density was 1.3 × 10⁶ cells mL−1 (105.9 mg L−1, dry weight). Every day, DO, temperature, pH and ORP were measured in each of the 3 photobioreactors, and 1 mL sample was collected to determine cell density. Four times per week, 90 mL samples withdrawn from flasks were centrifuged at 5000 rpm for 10 min to separate the microalgae from the synthetic wastewater in order to measure nutrients concentration in the supernatant.
2.4.2. Biomass and lipid content Microalgal biomass concentration and lipid content were determined at the beginning and end of the nutrient removal bioassays. For biomass determination, 45 mL samples were placed in pre-weighted tubes and centrifuged at 5000 rpm for 10 min. The supernatant was discarded and the tubes were dried at 105°C for 12 h. The tubes were weighted once again, and the dry biomass concentration was calculated gravimetrically by weight difference. A solvent method was used to extract the lipids from microalgae according to Ferraz et al. [27]. Briefly, dried biomass (100 mg L−1) was ground to powder using a mortar and pestle. The biomass was transferred to 15 mL conical tubes; 2 mL of chloroform and 1 mL of methanol were added and centrifuged at 5000 rpm for 10 min. The supernatant was transferred to another 15 mL conical tube, and 5 mL of distilled water was added to produce a biphasic layer. The sample was then centrifuged at 5000 rpm for 10 min, and the organic layer containing a mixture of chloroform and lipids was transferred to previously weighed 10 mL digestion tubes. This process was repeated three times until a clear supernatant was obtained. The tubes were left open for approximately 5 days, such that the lipids could be dried under ambient
environmental conditions. Finally, when the lipids were dried, the tubes were weighed and the lipid content was calculated.
2.5. Statistical analysis Results are presented in the form of mean values ± standard deviation from two independent experiments. The differences in wastewater samples were tested for significance using a one-way analysis of variance (ANOVA) at a significance level of 0.05.
3. Results and discussion 3.1. Domestic wastewater characterization Table 1 presents the characterization of the wastewater collected from different discharges locations in the southern part of Quito. Wastewater samples from the six collection sites were statistically significantly different, making it difficult to determine a representative domestic wastewater composition for the city. According to the EPMAPS, these variations in wastewater compositions are likely due to the infiltration of industrial wastewater effluents in the municipal sewer system in Quito [6]. However, for purpose of this study, wastewater characteristics from the ‘Calicanto’ discharge point were selected to prepare the synthetic wastewater; as Calicanto was believed to be most representative of medium to high strength domestic wastewater. For instance, the COD was 895.6 ± 36.4 mg L−1, while the typical high strength COD range is 500–800 mg L−1 [28]. In the case of the nutrients of interest, typical domestic wastewater −1 values in the range of 45–75 mg NH+ 4 L , 6–24 mg −1 3− −1 −1 PO4 L , 10–15 mg P L and less than 1 mg NO− 3 L
Table 1. Physico-chemical characterization of raw domestic wastewater samples from six discharge points in the southern area of Quito (Ecuador). The averages and standard deviations presented are for n = 2. Parameter Ammonium Chloride COD Conductivity DO Fluoride Nitrate pH Phosphate ORP Sulphates Sulphides Temperature TS Turbidity
Unit
Pasocucho Ravine
Ortega Collector
Calicanto Ravine
Capuli Ravine
Caupicho 2 Collector
Caupicho Collector
mg L−1 mg L−1 mg L−1 μScm−1 mg L−1 mg L−1 mg L−1 – mg L−1 mV mg L−1 mg L−1 °C mg L−1 NTU
14.5 ± 0.8 50.3 ± 0.8 178 ± 9.1 849.5 ± 4.9 1 ± 0.0 0.3 ± 0.01 3.7 ± 0.0 7.4 ± 0.0 3.8 ± 0.4 406.2 ± 1.4 85.6 ± 2.3 9.1 ± 1.4 16.3 ± 0.0 754 ± 42.4 38.1 ± 0.1
0.8 ± 0.01 7 ± 0.1 30.2 ± 12.1 233.9 ± 4.7 5.9 ± 0.2 0.1 ± 0.01 16.3 ± 0.8 7.1 ± 0.3 1.2 ± 0.5 403.4 ± 1.6 70 ± 3.5 11.7 ± 1.1 10.9 ± 0.4 260 ± 5.7 5.2 ± 0.7
36 ± 0.6 119.5 ± 10.1 895.6 ± 36.4 808.5 ± 72.8 3.6 ± 0.6 0.2 ± 0.01 3.6 ± 0.0 7.6 ± 0.0 28.4 ± 0.3 397.6 ± 5.9 98 ± 10.5 12.7 ± 0.3 17.3 ± 0.1 1066 ± 25.5 289.5 ± 6.4
14.7 ± 0.6 84.6 ± 0.3 435 ± 3 674 ± 15.6 3.5 ± 0.2 0.2 ± 0.01 3.2 ± 0.3 7.4 ± 0.0 6.3 ± 0.5 368.1 ± 5.7 91.4 ± 3.5 12.8 ± 1.4 17.3 ± 0.4 786 ± 127.3 72.3 ± 2.1
25.7 ± 0.2 119.5 ± 3.7 430.8 ± 21.2 833 ± 1.4 1.7 ± 0.5 0.2 ± 0.01 4.8 ± 0.02 7.4 ± 0.0 6.3 ± 0.5 359.7 ± 1.3 98.8 ± 18.6 12 ± 0.3 19.1 ± 0.1 722 ± 25.5 55.6 ± 3.7
13.1 ± 0.6 87.7 ± 1.4 225.1 ± 15.1 663 ± 11.3 3.4 ± 0.2 0.2 ± 0.01 9.8 ± 0.4 7.2 ± 0.0 3.5 ± 0.9 362.4 ± 0.2 76.6 ± 3.5 11.2 ± 0.8 18 ± 0.1 592 ± 33.9 34 ± 1.3
ENVIRONMENTAL TECHNOLOGY
5
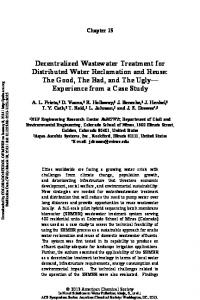
3.3. Nutrient removal The N/P ratio directly affects the growth of microalgae, as well as nitrogen and phosphorus removal efficiencies in wastewater treatment. Accroding to Kim et al. [31], an N/P ratio of 7–8:1 has been reported as adequate for microalgal growth [31]. Moreover, an optimal inorganic N/P ratio for freshwater microalgal growth in the range of 6.8–10 is generally suggested [32]. In this study, the N/P ratios at time 0 h were 6:1 and 7:1 in the agitation and aeration NR PBRs, respectively, suggesting that for both experiments the ratio is close to the optimal. Figure 1. Initial (□) and final (▪) lipid content and biomass concentration in nutrient removal photobioreactors (NR PBRs) under agitation and aeration conditions.
have been reported [29]. Concentrations of 36 ± 0.6 mg −1 3− −1 −1 NH+ 4 L , 28.4 ± 0.3 mg PO4 L , 9.3 ± 0.1 mg P L , − −1 and 3.6 ± 0.0 mg NO3 L were observed in the Calicanto wastewater.
3.2. Microalgae growth All nutrient removal bioassays were performed with identical light sources to ensure that the amount of light offered was similar for all conditions tested. Figure 1 shows an increase in lipid content and biomass concentration in the NR PBRs under both the agitation and aeration conditions during the 17 days of operation, with growth rates of 9.8 × 10³ and 4 × 10² cells mL−1 h−1 (Fig. S1) and corresponding biomass growth rate of 1.8 and 0.6 mg L−1 h−1 noted under the agitation and aeration conditions, respectively. The temperature in all PBRs varied between 21.5 and 25.3°C, while DO was found to vary between 4.3 and 5.5 mg L−1, which represents 48–60% of air saturation based on the maximum saturation DO concentration. A correlation of 0.56 was found between these two parameters in both the agitation and aeration PBRs. The initial pH of all PBRs was between 8.5–8.9. In the AC and NVC controls PBRs, the pH remained constant throughout the 17 days of operation. However, in the NR PBRs, pH declined to values between 6.1–6.2 after 48 and 96 h in the agitation aeration PBRs, respectively (Fig. S2). An important factor governing the productivity of photosynthetic microbial cultures is light availability; in fact, photosynthetic microorganisms can only make use of the 400– 700 nm range, the photosynthetically active radiation (PAR). Photoinhibition appears at irradiances over 1000 μE m−2 s−1 in most strains [30]; the irradiance for the present study was provided by the 5 OSRAM lamps, and was 100 W m−2 (421.50 μE m−2 s−1).
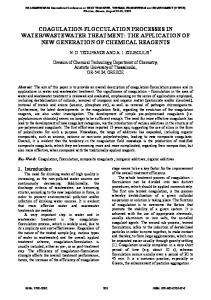
3.3.1. Nitrogen removal mechanisms The two main nitrogen sources for microalgal growth are ammonium and nitrate salts. When NH+ 4 is used as the nitrogen source, microalgae are able to absorb it directly into the cell and accumulate it in the form of amino acids. When nitrate is the nitrogen source, microalgae can absorb it directly into the cell and reduce it via nitrate reductase and nicotinamide adenine dinucleotide (NADH) to nitrite (NO− 2 ) transferring two electrons in the reaction. Subsequently, nitrite reduction to ammonium is facilitated by nitrite reductase and ferredoxin (Fd), transferring a total of six electrons in the reaction. Finally, ammonium is converted to amino acids [12,15–17,31]. Therefore, when both nitrogen sources are available, microalgae will preferentially assimilate ammonium and incorporate it into their organic compounds as it represents comparatively lower energy consumption because a redox reaction is not involved in its assimilation and transport through the cell membrane [33–35]. Figure 2(a and b) represent the changes in NH+ 4 −N concentration in the agitation and aeration PBRs, respectively. The removal rates were calculated from the slope of the concentration as a function of time during the first 96 h, and were computed to be 0.37 −1 −1 and 0.5 mg NH+ h for agitation and aeration 4 − NL nutrient removal photobioreactors (NR PBRs), respectively. However, the removal efficiencies were very similar, 52.6 ± 5.9 and 55.6 ± 7.4% in agitation and aeration NR PBRs (Table 2), respectively. The efficiencies achieved in this study were comparable to those obtained in other studies. For example, a 50% NH+ 4 −N removal was observed when the media concentration ranged from 41.8 to 92.8 mg L−1 in agitation batch photobioreactors [17]. Similarly, removal efficiencies for Chlorella sp. were 82.4% from a wastewater collected before primary settling and 74.7% from a wastewater collected after primary settling [32]. Aeration did not appear to influence overall NH+ 4 − N removal efficiency, but was noted to increase removal rates. The elimination of
6
M. B. BENÍTEZ ET AL.
Figure 2. NH+ 4 − N concentrations as a function of time in nutrient removal photobioreactos (NR PBRs) under (a) agitation (□) and (b) aeration conditions (▪). Abiotic controls (AC) (○) and (●), and non-viable microalgae cell controls (NVC) (Δ) and (▴), were individually run for comparison under (a) agitation and (b) aeration conditions, respectively.
ammonium was influenced by the pH of the culture medium, the NR PBRs exhibited ammonia (NH3) volatilization, since the initial pH was 8.45 ± 0.1 and 8.7 ± 0.2 in agitation and aeration essays, respectively. The acid/ base equilibrium of the ammonium/ammonia reaction involved in this system has a small Kb value of 1.8 × 10⁻⁵, meaning that NH3 is a weak base. Since the pH is >7 in the PBRs and the pKb of the reaction is 4.74, the reaction will shift to the production of the base, in this case NH3 [36]. In this study, some of the ammonium elimination occurred by desorption as ammonia, indeed after 72 h the pH of the NR aeration PBR decreased to 6.3 (Fig. S2); the decrease of the pH was caused by the
elimination of OH− [36,37]. The control PBRs (AC and NVC) (Figure 2(a and b)), show some variations in ammonium concentrations, which can likely be attributed to experimental error associated with the analytical methods. Thus, when comparing the NR PBRs with the controls, it was found that no appreciable ammonium removals could be noted in the controls, suggesting that biological assimilation was a likely nitrogen removal source during this study. Assimilation is the process by which microalgae converts inorganic nitrogen to its organic form; however, algae require inorganic nitrogen in the form of nitrate, nitrite and ammonium [35]. In this study, the decrease in NH+ 4 − N concentration could likely be attributed to the metabolic utilization of ammonium ion as a nitrogen source by microalgae. The primary product of ammonium assimilation is glutamine (Gln); which is important in all subsequent nitrogen metabolisms because it acts as an amine donor to organic acids. Ammonium assimilation by microalgae can be achieved via one of two glutamine sythetase/glutamine (GS) pathways: 2-oxoglutayate aminotransferase (GS-GOGAT) or by the action of GS and glutamate dehydrogenase [34]. The control PBRs under both the agitation and aeration conditions showed no appreciable ammonium removals during the 17 days of operation, thus it is likely that biological assimilation was the primary ammonium removal mechanism from the synthetic wastewater. However, the decrease in pH in both the agitation and aeration nutrient removal PBRs would support evidence of possible nitrification [38], since an increase in NO− 3 − N concentration was also observed (Figure 3). Shammas reported that optimum conditions for nitrification are generally at pH and temperatures ragnes between 8 and 9 and 15 and 35°C, respectively [39]. Hence, the conditions in this study were favourable for nitrification since the initial pH was 8.7 ± 0.2 and average temperature was 23.8 ± 1.3°C. Our results show indeed that the NO− 3 − N concentration raised from 3.9 ± 0.0 to 30.1 ± 0.6 mg L−1 and 1.4 ± 0.0 to 19.6 ± 0.2 mg L−1 at a rate of 0.08 and −1 −1 0.04 mg NO− h under agitation and aeration 3 − NL
3− Table 2. Initial and final NH+ 4 − N, NO3–N, PO4 − P, biomass concentration and lipid content in nutrient removal photobioreactors (NR PBRs).
Initial conditions Parameter NH+ 4 NO− 3
−N −N
N PO3− 4 −P Biomass Lipid content
Unit −1
mg L mg L−1 mg L−1 mg L−1 mg L−1 %
Final conditions
Agitation
Aeration
Agitation
Aeration
79.9 ± 3.0 3.9 ± 0.03 83.8 ± 3.0 13.3 ± 0.1 215.6 ± 2.3 11.8 ± 0.6
83.7 ± 0.7 1.4 ± 0.2 85.9.8 ± 0.8 11.7 ± 0.6 105.9 ± 1.4 8.6 ± 1.5
37.9 ± 6.2 30.1 ± 0.6 68.1 ± 6.7 4.4 ± 0.2 933.7 ± 1.8 16.7 ± 0.8
37.2.6 ± 5.8 19.6 ± 0.2 56.8 ± 0.3 9.3 ± 0.3 370.4 ± 2.4 10.8 ± 1.5
The averages and standard deviations presented are for two replicated reactors under agitation and aeration conditions.
ENVIRONMENTAL TECHNOLOGY
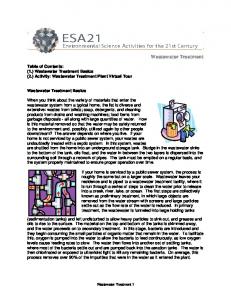
Figure 3. NO− 3 − N concentrations as a function of time in nutrient removal photobioreactors (NR PBRs) under agitation (□) and aeration conditions (▪). Abiotic controls (AC) (○) and (●), and non-viable microalgae cell controls (NVC) (not shown) were individually run for comparison under agitation and aeration conditions, respectively.
NR PBRs, respectively (Table 2). Studies with C. vulgaris cultures also showed increases in nitrate levels from 5 to 45 mg L−1 after 144 h of operation [40]. The formation of nitrate (NO− 3 − N) was observed in both essays suggesting the presence of nitrifying microorganisms [9]. The conditions on the NR PBRs were optimal for nitrification, the pH was between 6.5 and 7 and the temperature was in a range of 20–30°C. In the aeration PBR, NO− 3 − N concentrations (Figure 3) were noted to increase as soon as NH+ 4 − N reductions were observed (48 h). On the other hand, for the agitation conditions, the increase in nitrate was found to occur after 96 h, even though the removal of ammonium was found to occur in the first 48 h. During the 48 h gap, the increase in cell density was negligible, suggesting that algae could be uptaking nitrogen and nitrifying bacteria could be in a lag phase. Literature studies have shown that the presence of nitrifying bacteria does not caused a negative impact in the uptake of nitrogen by algae; however, their presence does correlate with a higher rate of ammonium removal [41]. A nitrogen balance was performed for the first 96 h of the experimental period. According to Lee and Lee, the nitrogen content of algal biomass should be approximately 5–10% of dry cell weight [39]. Therefore, taking into consideration the minimum percentage suggested by Lee and Lee (5%), the nitrogen weight content at 0 h was estimated to be 10.75 and 5.25 mg N L−1, 46.7 and 18.5 mg N L−1 at 96 h, for the agitation and aeration PBRs, respectively. The concentration of ammonia volatilization was estimated to be 3.11 and 25.99 mg N L−1 in agitation and aeration PBRs.
7
Figure 4. PO3− 4 − P concentrations as a function of time in nutrient removal photobioreactors (NR PBRs) under agitation (□) and aeration conditions (▪). Abiotic controls (AC) (not shown) and non-viable microalgae cell controls (NVC)) were individually run for comparison (not shown).
3.3.2. Phosphorus removal mechanism Figure 4 illustrates changes in PO3− 4 − P concentrations in the NR PBRs. The removal rates were calculated for the first 240 h since a decrease in concentration was observed throughout this period. They were calculated from the slope of the concentration as a function of −1 −1 time, and were 0.03 and 0.02 mg PO3− h for 4 − PL the agitation and aeration NR PBRs, respectively. The PO3− 4 − P removal efficiency was 3.3 times higher in the agitation PBR compared to the aeration PBR (Table 2). The removal efficiencies were 67.0 ± 1.5 and 20.4 ± 6.9% for the agitation and aeration PBRs, respectively. In the agitation PBR, the PO3− 4 − P removal efficiency was similar to those reported in a study with C. vulgaris, in which initial concentration of 7.7 mg −1 PO3− and a removal efficiency of 78% were 4 − PL noted [17]. On the other hand, the phosphate removal efficiency observed in the aeration PBRs was similar to those presented in a study with C. kessleri, which was able to uptake between 8 and 20% PO3− 4 − P under light/dark cycles when the initial medium concentration −1 was 12 mg PO3− [42]. 4 − PL In algal systems, biomass uptake and phosphate precipitation can account for the removal of phosphorus [43]. Photosynthetic carbon assimilation by microalgae leads to an increase in pH that can subsequently induce the chemical precipitation of phosphate [44]. It has been reported that when the pH increases above 8, algal systems may cause the coagulation and adsorption of inorganic phosphates [45], specifically abiotic phosphorus removal occurs at pH 9–11 [43]. The pH reported in this study oscillated between 6.3 and 5.4 for both agitation and aeration PBRs during the
8
M. B. BENÍTEZ ET AL.
microalgae growth phase. pH is a key parameter in the chemical phosphorus precipitation, uptake rates decrease under acidic [9] environments [46,47]. PO3− 4 − P removal was noted in the agitation NR PBR after 180 h of operation at a pH of 6.25, whereas in the aeration NR PBR, removal was observed after 150 h at a pH of 6.3 (Figure 4 and Fig. S2). Based on the pH of these NR PBRs, it could be concluded that the phosphate precipitation was not a likely process in this study. Furthermore, phosphorus in wastewaters could also be removed by struvite precipitation with other ions such as ammonium, calcium and magnesium [48]. Different calcium phosphates could be formed; which have Ca/P molar ratios between 1 and 1.67 [44]. The Ca/P molar ratio of the synthetic wastewater used in this study was 0.62.
4. Conclusions This study investigated nutrient removal from a synthetic secondary wastewater effluent with native Ecuadorian microalgae [Chlorella sp] at laboratory scale under agitation and aeration batch conditions. NH+ 4 − N removal efficiencies were 52.6 and 55.6%, while PO3− 4 −P removal efficiencies were 67 and 20.4%, in the agitation and aeration PBRs, respectively. Given the pH conditions during the time of operation, it is expected that some ammonia volatilization occurred. In addition, NO− 3 −N production was observed, 87 and 93.1% in the agitation and aeration PBRs, which suggested nitrification. Nutrient removal with microalgae was shown to be an alternative for the treatment of domestic wastewater. This study was conducted at laboratory scale to determine the feasibility of using microalgae as a wastewater treatment technology. However, in the future, it would be important to perform an economic assessment addressing scale-up of this eco-engineered approach to determine the cost and energy implications of implementing this wastewater treatment approach.
Acknowledgments We are very thankful to Rodny Peñafiel for his helpful comments.
Disclosure statement No potential conflict of interest was reported by the authors.
Funding This research was funded by Universidad San Francisco de Quito’s Collaboration Grant 2015 and POLI Grant 2016
programs; as well as the Queen’s Vice-President Research Opportunity Fund (International Fund), Natural Sciences and Engineering Research Council of Canada and the Canada Research Chair program .
ORCID María Belén Benítez
http://orcid.org/0000-0001-9750-0914
References [1] UN. Environmental Indicators, U.N.S. Division, Editor; 2011. [2] INEC. Ecuador en cifras; 2013. [3] Armijos E, Carranza F, Chiriboga F, et al. Improving quality of life for the residents of Quito through an integrated sustainable water recovery project. 2015: 1–10. Available from: http://aidisnet.org/PDF/cwwa2015/CWWA%202015% 20Paper_Quito%20Project_EfrainArmijos.pdf [4] UNEP and FLACSO. Quito Environmental climate change outlook; 2011. [5] Christou A, Grivas M, Michael E, et al. Effects of wastewater applied with discrete irrigation techniques on strawberry plants’ productivity and the safety, quality characteristics and antioxidant capacities of fruits. Agric Water Manag. 2016;173:48–54. [6] EPMAPS, Informe Gestión. 2011, Empresa Pública Metropolitana de Agua Potable y Saneamiento. [7] Voloshenko-Rossin A, Gasser G, Cohen K, et al. Emerging pollutants in the Esmeraldas watershed in Ecuador: discharge and attenuation of emerging organic pollutants along the San Pedro-Guayllabamba-Esmeraldas rivers. Environ Sci Process Impact. 2015;17:41–53. [8] DNVE. Anuario epidemiológico de enfermedades transmitidas por agua y alimentos. Quito: Dirección Nacional de Vigilancia Epidemiológica; 2013. [9] Abdel-Raouf N, Al-Homaidan AA, Ibraheem IBM. Microalgae and wastewater treatment. Saudi J Biol Sci. 2012;19:257– 275. [10] Abdelaziz AEM, Leite GB, Belhaj MA, et al. Screening microalgae native to Quebec for wastewater treatment and biodiesel production. Bioresour Technol. 2014;157:140–148. [11] Dickinson KE, Whitmey CG, McGinn PJ. Nutrient remediation rates in municipal wastewater and their effect on biochemical composition of the microalga Scenedesmus sp. AMDD. Algal Res. 2013;2:127–134. [12] Ge S, Champagne P. Nutrient removal, microalgal biomass growth, harvesting and lipid yield in response to centrate wastewater loadings. Water Res. 2016;88:604–612. [13] Gonçalves AL, Pieres JCM, Simões M. A review on the use of microalgal consortia for wastewater treatment. Algal Res. 2017;24:403–415. [14] Jämsä M, Lynch F, Santana-Sánchez A, et al. Nutrient removal and biodiesel feedstock potential of green alga UHCC00027 grown in municipal wastewater under Nordic conditions. Algal Res. 2017;26:65–73. [15] Pittman JK, Dean AP, Osundeko O. The potential of sustainable algal biofuel production using wastewater resources. Bioresour Technol. 2011;102:17–25. [16] McGinn PJ, Dickinson KE, Park KC, et al. Assesment of the bionergy and biorremediation potentials of the microalga Scenedesmus sp. AMDD cultivated in municipal
ENVIRONMENTAL TECHNOLOGY
[17]
[18]
[19]
[20]
[21]
[22]
[23]
[24]
[25]
[26] [27]
[28]
[29]
[30]
[31]
[32]
wastewater effluent in batch and continuous mode. Algal Res. 2012;1:155–165. Aslan S, Kapdan IK. Batch kinetics of nitrogen and phosphorus removal from synthetic wastewater by algae. Ecol Eng. 2006;28:64–70. Neveux N, Magnusson M, Mata L, et al. The treatment of municipal wastewater by the macroalga Oedogonium sp. and its potential for the production of biocrude. Algal Res. 2016;13:284–292. Ge S, Champagne P, Plaxton WC, et al. Microalgal cultivation with waste streams and metabolic constraints to triacylglycerides accumulation for biofuel production. Biofuels Bioprod Biorefin. 2017;11(2):325–343. Gonzalez-Bashan LE, Lebsky VK, Hernandez JP, et al. Changes in the metabolism of the microalga Chlorella vulgaris when coimmobilized in alginate with the nitrogenfixing Phyllobacterium myrsinacearum. Can J Microbiol. 2000;46:653–659. Subashchandrabose SR, Ramakrishnan B, Megharaj M, et al. Consortia of cyanobacteria/microalgae and bacteria: biotechnological potential. Biotechnol Adv. 2011;29:896– 907. Craggs RJ, Davies-Colley RJ, Tanner CC, et al. Advanced pond system: performance with high rate ponds of different depths and areas. Water Sci Technol. 2003;48 (2):259–267. Craggs RJ, Heubeck S, Lundquist TJ, et al. Algal biofuels from wastewater treatment high rate algal ponds. Water Sci Technol. 2011;63(4):660–665. APHA. Standard methods for the examination of water and wastewater. 22nd ed. Washington, DC: American Public Health Association, American Water Works Association, Water Environment Federation; 2012. Portilla A. Evaluación del rendimiento de producción de aciete en cuatro microalgas nativas de las Provincias ecuatorianas de Orellana, Esmeraldas, Imbabura y Pichincha en diferentes condiciones de iluminancia y de medio de cultivo a nivel de laboratorio. Ecuador: Universidad de las Fuerzas Armadas ESPE; 2010. Whitford LA, Schumacher GJ. A manual of fresh-water algae. Raleigh (NC): Sparks Press; 1973. Ferraz TPL, Fiúza MC, dos Santos MLA, et al. Comparison of six methods for the extraction of lipids from serum in terms of effectiveness and protein preservation. J Biochem Biophys Method. 2004;58(3):187–193. Metacalf&Eddy. Wastewater engineering. treatment and reuse recovery. 5th ed. Eddy M, editor. New York: McGraw-Hill Education; 2014. Henze M, van Loosdrecht MCM, Ekama GA, et al. Biological wastewater treatment: principles, modelling and design. London: IWA Publishing; 2008. Acién-Fernández FG, Fernández-Sevilla JM, Molina-Grima E. Photobioreactors for the production of microalgae. Rev Environ Sci Bio/Technol. 2013;12:131–151. Kim S, Lee Y, Hwang SJ. Removal of nitrogen and phosphorus by Chlorella sorokiniana cultured heterotrophycally in ammonia and nitrate. Int Biodeter Biodegr. 2013;85:511–516. Wang L, Min M, Li Y, et al. Cultivation of green algae Chlorella sp in different wastewaters from municipal wastewater treatment plant. Appl Biochem Biotechnol. 2010;162:1174–1186.
9
[33] De-Bashan LE, Antoun H, Bashan Y. Cultivation factors and population size control the uptake of nitrogen by the microalgae Chlorella vulgaris when interacting with the microalgae growth-promoting bacterium Azospirillum brasilense. FEMS Microbiol Ecol. 2005;54(2):197–203. [34] Liu N, Li F, Ge F, et al. Mechanisms of ammonium assimilation by Chlorella vulgaris F1068: isotope fractionation and proteomic approaches. Bioresour Technol. 2015;190:307–314. [35] Cai T, Park SY, Li Y. Nutrient recovery from wastewater streams by microalgae: status and prospects. Renew Sust Energy Rev. 2013;19:360–369. [36] Martínez ME, Sánchez S, Jiménez JM, et al. Nitrogen and phoshorus removal from urban wastewater by the microalga Scenedesmus obliquus. Bioresour Technol. 2000;73 (3):263–272. [37] Ruiz-Marin A, Mendoza-Espinosa LG, Stephenson T. Growth and nutrient removal in free and immobilized green algae in batch and semi-continuous cultures treating real wastewater. Bioresour Technol. 2010;101:58–64. [38] Mezzari MP, Da Silva MLB, Viancelli A, et al. Bacteria-microalgae interactions during nitrification/denitrification processes in a photobioreactor treating swine wastewater. III SIGER - III Simpósio Internacional sobre Gerenciamiento de Residuos Agropecuários e Agroindustriais. Brazil; 2013. [39] Shammas NK. Interactions of temperature, pH, and biomass on the nitrification. J Water Pollut Control Fed. 1986;58(1):52–59. [40] González LE, Cañizares RO, Baena S. Efficiency of ammonia and phosphorus removal from a colombian agroindustrial wastewater by the microalgae Chlorella vulgaris and Scenedesmus Dimorphus. Bioresour Technol. 1997;60:259–262. [41] Rada-Ariza AM, Lopez-Vazquez CM, van der Steen NP, et al. Nitrification by microalgal-bacterial consortia for ammonium removal in flat panel sequencing batch photo-bioreactors. Bioresour Technol. 2017;245:81–89. [42] Lee K, Lee CG. Effect of light/dark cycles on wastewater treatments by microalgae. Biotechnol Bioprocess Eng. 2001;6(3):194–199. [43] Ma X, Zhou W, Fu Z, et al. Effect of wastewater-borne bacteria on algal growth and nutrients removal in wastewater-based algae cultivation system. Bioresour Technol. 2014;167:8–13. [44] Larsdotter K, La Cour Jansen J, Dalhammar G. Biologically mediated phosphorus precipitation in wastewater treatment with microalgae. Environ Technol. 2007;28:953–960. [45] Li Y, Chen Y-F, Chen P, et al. Characterization of a microalga chlorella sp. well adapted to highly concentrated municipal wastewater for nutrient removal and biodiesel production. Bioresour Technol. 2011;102:5138–5144. [46] Markou G, Georgakakis D. Cultivation of filamentous cyanobacteria (blue-green algae) in agro-industrial wastes and wastewaters: a review. Appl Energy. 2011;88:3389–3401. [47] Juneja A, Ceballos RM, Murthy GS. Effects of environmental factors and nutrient availability on the biochemical composition of algae for biofuels production: a review. Energies. 2013;6:4607–4638. [48] Huang H, Huang L, Zhang Q, et al. Chlorination decomposition of struvite and recycling of its product for the removal of ammonium-nitrogen from landfill leachate. Chemosphere. 2015;136:289–296.