Table â 2. Physico â Chemical Parameters of Water Samples Collected on 11-01-2010. Parameter. S1. S2. S3. S4. S5. S6. S7. S8. Temperature 0C 27.32 27.52 ...
CHAPTER – IV
WATER QUALITY INDEX
66
Materials and methods: Water samples collected from eight sampling stations selected for the analysis were given bellow: S1–-Durgi (Bore Well), S2 –Rayavaram
(Bore Well),
S3 -Adigoppula(Bore Well),
Terla(Bore Well),
S5 - Karempudi(Bore
S4 –
well & open well ), S6 –
Macherla(Bore Well& open well ) S7 –Ganapavaram (Bore well) and S8-Chirumamilla(Bore Well). Samples for analysis were collected in sterilized bottles using the standard procedure for
grab (or) catch
samples in accordance with standard methods of APHA (1995). The analysis of temperature,
various physico – chemical parameters namely pH, total
hardness,
alkalinity,
calcium
hardness,
magnesium hardness, chloride, sulphate, nitrate, DO, BOD, COD, TDS etc., were carried out – as per the methods described in APHA (1992).
All the chemicals and reagents used were of analytical
grade. D.D water was used for the preparation of solutions.
Water Quality Index (WQI): WQI indicates the quality of water in terms of index number which represents overall quality of water for any intended use. It is defined as a rating reflecting the composite influence of different water quality parameters were taken into consideration for the calculation of water Quality index (WQI) .The indices are among 67
the most effective ways to communicate the information on water quality trends to the general public or to the policy makers and in water quality management. In formulation of water quality index the relative importance of various parameters depends on intended use of water. Mostly it is done from the point of view of its suitability for human consumption. The calculation of WQI was made using weighed Arithmetic index method (Brown et al,1972) in the following steps: Let there be n water quality parameters and quality rating (qn) corresponding to nth parameter is a number reflecting relative value of this parameter in
the polluted water with respect to its
standard permissible value. qn values are given by the relationship. qn=100 (vn-vi) / (vs-vi) vs = Standard value, vn = observed value
vi = ideal value
In most cases vi=0 except in certain parameters like pH, dissolved oxygen etc., Calculation of quality rating for pH & DO (vi 0) q
pH
= 100 (v
pH
– 7.0) / (8.5 – 1.0) and
q DO = 100 (VDO – 14.6) / (15.0-14.6). Calculation of unit weight :
The Unit weight (Wn) to
various water Quality parameters are inversely proportional to the recommended standards for the corresponding parameters.
68
Wn = k/sn.
Where wn = unit weight for nth parameter sn = standard permissible value for nth parameter k = proportionality constant. The unit weight (wn) values in the present study are taken
from
Krishnan et al., 1995 WQI is calculated by the following equation.
WQI = n
n 1
n
qn wn / wn n 1
.
The suitability of WQI values for human consumption according to Mishra & Patel, 2001 are rated as follows. 0-25 ………. .Excellent 26-50 ……… Good 51-75 …………Bad 76-100 ……… Very Bad 100 & above ….Unfit.
Assessment of water quality based on WQI : Application of WQI
is a useful method in assessing
the
suitability of water for various beneficial uses.
69
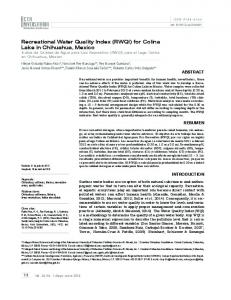
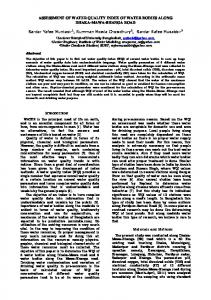
Results and discussion: The physico – chemical parameters of the water samples are presented in Table – 1 Temperature : Temperature of water is basically important because it effects bio-chemical reactions in aquatic organisms.
A rise in
temperature of water leads to the speeding up of chemical reactions in water, reduces the solubility of gases and amplifies the tastes and odours. The average temperature of the present study ranged from 26.93…..28.210 c.
The pH value of natural water changes due to
the biological activity and industrial contamination.
Higher pH
includes the formation of trihalomethanes which are toxic (Trivedi 1986). The pH values of the present investigation were within the ICMR standards (7.0 – 8.5) . Electrical conductivity Conductivity is a measure of current carrying capacity. Thus, as concentration of dissolved salts increases conductivity also increases.
Many dissolved substances may produce aesthetically
displeasing colour, taste and odour. The values obtained are in the range
0.9 to 1.8 mmhos.
70
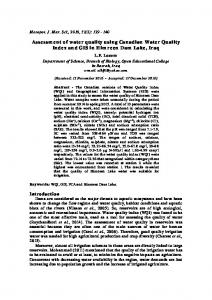
Total Dissolve Solids: TDS values ranged within 420 to 709mg/lt. The TDS values for ground water range from 19 to 1280mg/lt
as per standards and in
this respect this water is suitable for drinking purposes. Dissolved Oxygen(DO): It is an important
parameter which is essential to the
metabolism of all aquatic organisms that posses aerobic respiration (Wetzel, 1975 )
presence of DO
in water may be due to direct
diffusion from air and photosynthetic activity of autotrophs (Shanti etal., 2002). Oxygen can be rapidly removed from the waters by discharge of oxygen demanding wastes. The DO values obtained in the present study are within ICMR standards. Alkalinity : Alkalinity value with less than 100mg/lt
is desirable for
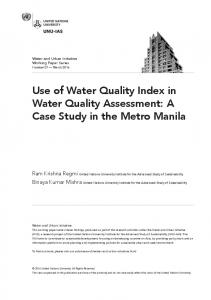
domestic use. However, in large quantities imparts bitter taste to water. In the present investigation the total alkalinity of the water samples is found in the Range 106.4 to 162.2 mg/lt. Hardness : Hardness
is a measure of the ability of water to cause
precipitation of insoluble calcium and magnesium salts of higher fatty acids from soap solutions.
The principal hardness causing
cations are calcium, magnesium bicarbonate, carbonate, chloride 71
and sulphates. The hardness values of the present study were found to range between 220.4 to 532 mg/lit. The quantities of calcium in natural water depend up on the type of rocks. Small concentration of calcium is beneficial in reducing the corrosion in water pipes.
Magnesium hardness
particularly associated with sulphate ion has laxative effect an persons un accustomed to it (Khursid,1998). In the present study calcium and magnesium contents are found in the range of 85.4 – 169.5 and 26.8- 78.2 mg/lt respectively. Chloride: Chloride occurs in all types of natural waters.
The high
concentration of chloride is considered to be an indication of pollution due to high organic waste of animal origin (Singh, 1995). Chloride values obtained in the study are found in the range between 74.2-134.0 mg / lt. Bio-Chemical Oxygen Demand (BOD) & Chemical Oxygen Demand (COD) BOD & COD are the parameters used to assess the pollution of surface water and ground waters. Both of the parameters (BOD & COD) values obtained in the present study are within permissible levels. Sulphate: Sulphate ion does not affect the taste of water, if present in low concentrations. The sulphate ion concentration in the present investigation varied from 87.5-185.0 mg/lt. 72
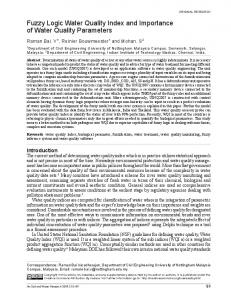
Nitrate: Nitrate is the most important nutrients in an ecosystem. Generally water bodies polluted by organic matter exhibit higher values of nitrate.
In the present study water samples from the
stations (s1 to s8) showed low concentrations of nitrate (1.34 to 2.15 mg/lt) well below permissible levels as per the standards. The WQI values of the present investigation (Table - 3) from different sampling stations are calculated as per the procedure described earlier. The water quality index values are given in Table – 7.
Basing on the results obtained, it can be said that, some of the
samples have total dissolved solids, hardness and calcium values exceeding the permissible limits as prescribed by Indian standards. However the WQI values (38.3 – 42.6) calculated for the different samples indicate that the water is safe for human consumption. It can safely be considered that the values of WQI in the present investigation were reported to be less than 50, indicating that the water is suitable for human consumption.
73
Table – 1 Physico – Chemical Parameters of Water Samples Collected on 12-12-2009
Parameter
S1
S2
S3
S4
S5
S6
S7
S8
Temperature 0C
27.12 28.0
28.17 27.65 27.18 28.02 27.56 27.03
pH
7.30
7.65
7.24
7.38
7.09
7.81
7.35
7.76
Electrical Conductivity TDS
1.4
1.8
0.9
1.6
1.2
1.0
1.3
1.7
469
710
432
502
633
415
528
571
TSS
42.3
58.3
61.2
48.9
62.1
33.2
53.8
42.5
Hardness
528
292
254
305
210.5 376
415
368
Calcium
109
99.2
82.3
172.5 90.8
122.3 170.6 113.5
Magnesium
63.8
52.4
29.8
73.9
54.9
Chloride
54.9
80.2
109.8 114.8 97.2
125.8 122.3 152.9
DO
4.6
4.3
5.2
4.2
4.3
4.0
4.3
4.6
BOD
1.2
0.8
1.0
0.8
0.9
0.8
1.2
1.2
Sulphate
128.9 92.5
99.5
164.8 162.8
Alkalinity
112.8 148.3 103.8 128.3 148.9 103.8 140.3 110.8
Nitrate
1.30
1.93
2.01
1.62
1.31
1.52
1.63
2.11
COD
5.0
4.2
5.0
5.3
5.9
4.3
6.0
5.3
Iron
0.002 0.002 0.004 0.002 0.003 0.003 0.003 0.002
29.9
115.9 170.2 82.5
60.8
74.8
All the parameters expressed in mg/lit. except pH and EC (mmhos) * All the values are the average of 3 determinations.
74
Table – 2 Physico – Chemical Parameters of Water Samples Collected on 11-01-2010
Parameter
S1
S2
S3
S4
S5
Temperature 0C
27.32
27.52 28.0
27.52 27.78 28.02 27.91 27.53
pH
7.50
7.3
7.62
7.75
7.82
7.8
7.45
7.78
Electrical Conductivity TDS
1.3.
1.7
1.0
1.8
1.3
1.0
1.5
1.5
541
606
420
552
608.2 468
493
552
TSS
79.2
78.5
57.9
66.6
68.0
82.3
62.8
Hardness
423
308.5 215.0 305.5 252.4 382.6 428.2 322.0
Calcium
107.8
86.0
94.3
109.0 115.3 139.2 155.5 122.6
Magnesium
58.6
46.6
44.2
72.5
Chloride
79.2
77.5
112.6 86.3
124.0 115.7 144.0 160.5
DO
4.0
4.0
5.0
4.0
4.5
4.2
4.4
4.3
BOD
1.2
0.5
1.2
0.8
0.7
0.8
1.4
1.2
Sulphate
112.0
115.2 84.2
162.5 92.5
Alkalinity
164.0
134.5 96.3
152.0 172.0 122.4 140.8 95.6
Nitrate
1.22
1.18
1.2
1.80
1.34
1.65
1.98
2.05
COD
5.2
4.8
5.0
5.0
5.0
4.9
6.2
5.5
Iron
0.0023 0.002 0.003 0.003 0.004 0.002 0.004 nd
56.7
S6
33.9
58.5
S7
S8
72.9
64.2
108.5 165.8 150.5
All the parameters expressed in mg/lit. Except pH and EC (mmhos) * All the values are the average of 3 determinations.
75
Table – 3 Physico – Chemical Parameters of Water Samples Collected on 11-02-2010
Parameter
S1
S2
S3
S4
S5
Temperature 0C
27.08 28.10 28.21 27.82 27.08 28.11 27.49
26.93
pH
7.30
7.60
7.42
7.42
7.79
7.8
7.55
7.72
Electrical Conductivity TDS
1.5.
1.9
0.9
1.8
1.2
1.0
1.5
1.3
562
709
420
532
628.
468
525
576
TSS
49.7
58.5
63.9
46.1
58.0
33.9
52.3
42.8
Hardness
532
314.5 220.4 345.1 232.4 382.6 420.2
Calcium
127.0 106.2 85.4
169.5 91.3
139.2 175.2
112.6
Magnesium
78.2
56.0
27.2
72.5
58.5
74.8
Chloride
74.2
87.5
123.2 116.3 94.0
115.7 134.0
163.5
DO
4.8
4.5
5.0
4.0
4.7
4.2
4.6
4.3
BOD
1.3
0.5
1.2
0.8
0.7
0.8
1.4
1.2
Sulphate
132.0 96.5
Alkalinity
128.5 156.0 106.4 132.0 162.2 122.4 150..6 115.1
Nitrate
1.38
1.92
2.13
1.80
1.34
1.65
1.85
2.15
COD
5.2
4.8
5.2
5.3
6.0
4.9
6.2
5.8
Iron
0.002 0.003 0.004 0.002 0.003 0.003 0.004
26.8
125.2 185.0 87.5
S6
S7
62.4
108.5 175.2
All the parameters expressed in mg/lit. except
S8
352.6
162.0
nd
pH and EC
(mmhos) * All the values are the average of 3 determinations. 76
Table – 4 Physico – Chemical Parameters of Water Samples Collected on 11-03-2010
Parameter
S1
S2
S3
S4
S5
Temperature 0C
27.08 28.10 28.21 27.82 27.08 28.11 27.49 26.93
pH
7.30
7.60
7.42
7.42
7.79
7.8
7.55
7.72
Electrical Conductivity TDS
1.3
1.2
1.0
1.9
1.1
1.2
1.6
1.4
480
662
408
464
609
412
503
570
TSS
42.3
67.3
60.2
48.4
54.2
30.6
52.0
41.6
Hardness
508
286
205
316.3 212
360.3 403.8 330.3
Calcium
103.8 95.3
81.8
143.2 86.5
117.5 153.8 98.4
Magnesium
72.8
52.3
21.8
70.3
54.3
Chloride
78.4
80.3
104.8 105.8 89.3
108.3 124.5 148.3
DO
4.6
4.8
4.9
4.30
4.6
4.2
4.6
4.3
BOD
1.2
0.8
1.3
0.5
0.7
0.9
1.3
1.1
Sulphate
128.3 87.5
Alkalinity
118.5 126.2 98.5
114.5 145.8 102.5 132.8 95.3
Nitrate
1.24
1.68
2.08
1.81
1.34
1.53
1.78
2.06
COD
5.0
4.8
5.0
5.1
5.0
4.9
6.0
5.6
Iron
0.003 0.004 0.003 0.003 0.002 0.003 nd
nd
26.8
103.8 162.3 80.3
S6
S7
59.8
S8
70.6
104.9 157.8 160.3
All the parameters expressed in mg/lit. except pH and EC (mmhos) * All the values are the average of 3 determinations. 77
Table – 5 Physico – Chemical Parameters of Water Samples Collected on 11-04-2010
Parameter
S1
S2
S3
S4
S5
Temperature 0C
27.10 28.23 27.90 27.12 28.15 27.39 26.99 27.28
pH
7.26
7.54
7.45
7.70
7.59
7.80
7.52
7.69
Electrical Conductivity TDS
1.4
1.8
1.0
1.2
1.8
1.2
1.5
1.4
548
710
418
508
621
456
508
548
TSS
42.8
53.2
60.8
42.3
50.8
33.8
50.3
42.9
Hardness
512
308.3 211.5 328.3 230.8 376.3 408.2 342.8
Calcium
109.8 98.3
80.8
149.3 87.9
128.3 162.8 108.3
Magnesium
76.8
51.5
24.8
73.2
54.3
Chloride
72.8
80.3
108.3 106.8 93.2
108.3 123.2 160.1
DO
4.8
4.6
4.8
4.2
4.8
4.7
4.5
4.3
BOD
1.2
0.9
1.0
0.8
0.7
1.2
1.3
1.2
Sulphate
128.5 86.4
Alkalinity
103.5 140.5 98.3
108.5 142.8 103.5 135.5 105.3
Nitrate
1.28
1.62
2.08
1.05
1.14
1.54
1.36
2.05
COD
4.8
5.1
5.2
5.3
5.6
4.8
6.0
5.2
Iron
0.003 0.002 0.003 0.002 0.003 0.004 nd
nd
26.2
108.3 162.3 80.5
S6
S7
60.5
S8
71.3
108.2 148.5 162.0
All the parameters expressed in mg/lit. Except pH and EC (mmhos) * All the values are the average of 3 determinations. 78
Table – 6 Physico – Chemical Parameters of Water Samples Collected on 11-05-2010
Parameter
S1
S2
S3
S4
S5
Temperature 0C
27.68 26.90 28.03 27.84 28.3
27.02 27.82 27.52
pH
7.65
7.68
7.35
7.93
7.84
8.0
7.82
7.60
Electrical Conductivity TDS
1.3
1.9
0.8
1.8
0.5
0.5
1.7
1.6
508
639
305
468
632
385
520
572
TSS
57.9
42.0
48.6
39.6
36.9
22.7
34.8
57.2
Hardness
490.3 304.8 212.0 340.6 239.5 299.2 418.6 389.4
Calcium
147.2 126.1 85.4
159.3 89.04 129.2 178.9 94.2
Magnesium
68.5
56.0
29.9
65.8
Chloride
89.2
68.7
103.7 126.3 92.3
115.8 132.7 97.8
DO
5.0
4.8
4.9
5.0
4.6
5.7
4.6
4.3
BOD
1.4
0.8
1.2
0.9
0.8
0.7
0.9
1.0
Sulphate
100.8 82.8
Alkalinity
118.0 149.3 108.2 122.5 162.0 110.5 140.4 115.8
Nitrate
1.42
1.03
1.80
2.13
1.22
1.65
1.25
2.01
COD
5.0
4.8
3.8
5.3
5.0
4.9
5.3
5.2
Iron
0.003 0.002 0.004 0.004 0.002 0.003 0.004 0.005
23.2
112.2 135.2 74.8
S6
S7
46.8
66.6
S8
32.4
142.8 146.3 139.0
All the parameters expressed in mg/lit. except
pH and EC
(mmhos) * All the values are the average of 3 determinations. „nd‟ values are taken in to „0‟ for Graphs 79
Table – 7 Water Quality Index of Well & Bore Well Waters of Guntur rural Date 11-02-2010 parameter
ICMR Standard
Unit weight(wn)
pH
7.74
0.07164
6.7567
7.034
6.8678
7.21016
7.2195
7.2195
6.988
7.1455
TDS
500
0.00100
0.1124
0.1418
0.084
0.1256
0.0936
0.097
0.105
0.1152
TH
200
0.00167
0.4442
0.2626
0.1840
0.2881
0.1941
0.3195
0.35087
0.2944
DO
5
0.10030
9.629
9.027
10.03
8.024
9.428
.8.425
9.227
8.626
BOD
5
0.10030
2.608
1.003
2.4072
1.6048
1.4042
1.6048
2.8084
2.4072
Chloride
250
0.00200
0.05936
0.07
0.0986
0.09304
0.0752
0.09256
0.1072
0.1308
Total Alkalinity
120
0.00417
0.0447
0.05421
0.037
0.04587
0.05636
0.04253
0.05234
0.03997
NO3
45
0.01111
0.03471
0.0474
0.052587
0.0555
0.04438
0.04074
0.04567
0.053081
COD
20
0.02507
0.65182
0.60163
0.65182
0.664
0.7521
0.6142
0.7772
0.72703
Sulphate
200
0.007418
0.04896
0.03579
0.04637
0.06862
0.03245
0.040242
0.064982
0.060086
Iron
0.3
1.6666
1.11066
1.666
2.22132
1.11066
1.666
1.666
2.22132
nd
wn
----
----
1.98487
----
----
----
----
----
----
----
qn
----
----
21.50051
19.94345
22.6807
19.29035
20.96589
20.1621
22.7479
19.5993
WQI
----
----
42.6757
39.587
45..01824
38.2889
41.6146
40.0191
45.1518
38.9020
S1
S2
S3
S4
S5
S6
S7
S8
80
Variation of Temperature 28.5 Temperature 0C Dec'09
27.5
Temperature 0C Jan'10
oC
28
Temperature 0C Feb'10 27
Temperature 0C Mar'10
26.5
Temperature 0C Apr'10 Temperature 0C May'10
26 S1
S2
S3
S4
S5
S6
S7
S8
mmhos
Variation of pH 8.2 8 7.8 7.6 7.4 7.2 7 6.8 6.6
pH Dec'09 pH Jan'10 pH Feb'10 pH March'10 pH April'10 pH May'10 S1
S2
S3
S4
S5
S6
S7
S8
VARIATION OF ELECTRICAL CONDUCTIVITY Electrical conductivity Dec'09
2
Electrical conductivity Jan'10 mmhos
1.5 Electrical conductivity Feb'10 1
Electrical conductivity Mar'10
0.5
Electrical conductivity Apr'10
0
Electrical conductivity May'10 S1
S2
S3
S4
S5
S6
S7
S8
81
Variation of Total Dissolved Solids 800
mg/lit
700 600
TDS Dec'09
500
TDS Jan'10
400
TDS Feb'10
300
TDSMar'10
200
TDSApr'10
100
TDSMay'10
0 S1
S2
S3
S4
S5
S6
S7
S8
mg/lit
Variation of TSS 90 80 70 60 50 40 30 20 10 0
TssDec'09 TSS Jan'10 TSS Feb'10 TSS Mar'10 TSS Feb'10 TSSMay'10 S1
S2
S3
S4
S5
S6
S7
S8
Variation of Hardness in Water 600 500 Hardness Dec'09 mg/lit
400
Hardness Jan'10
300
Hardness Feb'10
200
Hardness Mar'10 Hardness Apr'10
100
Hardness May'10
0 S1
S2
S3
S4
S5
S6
S7
S8
82
mg/lit
Variation of Calcium 200 180 160 140 120 100 80 60 40 20 0
Calcium Dec'09 Calcium Jan'10 CalciumFeb'10 Calcium Mar'10 Calcium Apr'10 Calcium May'10 S1
S2
S3
S4
S5
S6
S7
S8
Variation of Magnesium 100 Magnesium Dec'09
mg/lit
80
Magnesium Jan'10
60
Magnesium Feb'10
40
Magnesium Mar'10
20
Magnesium April'10
0
Magnesium May'10 S1
S2
S3
S4
S5
S6
S7
S8
Variation of Chloride 180 160 140
Chloride Dec'09
mg/lit
120
Chloride Jan'10
100
Chloride Feb'10
80
Chloride Mar'10
60 40
Chloride Apr'10
20
Chloride May'10
0 S1
S2
S3
S4
S5
S6
S7
S8
83
Variation of Dissolved Oxygen 6 5
DO Dec'09
mg/lit
4
DO Jan'10
3
DO Feb'10
2
DO Mar'10 DO Apr'10
1
DO May'10 0 S1
S2
S3
S4
S5
S6
S7
S8
Variation of Biological Oxygen Demand 1.6
mg/lit
1.4 1.2
BOD Dec'09
1
BOD Jan'10
0.8
BOD Feb'10
0.6
BOD Mar'10
0.4
BOD Apr'10
0.2
BOD May'10
0 S1
S2
S3
S4
S5
S6
S7
S8
Variation of Sulphate 200 Sulphate Dec'09
mg/lit
150
Sulphate Jan'10 100
Sulphate Feb'10 Sulphate Mar'10
50
Sulphate Apr'10 0
Sulphate Ma'10 S1
S2
S3
S4
S5
S6
S7
S8
84
``
```
Variation of Alkalinity 200 180
mg/lit
160 140
Alkalinity Dec'09
120
Alkalinity Jan'10
100
Alkalinity Feb'10
80
Alkalinity Mar'10
60
Alkalinity Apr'10
40
Alkalinity May'10
20 0 S1
S2
S3
S4
S5
S6
S7
S8
Variation of Nitrate 2.5 2
mg/lit
Nitrate dec'09 Nitrate Jan'10
1.5
Nitrate Feb'10 1
Nitrate Mar'10 Nitrate Apr'10
0.5
Nitrate May'10
0 S1
S2
S3
S4
S5
S6
S7
S8
85
Variation of Chemical Oxygen Demand 7 6 COD Dec'09
mg/lit
5
COD Jan'10
4
COD Feb'10
3
COD Mar'10
2
COD Apr'10
1
COD May'10
0 S1
S2
S3
S4
S5
S6
S7
S8
Variation of Iron 0.006 0.005
Iron Dec'09
mg/lit
0.004
Iron Jan'10
0.003
Iron Feb'10
0.002
Iron Mar'10 Iron Apr'10
0.001
Iron May'10
0 S1
S2
S3
S4
S5
S6
S7
S8
86