Final Bahrami Layout_Layout 1 6/13/14 10:36 AM Page 262
WELDING RESEARCH
Modeling of Carbon Steel Duplex Stainless Steel GTA Weld Pool A study investigates the spot gas tungsten arc (GTA) welding of dissimilar magnetic ferrous alloys 1018 carbon steel to 2205 duplex stainless steel BY A. BAHRAMI AND D. K. AIDUN
ABSTRACT The fluid flow and heat transfer in dissimilar spot gas tungsten arc welding (GTAW) of carbon steel to duplex stainless steel is numerically simulated in this research study. A three-dimensional (3D) model, which considers the differences in the material properties of the base metals, and includes the effects of the electromagnetic, buoyancy, and Marangoni convections, was prepared by using the finite element software COMSOL Multiphysics® 4.3b. The history of the fluid flow in the weld pool (WP) is investigated by tracking the travel path of individual fluid particles. An asymmetric weld profile is obtained in which the deepest penetration is shifted toward the stainless steel. The numerically calculated weld geometry reasonably matches the experimentally obtained weld profile. To achieve symmetrical weld geometry, the arc location is shifted toward the steel side. It was observed that relocating the arc moves the deepest penetration toward the weld joint, but it does not significantly increase the depth of penetration of the weld.
KEYWORDS • Dissimilar Welding • Gas Tungsten Arc Welding (GTAW) • Weld Pool • Fluid Flow • Heat Transfer • Weld Penetration • Weld Profile
Introduction Joining dissimilar alloys could significantly reduce the cost and weight of production without compromising the safety and structural requirements (Ref. 1). The difference in the thermophysical, mechanical, and metallurgical properties of the base metals, along with the solution and phase restrictions, are the challenges in dissimilar welding. The fusion and heataffected zones (HAZ) are asymmetric due to differences in the melting temperatures, thermal diffusivities, and compositions of the base metals, and accordingly, the deepest penetration is usually located off the weld joint (or
interface) (Ref. 2); in other words, the centerline shift (CLS) is not zero (Ref. 3). Experimental study of heat transfer and fluid flow inside the arc and the weld pool (WP) during the welding process is difficult due to the high temperature of the arc and the molten metal, the small size of the WP, and short welding time. Therefore, application of mathematical models and numerical simulations provide powerful tools for investigation of arc welding processes. Fundamental study of the transport phenomena involved in the arc welding process of dissimilar metals/alloys is essential for prediction of
the geometry of the fusion and HAZ, dilution and mixing, cooling rate, and thermal stress residuals. Electromagnetic force (Lorentz force) and temperature-dependent surface tension and density (Marangoni and buoyancy effects) are the effects that circulate the fluid in the WP (Ref. 4). These effects have been numerically modeled in the welding process of similar base metals. A two-dimensional axisymmetric model is most often used in numerical simulation of spot welding of similar metals (Ref. 5). Some of the models simulate the transport phenomena in the workpiece separately from the arc (Refs. 6–8). In these models, the heat flux and current density from the arc is applied as external inputs at the surface of the workpiece. On the other hand, some researchers modeled the arc and workpiece as a unified system to better understand the interactions between the arc and the workpiece (Refs. 5, 9–12). Gas tungsten arc welding 304L stainless steel plates with different sulfur concentrations was numerically and experimentally studied by Mishra et al. (Ref. 3). The presence of sulfur in the stainless steel was shown to affect the heat transfer and fluid flow in the welding process. The results indicated, when 304L stainless steels with different sulfur contents are welded to each other, maximum penetration occurs inside the low-sulfur stainless steel, not at the joint (CLS ≠ 0). The results show flaring of the arc toward lowsulfur steel leads to shifting of the deepest penetration from the joint. It was experimentally and numerically found that the sulfur mixes rapidly, and the gradient of the sulfur concen-
A. BAHRAMI (
[email protected]) is a PhD candidate and D. K. AIDUN is professor and chair of the Mechanical and Aeronautical Engineering (MAE) Dept. at Clarkson University, Potsdam, N.Y.
262-s WELDING JOURNAL / JULY 2014, VOL. 93
Final Bahrami Layout_Layout 1 6/13/14 10:36 AM Page 263
WELDING RESEARCH
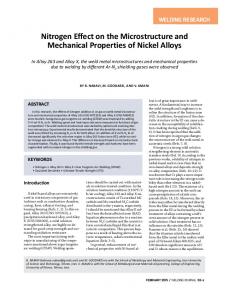
Fig. 1 — Configuration of the weldment and coordinate system.
tration at the top surface of the weld is insignificant. However, it should be pointed out, in their case, the material properties of the base metals are the same, and the only asymmetric variable was the sulfur content in the 304L base metals (BM). The transport phenomena in laser welding dissimilar couples of Cu to Ni (Refs. 2, 13–15) were numerically studied with the emphasis on mixing. All these studies show a fairly uniform distribution of Ni in the WP. Mukherjee et al. (Ref. 16) investigated transport phenomena in the laser welding of Fe-Al dissimilar coupled with a layer of Ta as a diffusion barrier. The results showed a greater degree of melting happened in the Fe side. Consequently, an asymmetric WP with asymmetric velocity and temperature fields was created. The heat and mass transfer in laser welding of 304 stainless steel to Ni, a dissimilar couple, was studied by Hu et al. (Ref. 17). It was observed that the distribution of the element Fe in the WP became uniform after 90 ms (0.090 s). In the absence of magnetohydrodynamics (MHD) in the laser welding of dissimilar alloys, the fluid is basically driven by the Marangoni and buoyancy in the WP. As a result, the velocity at the top surface of the weld is significantly higher than that inside the WP. However, in dissimilar arc welding, the Lorentz force increases the velocity of the melt inside the WP. A higher velocity inside the WP leads to a more uniform mixing (especially along the depth), resulting in a more homogenous
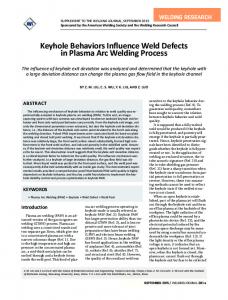
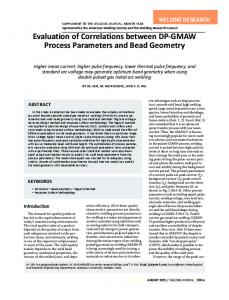
Fig. 2 — Lorentz force density field in the weld pool. Carbon steel is to the left and stainless steel is to the right.
composition, which is vital to achieve good weld quality. In a previous study, the authors developed a numerical model to investigate transport phenomena in spot GTAW of lowcarbon steel to duplex stainless steel (Ref. 18). The distribution of alloying elements across the weld was determined using EDS analysis. Accordingly, the degree of dilution of each element in the weld zone was calculated. The results showed the mixing was quite uniform across the weld zone. The weld geometry was numerically simulated, and a favorable agreement between the numerical and experimental results was obtained. Both numerical and experimental results show the deepest penetration does not happen at the joint but inside the stainless steel side (CLS ≠ 0). In this paper, a more detailed 3D simulation of the fluid and temperature fields in spot GTAW steel to duplex stainless steel is presented. The effects of Marangoni convection and Lorentz force on the fluid motion in the WP are presented. The history of the time-dependent fluid motion in the weld is demonstrated by tracking several fluid particles in the WP using the “pathlines” (Ref. 19). To study the effect of the arc location on the asymmetric geometry of the WP, the simulations are repeated for different arc locations, and geometrical features of the WP were investigated.
Mathematical Model of the WP The difference in the properties of the weldments leads to asymmetric electromagnetic-induced flow and
temperature fields; therefore, a 3D model is required to simulate the transport phenomena in dissimilar welding processes. To mathematically model the spot GTAW process in this study, the following assumptions have been made: • The fluid flow in the WP is laminar. • Gaussian distributions of the heat and current density inputs are applied at the top surface. • The Boussinesq approximation is used to take into account the buoyancy convection. • The molten materials mix rapidly; therefore, within the bulk of the WP, all of the alloying elements including S are uniformly distributed, and thus concentration gradient will be zero. • The effects of surface deformation are neglected. Based on these assumptions, a computational model was developed, which includes electromagnetics, solid-liquid phase change, fluid flow, and heat transfer. The classic Maxwell’s equations are used to resolve the electromagnetic field and the Lorentz force, then the flow and temperature fields are analyzed by applying the conservation equations of mass, momentum, and energy. The mathematical formulations of these physical phenomena and the boundary conditions are described in detail in the literature (Ref. 18). One of the complexities of the numerical simulation of the dissimilar welding process is handling the material properties of the solution in the WP and mixing of diluted species. To accurately calculate the material prop-
JULY 2014 / WELDING JOURNAL 263-s
Final Bahrami Layout_Layout 1 6/13/14 10:36 AM Page 264
WELDING RESEARCH
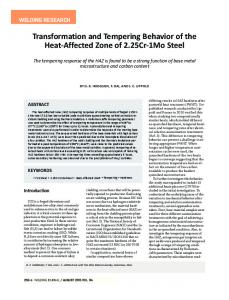
Fig. 3 — Marangoniinduced shear stresses and temperature contours (K) on the weld pool surface.
erties in dissimilar welding, the transport equations for all diluted species should be solved fully coupled with each other and with other governing equations that were mentioned before. In the case of welding carbon steel to duplex stainless steel, as featured in the present study, there are a total of 12 alloying elements in the weldment (see Table 1); therefore, 12 transport equations are added to the model. As mentioned in the introduction, Hu et al. (Ref. 17) studied laser welding Ni to 304SS and showed that the alloying elements uniformly mix after 0.090 s. In the current study the arc time is 15 s, which is large enough to neglect such an initiation time. Also, Mishra et al. (Ref. 3), in the study of welding stainless steels with different sulfur contents, showed that a recirculation in the WP takes about 0.035 s, which is about 0.08% of the 4 s total time that the metal is in the liquid phase. Based on these observations, in this study, it is assumed that the melt mixes rapidly to produce a uniform material throughout the WP. This assumption eliminates 12 partial differential equations and significantly simplifies the model. The material properties of the solu-
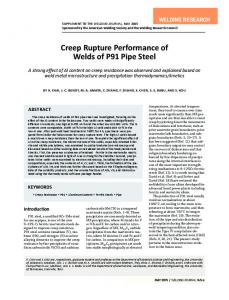
Fig. 4 — Velocity field in the weld pool at 15 s of arc time.
tion are functions of the properties of the base metals and the mass fraction of each metal in the mixture (Ref. 20). To determine the material properties of the solution in the WP based on the assumption of uniform mixing, the following equation is used: Aw = DBM1ABM1 + DBM2ABM2
(1)
In this equation, subscripts w, BM1, and BM2 denote the weld, base metal 1, and base metal 2, respectively; A is the material property, which could be replaced by the density ρ; thermal expansion factor β; thermal conductivity k; heat capacity Cp; viscosity; and electrical conductivity σ and D is the degree of dilution. The dilution, D, can be calculated from metallographic methods as well as numerical methods (Ref. 18).
Numerical Method The finite element software COMSOL Multiphysics (v.4.3b) is used to numerically simulate the transport phenomena in the welding process of dissimilar alloys. This software is capable of resolving the models, which include several physical phenomena, and takes into account the interactions
among different physics. To calculate the Lorentz force in the WP, electric currents and magnetic field modules are applied. A Gaussian distribution of the current density at the top surface of the weldment simulates the presence of the arc, and the bottom surface is grounded. The modules heat transfer in fluids with phase change and laminar flow are employed to resolve the flow and temperature fields. The Lorentz force, which was previously calculated, along with the buoyancy effects, is applied to the laminar flow module as a volume force. The Marangoni effect is imposed to the model as a surface stress boundary condition. A smoothed Heaviside function is applied to smooth sharp changes in the material properties at the joint. Applying this function considerably improves the convergence and quality of the results. The degree of polynomials in the finite element discretization of all of the partial differential equations is set to quadratic. An unstructured tetrahedral meshing is applied to all of the domains — Fig. 1. The mesh size is very fine with maximum element size of 0.08 mm in the part of the domain that includes the WP. The mesh is rela-
Table 1 — Composition of 1018 Steel and 2205 Duplex Stainless Steel (wt%)
1018 2205
Fe
Cr
Ni
Mo
C
Mn
Si
S
P
Co
Cu
N
Bal. Bal.
— 22.51
— 5.38
— 3.12
0.18 0.021
0.75 1.76
0.22 0.50
0.03 0.002
0.03 0.028
— 0.20
— 0.43
— 0.170
264-s WELDING JOURNAL / JULY 2014, VOL. 93
Final Bahrami Layout_Layout 1 6/13/14 10:36 AM Page 265
WELDING RESEARCH
Fig. 6 — Pathline of a fluid particle initially located at (0.5, 0.5, –0.5) with final location at (–1.8, 0.05, –0.72). Fig. 5 — Temperature isosurfaces and heat flux vectors in the weld pool.
tively coarser at the remaining parts of the model with maximum element size of 0.4 mm. The total number of elements is 198821. A fully coupled, time-dependent solver with maximum time step of 0.1 s is employed to resolve the system of partial differential equations. An HP® Z220 workstation with a CPU frequency of 3.4 GHz and a memory of 32 GB is used to resolve the models. Each simulation took approximately 115 h to perform.
Results and Discussion The magnetic ferrous Alloys 1018 steel and 2205 duplex stainless steel are chosen as base metals for this study (see Table 1). Coupons of steel and stainless steel with a size of 26 × 13 × 6 mm are to be joined to form 26 × 26 × 6 mm welded samples, as shown in Fig. 1. The origin of the coordinate system is located at the center of the top surface of the weldment. The spot GTA weld is simulated for an arc current of 150 A, voltage of 14 V, and an arc time of 15 s. An arc efficiency of 75% is used in the numerical simulation. Solution Properties The determination of the degree of dilution is required to calculate the material properties of the solution. An EDS analysis was carried out at different locations across the WZ (Ref. 18) to measure the concentration of alloying elements. The results showed a
fairly uniform distribution of the elements in the WZ, which confirms the corresponding assumption in this study. The following equation was used to determine the degree of dilution for each alloying element (Ref. 20): i i i C fz = DCbm, 1 + ( 1 − D) C bm,2
(2)
where Cifz, Cibm,1, and Cibm,2 are the concentration of ith element in the fusion zone, BM 1 and BM 2, respectively. The dilutions of the elements, from the steel side to the WP, vary from 0.27 to 0.33. Accordingly, an average value of 0.30 is used as the dilution in Equation 1 to calculate the solution properties in the WP. The properties of the base metals are presented in Table 2. Flow and Temperature Fields As the first step of the simulation, the electromagnetic field in the metals
was calculated. Figure 2 presents a 3D view of the Lorentz force density field in the WP. A color scale is specified to the arrows in Fig. 2 to indicate their magnitude. The values of electrical conductivity and magnetic permeability of the carbon steel are higher than those of the duplex stainless steel. Accordingly, the Lorentz force field is much stronger in the steel side. The maximum value of the Lorentz force density in the steel side is 7.6 × 10⁴ N/m3, which is almost three times larger than that in the stainless steel side with a value of 2.4 × 10⁴ N/m3. Beside the Lorentz force, Marangoni effect plays a major role in circulation of the fluid in the WP. This effect acts at the free surface of the WP as a shear stress, for example (Ref. 3): τ τ
xz z=0
∂u dγ ∂T dγ ∂C = −μ = + , ∂ z z=0 dT ∂ x dC ∂ x
yz z=0
∂ν dγ ∂T dγ ∂C = −μ = + ∂ z z=0 dT ∂ y dC ∂ y
(3)
Table 2 — Thermophysical Properties Used in the Numerical Simulation (Ref. 24) Property name Liquidus temperature Solidus temperature Heat of fusion Solid specific heat Liquid specific heat Solid thermal conductivity Liquid thermal conductivity Solid density Liquid density Volume thermal expansion of liquid Dynamic viscosity Electrical conductivity
1018
2205
1802 K 1770 K 240 kJ/kg 750 J/kg.K 840 J/kg.K 39.4 W/m.K 36.5 W/m.K 7530 kg/m3 7150 kg/m3 1.20 × 10⁴ /K 6.5 × 10³ kg/m.s 7 × 10⁶ 1/Ωm
1680 K 1633 K 260 kJ/kg 720 J/kg.K 830 J/kg.K 32.0 W/m.K 29.0 W/m.K 7250 kg/m3 6850 kg/m3 1.12 × 10⁴/K 7 × 10³ kg/m.s 1.5 × 10⁶ 1/Ωm
JULY 2014 / WELDING JOURNAL 265-s
Final Bahrami Layout_Layout 1 6/13/14 10:36 AM Page 266
WELDING RESEARCH where τxz and τyz are the shear stresses at the surface; u and v are the velocity components in the x and y directions, respectively; and μ is the viscosity. T and C are the temperature, the concentration of the solute, and dγ/dT and dγ/dC are the temperature and concentration derivatives of the surface tension, respectively. The surface tension of the solution in the WP is a function of temperature and composition of the surfactant elements such as sulfur (S) (Ref. 21). This function is thermodynamically analyzed and derived for different binary systems. For an Fe-S binary system, surface tension equation is as follows: γ = 1.943–4.3 × 10⁻⁴ (T − Tl ) − 1.3 × 10⁻⁸ RT × ln ( 1 + 0.00318as exp
–1.66 × 10⁸ ) RT
(4)
In this equation, γ is the surface tension; Tl is the melting temperature (liquidus temperature); R is the gas constant (8314.3 J/kmol.K); and as is the sulfur activity, which can be approximated as sulfur concentration in the WP. The surface tension equation available for Fe-S systems is proved to be applicable for approximation of the changes in the surface tension of ferrous alloys (Ref. 22). In this study, it is assumed the sulfur concentration gradient at the top surface of the WP is negligible. Therefore, ∂C/∂x = ∂C/∂y = 0. Accordingly, the second terms on the right-hand sides of Equation 3 go to zero. This assumption is valid for a 15-s spot GTA weld, since it will take only a fraction of a second to obtain uniform mixing especially at the top surface of the WP (Ref. 17). The sulfur concentration in the 1018 steel and 2205 stainless steel are 0.03 and 0.002 wt-%, respectively. Based on the measured dilution of 30% for the steel, the sulfur concentration in the WP is predicted to be 0.01 wt-%. This value is applied in Equation 4 to evaluate the surface tension of the mixture at different temperatures. The temperature derivative of the surface tension is calculated by differentiation of Equation 4 with respect to T. Figure 3 shows the distribution of the shear stresses along with the tem-
perature contours at A the top surface of the WP at 15 s of arc time. The temperature derivative of the surface tension is positive for the temperatures under 1860 K; therefore, the shear stress, or Marangoni stress, is negative at the vicinity of the boundary of the WP (arrows point toward B the center). The 1860 K isotherm could be considered as the zero shear stress contours. The maximum temperature happens at the stainless side, and the gradient of the temperature in the x and y directions (∂T/∂x and ∂T/∂y) are larger on this side. As a result, the maximum value of the shear stress occurs at the stainless steel Fig. 7 — Initial and final locations of 99 particles in the weld side. pool. Steel is on the top and stainless steel is on the bottom. The velocity field in the WP at 15 s is pretive plus conductive). The maximum sented in Fig. 4. The iso-surfaces show temperature happens in the stainless the magnitude of the velocity at differsteel side. The heat transfer field is ent locations in the WP, and the similar to the velocity field (regardless arrows represent the direction of the of the magnitudes), which means that velocity. The velocity field in the WP is the convection is the dominant heat determined by the opposing driving transfer in the WP. This fact is forces, Marangoni and Lorentz. The confirmed by calculation of Peclet direction of the flow at the top surface number in the WP. This dimensionless is from the center toward the boundnumber represents the ratio of convecaries. A stronger Marangoni shear tion to conduction (Ref. 23), for field and a weaker Lorentz force field example: in the stainless steel side lead to higher velocities at the top surface of UL the stainless steel side. Inside the WP, Pe = (5) the stronger Lorentz force at the steel k side pushes the melt from the steel ρc p side toward the stainless steel side. It where U and L are the scale velocity could be observed the velocity inside and length, respectively, and k, ρ, and the WP (excluding the top surface) is Cp represent the thermal conductivity, always less than 0.1 m/s while at the density, and specific heat, respectively. top surface the maximum velocity is If the average velocity in the WP (0.05 greater than 0.14 m/s. This means m/s) is used for U, and the WP radius that the Marangoni effect is stronger (0.004 m) is used for L, the calculated on the surface than the Peclet number, Pe, will be around 32. electromagnetic effect in the WP. This value confirms that the In Fig. 5, the iso-surfaces show the convective heat transfer rate is much values of temperature at different lolarger than the conductive heat transcations in the WP, and the arrows repfer rate in the WP. resent the total heat flux field (convec-
266-s WELDING JOURNAL / JULY 2014, VOL. 93
Final Bahrami Layout_Layout 1 6/13/14 10:36 AM Page 267
WELDING RESEARCH Motion of Liquid in the WP
B
A To investigate the history of the fluid flow in a time-dependent system, trajectories of individual fluid particles (very small parts of the fluid) could be tracked. These trajectories are called “pathlines” in fluid mechanics terminology (Ref. 19). Figure 6 shows the path of the particle, which is initially located at (0.5, 0.5, –0.5), in the stainless side (see Fig. 1 for the coordinate system configuration). The particle is incorporated into the WP 1.06 s after arc initiation. As seen in Fig. 6, the particle moves around and within the WP several times and covers a relatively large distance. Eventually, at 15 s, the particle ends up at (–1.8, 0.05, –0.72) in the steel side. The length of the path traversed by the particle is 212 mm, although the final location is just 2.4 mm away from the initial location. The path length is 85 times larger than the depth and 26 times larger than the length of the WP. A color scale is specified to the pathline in Fig. 6, which shows the magnitude of velocities that the particle experienced at different locations. The circulations near the surface of the WP are created by the Marangoni effect (as indicated in the figure). As can be seen, as a result of the Marangoni shear, the particle accelerates when it travels on the surface of the weld. The maximum velocity of the particle is 0.19 m/s, which happens at 1.7 s on the surface. As indicated in the figure, at center of the WP, the circulation of the particle is predominantly driven by the Lorentz force. The average velocity of this particular particle is 0.015 m/s after 13.94 s of travel.
D
C
Fig. 8 — Weld pool geometry. A — Crosssectional view; B — joint view; C — top view; D — sectioned 3D view.
A
C B
Mixing in the WP To understand mixing during dissimilar weld processes, the travel of the particles that are initially arranged in a 3D, uniform (cubic) lattice with a separation distance of 0.5 mm in all directions (see Fig. 7A) is studied. The volume of the WP (45.7 mm3), which is developed after 15 s of arc time, can only accommodate a total of 99 particles (the particles located at the interfaces are not included). Out of the 99 particles, 28 (blue colors) are located in the steel side and 71 (red colors) are
Fig. 9 — Weld geometry. A — Cross section (xzview); B — half of the joint view (yzview); C — top view (xyview).
located in the stainless steel side based on the volume. As the welding process goes on, the WP develops and the particles gradually incorporate into the melt. Figure 7B shows the final locations of the particles. The pathlines of the particles generally
have similar helical structures, as shown in Fig. 6; therefore, for the sake of visibility, the pathlines are not displayed in Fig. 7B. Out of 28 particles that were initially located in the steel side, 9 particles end up in the steel side and 19 in the stainless steel side, JULY 2014 / WELDING JOURNAL 267-s
Final Bahrami Layout_Layout 1 6/13/14 10:36 AM Page 268
WELDING RESEARCH
A
C
B
D
Fig. 10 — Weld profile for different arc locations (xzplane). Steel is on the left and stain less steel is on the right.
A
C
and out of 71 particles initially located in the stainless steel side, 21 particles end up in the steel side and 50 end up in the stainless side. In other words, almost 32% of steel particles (blue) and 29% of stainless steel particles (red) are ultimately located in the steel side. The pathline length calculations shows an average travel distance of 120.3 mm for the 28 steel particles (particles initially located at the steel side), and an average travel distance of 110.9 mm for the 71 stainless steel particles (particles initially located at the stainless steel side). The relatively long path covered by the particles ensures that a uniform mixing takes place in the WP. Weld Geometry
B
D
Fig. 11 — Top view of the weld pool for different arc locations (xyplane). Steel is on the left and stainless steel is on the right.
Table 3 — Geometric Features of the Weld Pool for Different Arc Locations Arc Location on XAxis (mm)
Depth at Joint (mm)
Max. Depth (mm)
CLS (mm)
Joint Area (mm2)
Dilution of Steel in the WP*
0 –0.5 –1.0 –1.5 –2.0
1.90 1.95 2.01 1.85 1.61
2.47 2.33 2.20 2.02 1.68
1.21 0.95 0.46 0.22 –2.12
8.10 8.28 8.35 7.70 6.48
0.29 0.34 0.46 0.57 0.71
*Based on the volume of the WP.
268-s WELDING JOURNAL / JULY 2014 VOL. 93
Figure 8 shows the WP geometry at different views. Due to the higher melting temperature and thermal diffusivity, the size of the WP is smaller in the steel side. Accordingly, the deepest penetration happens in the stainless steel side (CLS = 1.21 mm). The whole WP has a volume of 45.7 mm3 of which 13.1 mm3 is into the steel side. The ratio of the weld volume in the steel side to the whole volume is 28.7%, which is in good agreement with the degree of dilution previously calculated based on the composition of the weld (Ref. 18). The depth of penetration at the weld joint (x = 0) is 1.9 mm, and the weld joint area is 8.1 mm2 — Fig. 8B. To validate the geometry obtained from the modeling, actual spot GTAW of 1018 steel to 2205 stainless steel is performed with the same welding parameters used in the simulation. The welded sample was sectioned at the center of the weld zone and perpendicular to the joint to obtain the crosssectional view. One of the slices of the sample was sectioned again along the joint to show the joint view — Fig. 9B. Figure 9A shows the cross section of the weld zone. To reveal the weld boundary without overetching the sample, different etchants were applied to different alloys. Nital was swabbed on the steel side, and Glyceria was swabbed on the stainless steel side. Figure 9B and C show the joint and the top views of the welded sample, respectively. A general comparison
Final Bahrami Layout_Layout 1 6/13/14 10:36 AM Page 269
WELDING RESEARCH of Figs. 8 and 9 shows the model captures the essential geometrical features of the weld zone. Achieving a symmetric weld zone with the deepest part at the joint is usually one of the factors of a good quality weld. As previously seen in this study, the deepest part of the WP is located in the stainless side rather than being located at the joint (x = 0). This effect is called a missed joint in the welding terminology (Ref. 18). To achieve symmetry, a preliminary suggestion would be to relocate the arc from the joint toward the alloy with the higher melting temperature and thermal conductivity, which is the carbon steel in the case of present study. In this section, the effect of the location of the arc on the geometric features of the weld is investigated. The welding process for four different locations of the arc — 0.5, 1.0, 1.5, and 2.0 mm away from the joint toward the carbon steel side — are numerically simulated. In these models, the center of the heat source and current density input is located at x = –0.5, –1, –1.5, and –2 mm. The arc current in all of the simulations is 150 A, and the arc time is 15 s. Figure 10 shows the cross-sectional profiles, and Fig. 11 shows the top view profiles of the WP for the selected arc locations. As can be seen, as the arc is located farther on the steel side, the WP shifts toward the steel. Although the volume of the WP in the steel side increases, and that in the stainless steel side decreases, a symmetric WP geometry is never achieved. The geometrical features of the WP in different cases are listed in Table 3. It is observed the depth of weld penetration and the weld joint area at the weld interface (x = 0) increases until the arc position of x = –1.0 mm, and then it decreases. The quality of the weldment depends on the weld penetration and joint area at the weld interface (x = 0). The depth of penetration at the joint is maximum with a value of 2.01 mm when the arc is located at x = –1.0 mm. The weld joint area also has its maximum value when the arc is located at x = –1.0. For the case of the arc located at x = –0.5, –1.0, and –1.5 mm, the maximum depth occurs at the stainless steel side close to the joint, and for the case of x
= –2.0 mm at the steel side. Therefore, the CLS approaches zero until x = –1.5 mm. The CLS has a negative value for the case of x = –2 mm, which means the CLS has shifted toward the steel side. From Table 3, it shows the optimum arc location is at x = –1.0 mm because it will produce the maximum penetration (2.01 mm) at the weld joint, and has the maximum weld joint area (8.35 mm2) with a steel/stainless steel dilution of 46/54%. According to these results, it can be concluded that the best weld aspect ratio to achieve the best weld quality is obtained when the arc is located at x = –1.0 mm. By comparing the values of the joint penetration and joint area in Table 3, it is seen that by relocating the arc from x = 0 to x = –1.0 mm, the penetration at the joint increases by around 5% and the joint area increases by around 2%. It is also observed the weld quality cannot be judged solely based on the top view of the weld zone (Fig. 11) because a larger top view area does not always guarantee a larger weld penetration and joint area at the weld interface (x = 0) especially in dissimilar welds.
Conclusion The spot GTAW of dissimilar magnetic ferrous alloys, 1018 carbon steel to 2205 duplex stainless steel, was investigated. The velocity and temperature fields in the WP were numerically modeled. The calculated weld profile, obtained from numerical study, showed a good resemblance with that of the experiment. The accomplishments of this study are summarized as follows: • Due to different thermal physical properties, especially the melting temperature and thermal conductivity, the WP is asymmetric. A larger portion of the volume of the WP is located in the stainless steel side, which has the lower melting temperature. The deepest penetration does not occur at the joint but in the stainless steel side. • It was seen that higher electrical conductivity of the steel leads to an asymmetric Lorentz force density distribution in the WP. The direction of the Lorentz force in either side of the WP is always toward the center of the WP, but the magnitude of this force is much higher in the steel side.
• The travel path of several fluid particles in the WP during the welding process was investigated. The pathlines show the fluid generally experiences two types of helical motion, one at the surface under the effect of Marangoni stresses, and one at the center of the WP under the effect of Lorentz force. The study of initial and final locations of the particles and length of the travel pathlines ensure a uniform mixing in the melt. It could be concluded that up to the onset of solidification the mixture is uniform and homogeneous. • The spot GTAW simulation was repeated for four arc locations along the x-axis toward the steel side (with higher melting temperature) to obtain a weld profile closer to symmetry. It is observed a perfectly symmetric profile is never achieved by moving the arc toward the steel. As the arc is shifted toward the steel, the joint area and penetration slightly increase, and after reaching an optimum location, they start decreasing. In this particular study, the optimum arc location is calculated to be 1.0 mm away from the joint in the steel side. References 1. Lippold, J. C., and Kotecki, D. J. 2005. Welding Metallurgy and Weldability of Stainless Steels. New Jersey: Wiley. 2. Chakraborty, N., and Chakraborty, S. 2007. Modelling of turbulent molten pool convection in laser welding of a coppernickel dissimilar couple. International Journal of Heat and Mass Transfer 50: 1805– 1822. 3. Mishra, S., Lienert, T. J., Johnson, M. Q., and DebRoy, T. 2008. An experimental and theoretical study of gas tungsten arc welding of stainless steel plates with different sulfur concentrations. Acta Materialia 56: 2133–2146. 4. Kou, S. 2003. Welding Metallurgy. New Jersey: Wiley. 5. Traidia, A., Roger, F., and Guyot, E. Optimal parameters for pulsed gas tungsten arc welding in partially and fully penetrated weld pools. International Journal of Thermal Sciences 49: 1197–1208, 10. 6. Zacharia, T., Eraslan, A., Aidun, D., and David, S. 1989. Three-dimensional transient model for arc welding process. Metallurgical and Materials Transactions B 20B: 645–659. 7. Fan, H., Tsai, H., and Na, S. 2000. Heat transfer and fluid flow in a partially
JULY 2014 / WELDING JOURNAL 269-s
Final Bahrami Layout_Layout 1 6/13/14 10:37 AM Page 270
WELDING RESEARCH cal and Materials Transactions B 31: 1387– 1403. 14. Phanikumar, G., Chattopadhyay, K., and Dutta, P. 2001. Modelling of transport phenomena in laser welding of dissimilar metals. Int. Journal of Numerical Methods for Heat Fluid Flow 11: 156–171. 15. Chakraborty, N. 2009. The effects of turbulence on molten pool transport during melting and solidification processes in continuous conduction mode laser welding of copper-nickel dissimilar couple. Applied Thermal Engineering 29: 3618–3631. 16. Mukherjee, S., Chakraborty, S., Galun, R., Estrin, Y., and Manna, I. 2010. Transport phenomena in conduction mode laser beam welding of Fe-Al dissimilar couple with Ta diffusion barrier. International Journal of Heat and Mass Transfer 53: 5274–5282. 17. Hu, Y., He, X., Yu, G., Ge, Z., Zheng, C., and Ning, W. 2012. Heat and mass transfer in laser dissimilar welding of stainless steel and nickel. Applied Surface Science 258: 5914–5922. 18. Bahrami, A., and Aidun, D. K. 2013. Modeling of transport phenomena in dissimilar welding of 2205 duplex stainless
or fully penetrated weld pool in gas tungsten arc welding. International Journal of Heat and Mass Transfer 44: 417–428. 8. Zhang, W., Roy, G. G., Elmer, J. W., and DebRoy, T. 2003. Modeling of heat transfer and fluid flow during gas tungsten arc spot welding of low carbon steel. Journal of Applied Physics 93: 3022–3033. 9. Tanaka, M., and Lowke, J. J. 2007. Predictions of weld pool profiles using plasma physics. Journal of Physics D: Applied Physics 40: R1–R23. 10. Lu, F., Tang, X., Yu, H., and Yao, S. 2006. Numerical simulation on interaction between TIG welding arc and weld pool. Computational Materials Science 35: 458– 465. 11. Lu, F., Yao, S., Lou, S., and Li, Y. 2004. Modeling and finite element analysis on GTAW arc and weld pool. Computational Materials Science 29: 371–378. 12. Kim, W., and Na, S. 1998. Heat and fluid flow in pulsed current GTA weld pool. International Journal of Heat and Mass Transfer 41: 3213–3227. 13. Wei, P. S., and Chung, F. K. 2000. Unsteady Marangoni flow in a molten pool when welding dissimilar metals. Metallurgi-
steel to 1018 carbon steel. Trends in Welding Research 2012: Proc. of the 9th Int. Conference. ASM International, Chicago, Ill. 19. White, F. M. 1994. Fluid Mechanics, 3th ed. McGraw-Hill. 20. DuPont, J., Lippold, J., and Kiser, S. 2011. Welding Metallurgy and Weldability of Nickel-Base Alloys. Wiley. 21. Sahoo, P., DebRoy, T., and McNallan, M. 1988. Surface tension of binary metal — surface active solute systems under conditions relevant to welding metallurgy. Metallurgical and Materials Transactions B 19: 483–491. 22. McNallan, M., and DebRoy, T. 1991. Effect of temperature and composition on surface tension in Fe-Ni-Cr alloys containing sulfur. Metallurgical and Materials Transactions B 22: 557–560. 23. Incropera, F. P., DeWitt, D. P., Bergman, T. S., and Lavine, A. S. 2006. Fundamentals of Heat and Mass Transfer, 6th ed. Wiley. 24. Mills, K. C. 2002. Recommended Values of Thermophysical Properties for Selected Commercial Alloys. Cambridge, England: Woodhead Publishing.
CAN WE TALK? The Welding Journal staff encourages an exchange of ideas with you, our readers. If you’d like to ask a question, share an idea, or voice an opinion, you can call, write, e-mail or fax. Staff e-mail addresses are listed below, along with a guide to help you interact with the right person. Publisher Andrew Cullison
[email protected], Extension 249 Article Submissions Editor Mary Ruth Johnsen
[email protected], Extension 238 Feature Articles Associate Editor Howard Woodward
[email protected], Extension 244 Society News, Personnel Associate Editor Kristin Campbell
[email protected], Extension 257 New Products News of the Industry
Editorial Assistant/Peer Review Coordinator Melissa Gomez
[email protected], Extension 475 Peer Review, International News, and Product Literature
Advertising Sales & Promotion Coordinator Lea Paneca
[email protected], Extension 220 Production and Promotion
Managing Editor Zaida Chavez
[email protected], Extension 265 Design and Production
Advertising Sales Representative Sandra Jorgensen
[email protected], Extension 254 Advertising Sales
Senior Production Coordinator Brenda Flores
[email protected], Extension 330 Production
Advertising Production Manager Frank Wilson
[email protected], Extension 465 Advertising Production
Advertising Sales Director Rob Saltzstein
[email protected], Extension 243 Advertising Sales
270-s WELDING JOURNAL / JULY 2014 VOL. 93
Welding Journal Dept. 8669 NW 36th St. #130 Miami, FL 33166 (800) 443-9353 FAX (305) 443-7404