Journal of Geographic Information System, 2011, 3, 345-350 doi:10.4236/jgis.2011.34032 Published Online October 2011 (http://www.SciRP.org/journal/jgis)
Wetland Assessment and Monitoring Using Image Processing Techniques: A Case Study of Ranchi, India Meenu Rani1, Pavan Kumar2*, Manoj Yadav1, R. S. Hooda1 1
Haryana Space Applications Centre (Department of Science & Technology), Hisar, India 2 Department of Remote Sensing, Banasthali University, Rajasthan, India E-mail:
[email protected] Received May 17, 2011; revised July 2, 2011; accepted July 20, 2011
Abstract Wetlands, the transitional zones that occupy an intermediate position between dry land and open water, regulate the flow of water and nutrients, thereby facilitating optimum functioning of the physical and biological cycles of nature. To conserve and manage wetland resources, it is important to invent and monitor wetlands and their adjacent uplands. Wetlands are most productive ecosystems besides being a rich repository of biodiversity and are known to play a significant role in carbon sequestration. Wetlands are halfway world between terrestrial and aquatic ecosystem and share properties of both. Wetlands exhibit enormous diversity according to their genesis, geographical location, water regime, chemistry, dominant plants and soil or sediment characteristic. Wetland vegetation provides a natural barrier to fast moving water and therefore aids in flood speed reduction. Remote sensing offers a cost effective means for identifying and monitoring wetlands over a large area and at different moments of time. The present paper describes the methodology and results of wetland area for Ranchi city of Jharkhand state for the year 1996-2004.The signatures of wetlands and associated land features are identified in unsupervised classification approach based on their DN value using Satellite data. There are drastic change in between 1996 and 2004. The spatial distributions of the NDVI values were evaluated to determine the cut-off points for the water bodies, and wetted area. Keywords: NDVI, DN Value, Unsupervised Classification
1. Introduction Wetland assessment is the gathering and analysis of information needed for wetland conservation and management. Assessment criteria and procedure are critical because the outcome of wetland protection/destruction battles is increasingly determined by the information available to decision maker. India, by virtue of its geographical extent, varied terrain and climatic conditions, supports a rich diversity of inland and coastal wetland ecosystems. The wetlands in India are distributed in various ecological regions. Although the significance of wetlands has been known for a long time, their role in maintaining ecological balance is less understood. [1], LANDSAT imagery to map coastal water turbidity, whereas [2], estimated the concentration of suspended sediments through LANDSAT-MSS data. Remote sensing offers a cost effective means for delineating wetlands over a large area at different points of time and can provide useful information on wetland characteristics [3-6]. Copyright © 2011 SciRes.
Based on various remote sensing data types, many methods for delineating water bodies have been described [7]. Wetlands, particularly those in floodplains and in coastal areas, contribute to flood control by storing and decreasing the velocity of excess water during heavy rainfall. Wetland vegetation also provides a natural barrier to fast moving water and therefore aids in flood speed reduction. In the past, visual interpretations of wetlands from maps, aerial photography, and hard copy of satellite images have been used extensively [8,9]. Currently, also digital image processing is used [10].The most distinctive feature is the energy absorption at Near-IR wavelengths and beyond [11]. Characteristics like water quality, turbidity and chlorophyll contents can also be determined using optical remote sensing techniques but are more complicated to assess [12,13]. Wetlands have very fertile soils and though drainage of wetlands may not be without risks of producing acid soils. Large areas of wetland have been converted in the past for purpose of cultivation. The importance of these wetJGIS
M. RANI ET AL.
346
lands has long been recognized and here with also the need to conserve and protect these wetlands.
2. Methodology 2.1. Study Area
1.1. The Framework for Monitoring of Wetlands For devising a suitable wetland classification system it is essential that is should be simple, easy to replicate and incorporate all or most of wetland types. In India no suitable wetland classification existed for comprehensive inventory of wetlands in the country prior to the execution of Nation-wide Wetland mapping project based on satellite remote sensing by the Space Applications Center (SAC), Ahmedabad. The classification system is based on Ramsar Convention definition of wetlands, which provides a broad framework for delineating wetlands and is amenable to remote sensor data for inventory of wetlands. It considers all parts of a water mass including its ecotonal area as wetland. It addition, Ramsar convention, considers fish and shrimp ponds, saltpans, reservoirs, gravel pits etc. as wetlands. In the present wetland inventory, Modified National Wetland Classification system is used for wetland delineation and mapping. The classification system being used (Table 1) should be tested for its suitability for monitoring based on spectral classification and for use with imagery of different resolution. A number of classes represent inland wetlands, like lakes, Ox-Blow lakes, waterlogged, salt pans etc. and coastal wetlands, like lagoons, creeks, salt marsh and aquaculture ponds etc. This would imply that land cover history be recorded and that land cover actually needs to be mapped, this would imply a rather high level of spatial details.
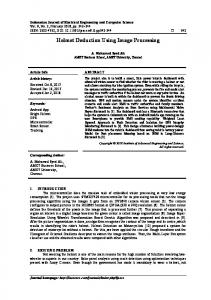
The area selected for carrying out the present research covers the Ranchi city, the capital of Jharkhand state, India and its environs, bounded by 85˚75' - 85˚87' East to 23˚21' - 23˚87' North (Figure 1). Ranchi is located on the southern part of the Chota Nagpur plateau which forms the eastern edge of the Deccan plateau. Ranchi is referred as the “City of Waterfalls”, due to the presence of numerous large and small falls around the close vicinity of the city. The Subarnarekha River and its tributaries constitute the local river system. The study area is characterized by sub-tropical climate. Temperature ranges from 20˚C to 37˚C during summer and 3˚C to 22˚C during winter. The rainfall pattern is monsoonal covering the period from middle of June to middle of October with an average annual rainfall of about 1530 mm. The major land cover types that dominate the area are viz. agricultural land, built-up land with and without vegetation, dense and open forest, dense shrub, plantation and water bodies comprising mainly reservoir, lakes, river and its tributaries and numerous ponds.There are three main wetlands in Ranchi i.e. Dhurwa dam, Getalsud reservoir and Kanke. Rapid population growth and industrialization have caused considerable change in the weather pattern and rise in average temperatures. This has resulted in gradual loss of this Hill Station.
2.2. Description of Satellite Data Satellite, sensor and acquisition dates for the data used during analysis are given in Table 2.
Table 1. Wetland covers classes as adopted by NBS. Wetland category
Class
Cover class Lakes
Natural Inland Wetlands
Man-made
Ox-Blow Lakes Waterlogged Reverine Wetlands River/Stream Reservoirs/Barrages Tanks/Ponds Waterlogged Salt pans Lagoons Creeks
Natural Coastal Wetlands
Sand Beach Salt Marsh Mangroves Coral Reefs
Man-made
Salt pans Aquaculture Ponds
Copyright © 2011 SciRes.
2.3. Data Collection and Analysis The spatial data consisting of Survey of India toposheet and satellite imagery were used after pre-processing. Various digital image-processing techniques to obtain valuable information related to study and also to identify the classes and feature. Using ERDAS EMAGINE 9.1 software, the data was loaded in the computer. Radiometric and stretch correction was applied for removing radiometric defects and improving the visual impact of Table 2. Description of satellite data used data. Particulates Satellite Sensor Band combination Swath Spatial Resolution Year
IRS 1C LISS III 3,2,1 141 km. 23.5m 1996 and 2004
JGIS
M. RANI ET AL.
347
Figure 1. Location map of study area.
the False Color Composite (FCC) made up of the variance within individual strata and of variance within the strata. Geometric rectification of the data was carried out with the help of Survey of India (SOI) toposheet for assigning geographical coordinates to keep pixel of the image. Supervised classification is a method in which the analyst defines small areas, called training sites, on the image which are representative of each desired land cover category. In the present study, IRS LISS-III satellite data has been digitally interpreted and classified in land use and land cover classification and wetland mapping has been done using image processing technique, viz, unsupervised classification and NDVI. In this classification system of land use/land cover different categories have been taken, because Remote Sensing and Geographical Information System (GIS) techniques give us broad tool for better identification. The classes which I have identified are forest, Agriculture land, Fallow land, Drainage, Water bodies and Settlement. The three images of August 1996 (dry period), December 2004 (wet period) were used from which each frequency distribution of the DNs were derived. There were clear distinctions between the water bodies and wet areas (lower DN) against the dry areas (higher DN). Thresholds were obtained for each of the periods Copyright © 2011 SciRes.
examined.
3. Result and Discussion Land use/land cover classification was done on the basis of spectral signatures. Five main classes were identified elaborated in Table 3 and shown in Figure 2.
3.1. Land Use and Cover Type Classification According to the land use/cover map (Figure 2), agricultural area is predominantly covered by forest and fallow land of the study area where human activities are relatively less intense. Fallow land is commonly associated with settlement, while crop land is scattered around the build-up land (Table 3).
3.2. Wetland Classification In the present study we used remote sensing based approach to observe changes in flow resistance in wetlands marshes using a remote sensing approach. The developed methodology was applied for estimation of the decrease or increase of the wetland in the Ranchi city. The obtained value of NDVI of the study area ranges form –1 to +1. Wetlands with Fresh water have NDVI value at zero JGIS
348
M. RANI ET AL.
Land Use and Land Cover Map
Figure 2. Land use / Land cover map of Ranchi city.
or nearby. On the basis of NDVI values and visual interpretation three wetland classes have been differentiate in the study area. There was large area covered by Dhurwa dam, Getalsud reservoir and kanke dam in 1996 i.e. 474, 1579.44, 112.30 fallowed by 366, 1392.38 and 108.49 in 2004. There are drastic change in between 1996 and 2004. Maximum % changes occur in Dhurwa dam follow by Getalsud reservoir i.e. 22.78% and 11.84%. Very less
Copyright © 2011 SciRes.
change occurs in Kanke dam (Figures 3-8) and (Table 4). The spatial distributions of the NDVI values were evaluated to determine the cut-off points for the water bodies, and wetted area. Thresholds of the water indices were in most cases easier to be sliced. Thresholds used to delimit the two cover classes for each of the acquisition dates are summarized. (Table 5). A 3*3 filter was then used to integrate the pixels with a large number of small
JGIS
M. RANI ET AL.
Figure 3. Dhurwa dam (2004).
Figure 4. Dhurwa dam (1996).
Figure 5. Getalsud reservoir (2004). Copyright © 2011 SciRes.
349
Figure 6. Getalsud Reservoir (1996).
Figure 7. Kanke dam (2004).
Figure 8. Kanke Dam (1996). JGIS
M. RANI ET AL.
350
Table 3. Calculated areas with LULC classes (2004). Features Water bodies Forest Built-up land Agricultural area Fallow land
Area (ha.) 5363.29 21269.89 10041.49 24620.44 3826.76
[4]
M. Salvia, H. Karszenbaum, F. Grings and P. Kandus, “Datos Satelitales Ópticos y de Radar Para el Maelmapeo de Ambientes en Macrosistemas de Humedal,” Rev. Teledetec, Vol. 31, 2009, pp. 35-51.
[5]
RAMSAR Convention, “Secretariat. Water-Related Guidance: An Integrated Framework for the Convention’s Water-Related Guidance,” Ramsar Handbooks for the Wise Use of Wetlands, 3rd Edition, Ramsar Convention Secretariat, Gland, 2002.
[6]
M. T. Coe, “Modeling Terrestrial Hydrological Systems at the Continental Scale: Testing the Accuracy of an Atmospheric,” Journal of Climate, Vol. 13, No. 4, 2000, pp. 686-704. doi:10.1175/1520-0442(2000)0132.0. CO;2
[7]
F. Grings, P. Ferrazzoli, H. Karszenbaum, M. Salvia, P. Kandus, J. C. Jacobo-Berlles and P. Perna, “Model Investigation about the Potential of C Band SAR in Herbaceous Wetlands Flood Monitoring,” International Journal of Remote Sensing, Vol. 29, No. 17-18, 2008, pp. 5361-5372. doi:10.1080/01431160802036409
[8]
S. L. Ozesmi and M. E. Bauer, “Satellite Remote Sensing of Wetlands,” Wetlands Ecology and Management, Vol. 10, No. 5, 2002, pp. 381-402. doi:10.1023/A:1020908432489
[9]
T. M. Lillesand, W.R. Kieffer and J.W. Chipman, “Remote Sensing and Image Interpretation,” 5th Edition, John Wiley & Sons Inc., New York, 2004, p. 763.
Table 4. Wetland classified area. Category Dhurwa Dam Getalsud Reservoir Kanke Dam
Area(ha) 1996 2004 474 366 1579.44 1392.38 112.30 108.49
% Change -22.78 -11.84 -3.39
Table 5. DN value of two acquisition dates. Type\Year Dhurwa dam Getalsud reservoir Kanke dam
Aug, 1996 (DN)
Dec, 2004 (DN)
Water
Wet area
Water
Wet area
22
66
21
68
28
61
25
63
20
68
23
61
scattered, areas to calculate DN value.
4. Acknowledgements We are thankful to HARSAC, Hisar, Haryana, India for providing necessary support.
5. References [1]
L. T. Lindell, O. M. Steinvall, Johnson and T. H. Classon, “Mapping of Coastal Water Turbidity Using Landsat Imagery,” International Journal of Remote Sensing, Vol. 6, No. 5, 1995, pp. 629-642.
[2]
J. C. Ritchie and C. M. Cooper, “Suspended Sediment Concentration Estimated from Landsat MSS Data,” International Journal of Remote Sensing, Vol. 9, 1988, pp. 379-387.
[3]
E. Kasischke, J. Melack and M. Dobson, “The Use of Imaging Radars for Ecological Applications—A Review,” Remote Sensing of Environment, Vol. 59, No. 2, 1997, pp. 141-156. doi:10.1016/S0034-4257(96)00148-4
Copyright © 2011 SciRes.
[10] C. Baker, R. Lawrence, C. Montagne and D. Patten, “Mapping Wetlands and Riparian Areas Using Landsat ETM+ Imagery and Decision-Tree-Based Models,” Wetlands, Vol. 26, No. 2, 2006, pp. 465-474. doi:10.1672/0277-5212(2006)26[465:MWARAU]2.0.CO ;2 [11] ESA, ASAR Handbook, 2008. http://envisat.esa.int/handbooks/asar/ [12] D. Vecchia, A. P. Ferrazzoli, L. Guerriero, X. Blaes, P. Defourny, L. Dente, F. Mattia, G. Satalino, T. Strozzi and U. Wegmuller, “Influence of Geometrical Factors on Crop Backscattering at C-Band,” IEEE Transactions onGeoscience and Remote Sensing, Vol. 44, No. 4, 2006, pp. 778-790. doi:10.1109/TGRS.2005.860489 [13] M. Bracaglia, P. Ferrazzoli, L. Guerriero, “A Fully Polarimetric Multiple Scattering Model for Crops,” Remote Sensing of Environment, Vol. 54, No. 3, 1995, pp. 170-179. doi:10.1016/0034-4257(95)00151-4
JGIS