Missing:
Western Economics Forum, Fall 2012
What can a comprehensive plan really tell us about a region?: A cluster analysis of county comprehensive plans in Idaho Nicholas S. Brown1 and Phil Watson2 Introduction Comprehensive plans are used by communities and regions to set goals and guidelines for future growth and development. Comprehensive plans are developed by regions to “advance the welfare of the people” and foster the creation of “better social, economic, and physical environments” (Bammi and Bammi 1979). These plans are intended to represent the priorities of the community and direct how future development should occur. They generally require public participation in the decision-making process and are often required by funding agencies. While comprehensive plans are not regulatory themselves, policy makers and managers generally cite how a proposed management action corresponds to the region’s comprehensive plan and comprehensive plans are increasingly being used to provide legitimacy to management actions (Sullivan 2004). Comprehensive plans can be done by any size community but are found regularly at the city and county level. As each community produces its own comprehensive plan, there is variation of plan emphasis, quality, and elements of uniqueness reflective of each community. Some attempts at standardization have been done either through state mandates or model sections created by advocacy groups, however, differences remain which makes comparing and contrasting plans difficult. Questions remain, then, as to how much heterogeneity exists in regional comprehensive plans and whether comprehensive plans really do reflect variation across regions. This study attempts to deal with differences in plans in order to see if the content of the plans are reflective of independent traits of the county. It does this by looking solely at the content of county comprehensive plan objectives in order to determine the priorities of the counties. It is hypothesized that the objectives enumerated in the comprehensive plans will indicate broader county goals, priorities, and desired outcomes for the locality and the region, which will be seen in the independent traits of the community. This is done by rating objectives in eight required sections of comprehensive plans in the state of Idaho. A cluster analysis is then performed to create four groups of counties in order to compare the comprehensive plan objectives of these counties to other independent traits. This method, using Idaho as an example, shows that different types of counties do cluster with comprehensive plan traits and while no causality can be established here, this correlative information could possibly be used for improving future planning efforts.
1
Fiscal Analyst, Legislative Fiscal Division, State of Montana Assistant Professor, Department of Agricultural Economics and Rural Sociology and the Bioregional Planning Graduate Program, University of Idaho 2
22
Western Economics Forum, Fall 2012
Review of Prior Literature Previous research has attempted to create comparison criteria for comprehensive plans for the purposes of improved evaluation. For example, Baer (1997) created a list of criteria to evaluate plans along with a categorization for types and timing of evaluation. Grimes, in an evaluation for the Virginia Transportation Research Council, identified objectives by evaluation inventory, assessments, and recommendations in plans in Virginia (Grimes 2006). Berke and Manta (2009) used a process of looking at objectives of plans in terms of recommended versus required for 30 comprehensive plans by grouping words in the policies such as encourage, consider, or should, versus words such as shall, will, or require (Berke and Manta 2000). Evans-Cowley and Gough took this and incorporated a third rating in an evaluation of New Urbanist plans in post-Katrina Mississippi. Here they used a 0, 1, and 2 rating, an element received a 0 if it was not present, a 1 if it was present but only recommended, and a 2 if it was required (Evans-Cowley and Gough 2009). A combination of these methods was used, detailed in the methodology section, in order to place numerical values to comprehensive plan objectives for use in a cluster analysis. Cluster analysis is a common technique in data analysis. It was first described in land use analysis in the 1970’s, although not recommended as the computing power at that time was not adequate (Hopkins 1977). More recently, cluster analyses have been used for varied projects such as finding areas for reinvestment in Philadelphia (Schamess 2006), and finding clusters of different groups of people based on health in two metropolitan areas (Rovniak et al. 2010). One of the most applicable studies using cluster analysis for this evaluation is from the Brookings Institution. Here they used a set of twelve content areas with differing criteria to create clusters based on land use regulations of 50 metropolitan areas around the country (Pendall, Puentes, and Martin 2006).
Methodology Endogenous Variables Comprehensive plans are most commonly organized into broadly defined sections dealing with topics such as land use, property rights, and economic development. This commonality creates a good starting point when comparing multiple plans. In Idaho’s case, Chapter 65 of the Local Land Use Act within Title 67 of the Idaho code specifies 14 required sections in comprehensive plans (Table 1). These required elements provide both a simple and less subjective way to categorize objectives. However, for the sake of brevity and because some sections do not lend themselves well to the scoring process, only eight of the mandated 14 sections were used in this study (Table 1). For example, because regulating population dynamics can easily create legal problems, population sections tended to be more uniform across counties.
23
Western Economics Forum, Fall 2012
Table 1: Comprehensive plan sections mandated for inclusion by Idaho State Code Required Element
Evaluated in this Study
Property Rights
Yes
Population
No
School Facilities and Transportation
No
Economic Development
Yes
Land Use
Yes
Natural Resources
Yes
Hazardous Areas
No
Public Services, Facilities, and Utilities
Yes
Transportation
Yes
Recreation
No
Special Areas or Sites
No
Housing
Yes
Community Design
Yes
Implementation
No
Once the sections from the state requirements were chosen, a dichotomous metric within each of these sections was established so that each objective within the section would fall into one of two categories. A more detailed description of this process is provided in Appendix 1. The comprehensive plan sections and their dichotomous categories evaluated in this study are Private Property (“explicit protection” versus “placing restrictions”), Economic Development (“actively pursuing” versus “responding to”), Land Use (“protection of existing” versus “preparing for growth”), Natural Resources (“promote traditional economic use” versus “conservation”), Public Services (“county responsibility” versus “other’s responsibility”), Transportation (“nonroad” versus “road”), Housing (“county responsibility” versus “other’s responsibility”), and Community Design (“county responsibility” versus “other’s responsibility”).
24
Western Economics Forum, Fall 2012 Once the dichotomous categories for each section were established, each objective was evaluated accordingly. If the objective was soft in language using words like should, encourage, or suggest, the objective was given a score of 1 in the given category. If the language in the objective was firm such as ‘requiring’, ‘will’, or ‘must’, then the objective was given a score of 2, this methodology is supported by previous work (Grimes 2006). The final scoring for both categories in each of the eight sections was first calculated by taking the mean of all the scored objectives in a category, then multiplying that by the percentage of objectives in that category versus the opposite category in the same section, creating a weighted mean. Thus a given category could receive a score between zero, if it was not addressed at all, and 2 if it was addressed with firm language and the county gave no emphasis to the competing category. The weighted mean solved the problem of a county appearing to have similar emphasis in the two categories of a given section when one of the two categories had many more objectives devoted to it. There are notably several counties missing from the analysis. They were omitted either because they lack a comprehensive plan, their comprehensive plan was not available at the time of analysis, or the comprehensive plan was produced before the creation of state guidelines. Of the 44 counties in Idaho, nine were omitted from this analysis due to the criteria above. Clustering Once the scores for both categories in the eight sections were established, a k-means cluster analysis was performed to group similar counties based solely on the elements in their comprehensive plan. Clusters are a mathematical way of organizing data based on an algorithm that creates groups in which data most closely resemble other data in that group and establishes differences from other groups. Cluster analysis organizes observations into clusters so that the similarity of characteristics within each cluster is maximized, while maximizing differences between clusters (Xu and Wunsch 2009, Aldenderfer and Blashfield 1984). Cluster analysis uses multiple variables to determine the characteristics that differentiate those clusters and which observations belong in which cluster. In k-means cluster analysis, the similarity or dissimilarity of sets of data is determined by Euclidean distance from the cluster centroid (Xu and Wunsch 2009). Clusters were created based on the scored elements of the comprehensive plans (endogenous variables) as described above. A common “rule of thumb” (Aldenderfer and Blashfield 1984) for determining how many clusters to include in a k-means cluster analysis is:
𝑘𝑘 =
𝑛𝑛 2
Where k is the number of clusters in the data and n is the number of observations. Under this criterion our data contain four unique clusters. Exogenous Variables In addition to these endogenous characteristics of the comprehensive plans themselves, demographic, geographic, and economic data were also collected and analyzed in relation to the comprehensive plan based clusters. This combination of information provides potential
25
Western Economics Forum, Fall 2012 insights into the relationship between what the counties prioritize in their comprehensive plans and the characteristics of the respective county clusters. The exogenous variables represent given characteristics of the counties that are not directly related to the comprehensive plans. Thirteen exogenous variables were chosen to produce a description about the four clusters. These variables were chosen based on the availability and reliability of the data sources as well as their combined ability to produce a picture of the type of county they collectively describe. Exogenous variables used in this study are presented in Table 2. Table 2: Average values of descriptive variables for counties in their respective clusters. These variables were not used in the cluster analysis.
Population, 2000 Census Median Household Income, 2008 Age of Comp. Plan, Years Population Change, 20002009 Home Ownership Rate, 2000 Urban/Rural Continuum Code (Higher= More Rural)
Cluster 1 Mean
% of Total Mean
Cluster 2 Mean
% of Total Mean
Cluster 3 Mean
% of Total Mean
Cluster 4 Mean
% of Total Mean
Mean Across All Analyzed Counties
19,942
61.98%
60,046
186.63%
13,582
42.21%
29,753
92.48%
32,174
$42,516
96.17%
$47,572
107.61%
$41,019
92.79%
$45,200
102.25%
$44,207
6.4
112.28%
6.3
110.53%
2.2
38.60%
5.8
101.75%
5.7
6.20%
60.78%
19.50%
191.18%
5.90%
57.84%
7.50%
73.53%
10.20%
76.40%
102.25%
73.80%
98.77%
74.10%
99.17%
72.80%
97.43%
74.72%
6.14
112.45%
4.70
86.08%
5.60
102.56%
5.00
91.58%
5.46
4.29
98.85%
4.20
96.77%
4.40
101.38%
4.67
107.60%
4.34
Natural Amenity Index (Higher= More Natural Amenities) Creative Class Score % Voted for Obama, 2008
0.154
89.53%
0.189
109.88%
0.175
101.74%
0.182
105.81%
0.172
26.70%
86.69%
32.70%
106.17%
32.80%
106.49%
35.50%
115.26%
30.80%
Unemployment Rate, March 2010
11.64%
103.65%
10%
89.05%
11.30%
100.62%
12.20%
108.64%
11.23%
8.40%
49.12%
33%
192.98%
8.50%
49.71%
18%
105.26%
17.10%
17.20%
91.49%
19.10%
101.60%
22.40%
119.15%
19.30%
102.66%
18.80%
0.42
100.72%
0.41
98.09%
0.43
102.63%
0.41
99.04%
0.42
% Change in Private Nonfarm Employment, 2000-2008 % with Bachelor's Degree or Higher Gini Coefficient (Measure of Income Inequality)
26
Western Economics Forum, Fall 2012 Basic demographic data, including population and population change between 2000 and 2009, were obtained for each respective county. A variety of economic indicators were used including homeownership rate, median household income, the unemployment rate, and the percent change in private non-farm employment between 2000 and 2008. The 2000-2008employment change was included to help define the counties without the 2008 market collapse. The age of the plan was included to explore the possibility of newer plans containing objectives that represent changing approaches in the planning field. The education rate of a county, defined as those with a bachelor’s degree or higher, as well as the percentage of people in the county who voted for the Democratic presidential candidate in the 2008 election as a representation of the political climate, were also used. Several metrics were included that were based on outside research, these were the UrbanRural Continuum, the Amenity Index, the Creative Class Index, and the Gini coefficient. The Urban-Rural Continuum is a measure of the rural-ness or urban-ness of a county from the Economic Research Service (USDA ERS 2003). The Amenity Index is a measure of the level of natural amenities within a county on a scale of 1 to 7 (USDA ERS 1999). This in many ways represents the natural beauty of an area, as a higher natural amenity score is awarded for features such as mountains, coastline, and number of days of sunshine. The Creative Class Index is a measure of how much of the working population is involved in creative industries; it is based on work by Richard Florida, who asserts that the creative class is important to the growth of an area (Wojan, Lambert, and McGranahan 2007). The last variable is the Gini coefficient which gives a measure of income inequality (Ray 1998). The clusters created from the objectives in the comprehensive plans were compared against each of these exogenous variables to create a story about the counties’ characteristics and priorities.
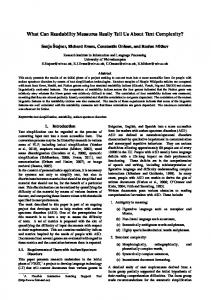
Results and Discussion A graphical depiction of the results of the cluster analysis is presented in Figure 1 and tables of the exogenous and endogenous variables are summarized in Tables 2 and 3, respectively. The composition of the clusters and the resulting traits can tell an interesting story. From the exogenous variables we can get almost a personality of the clusters; the rural nature of a cluster, the general education level how much employment has grown. Then, comparing that against the trends in the cluster’s comprehensive plans we can see what types of priorities different groups of counties have in comparison to their traits. In many ways the objectives line up well with conventional thinking about the different types of counties, there are, however, exceptions.
27
Western Economics Forum, Fall 2012
Figure 1: Map of Idaho with comprehensive plan based cluster groups
28
Western Economics Forum, Fall 2012
Table 3 - Means of comprehensive plan scores used in cluster analysis Cluster 4 Mean
% of Total Mean
Mean Across All Counties
Traditional Economic Use
0.61
161.58%
0.288
75.79%
0.10
27.11%
0.22
57.11%
0.380
Conservation
0.63
80.43%
0.885
112.45%
0.73
92.50%
1.03
131.39%
0.787
Explicit Protection Placing Restrictions
1.12
200.36%
0.16
28.14%
0.00
0.00%
0.39
69.00%
0.56
0.05
21.50%
0.04
20.09%
0.00
0.00%
1.07
500.47%
0.214
Protection of Existing
0.74
140.42%
0.52
98.10%
0.19
36.43%
0.33
62.24%
0.527
Preparing for Growth
0.51
85.62%
0.66
110.87%
0.45
75.92%
0.81
136.12%
0.598
Actively Pursuing
0.85
122.35%
0.63
89.83%
0.20
28.65%
0.87
124.21%
0.698
Responding to
0.33
85.23%
0.33
85.23%
0.65
168.39%
0.29
75.91%
0.386
0.68
105.14%
0.81
125.70%
0.20
30.37%
0.66
102.80%
0.642
0.50
79.46%
0.38
60.35%
1.42
224.80%
0.70
110.27%
0.633
0.28
95.49%
0.30
104.51%
0.33
114.24%
0.26
91.32%
0.288
0.85
125.67%
0.41
60.24%
0.63
93.18%
0.76
112.46%
0.674
County Responsibility
0.81
100.00%
0.89
109.62%
0.65
80.02%
0.81
100.25%
0.811
Other's Responsibility
0.32
92.53%
0.25
70.40%
0.56
162.07%
0.40
114.94%
0.348
Non-road
0.17
40.92%
0.63
152.78%
0.65
156.17%
0.43
103.15%
0.413
Road
1.22
131.61%
0.67
72.06%
0.72
77.89%
0.85
91.37%
0.927
Transportation
Housing
Community Design
Public Services
Economic Development
Natural Resources
Cluster 3 Mean
% of Total Mean
Property Rights
Cluster 2 Mean
% of Total Mean
Land Use
Cluster 1 Mean
% of Total Mean
County Responsibility Other's Responsibility County Responsibility Other's Responsibility
29
Western Economics Forum, Fall 2012 Cluster 1 (The Traditionalists) The comprehensive plans from counties in Cluster 1 placed a large emphasis on protecting the traditional economic uses of natural resources. Cluster 1’s emphasis on protecting traditional economic uses of land was 62% above the full sample mean; the only cluster well above the sample mean on this measure. In contrast, they were also the least likely (20% below sample mean) to place emphasis on conservation of natural resources. Cluster 1 was also by far the most likely to explicitly protect property rights and among the least likely to place restrictions on property rights. This cluster was twice as likely to explicitly protect property rights, and had almost no objectives targeted at placing restrictions on property rights. Similarly in their land use sections, they were 40% above the sample mean in their emphasis on protecting existing land use rights while being 14% below the state mean on using land use objectives to prepare for growth. This was the only cluster that was above the state mean for protecting existing land uses. This cluster’s counties took the position of actively pursuing economic development, 22% above the sample mean, as opposed to preparing to respond to it, scoring 15% below the mean. On transportation networks, this cluster is clearly set on road emphasis. They have almost nothing to say on non-road transportation objectives, being 59% below the mean, while being 32% above the sample mean on road objective’s emphasis, not surprising in a rural area where low population densities make transit difficult. In the category of community design, cluster 1 counties place 26% more emphasis on objectives for third party responsibility and place 5% less on county responsibility. While the county responsibility difference is fairly small, the third party emphasis is the highest among all clusters. Despite not being part of the cluster analysis, the exogenous variable show marked differences across the clusters. Cluster 1 counties are primarily the rural counties in the state without the recreational emphasis of having large ski resorts. They have low populations, being 38% below the mean of all the counties in the analysis. The median household income is relatively close to the sample mean at 4% under. In addition to low population totals, Cluster 1 counties are also not growing quickly. The 2000 to 2009 population change was 6.2% which is 39% below the sample mean growth rate. These counties are 12% more rural (higher score on the urban/rural continuum) and as such they exhibit some of the other fairly typical traits of rural areas. The creative class index, for example, is lowest in these counties at 10% below the mean. Growth in employment in the nonrecession years of the last decade, 2000-2008, was 51% below the sample mean. Cluster 1 is the only cluster below the sample mean, 8% below the mean for this variable. These counties were 13% less likely to have voted for Obama in 2008, the only cluster less likely, than the sample mean. The “traditionalists” of Cluster 1 are the rural counties in the state, and share many of the characteristics of rural counties across the nation. Their objectives focus on improving roads, protecting existing land uses, protecting property rights, and actively pursuing economic development opportunities. They balance objectives regarding county and third party responsibility fairly well with the exception of community development; in that section they placed the majority of the emphasis on third parties.
30
Western Economics Forum, Fall 2012 Cluster 2 (Proactive Counties) Cluster 2’s comprehensive plans have very few objectives that address actions on property rights, whether explicit protection, or placing restrictions. They are below the sample mean on both property right elements. Cluster 2 is also below the mean, yet fairly balanced, on economic development elements in their comprehensive plans. However, cluster 2 comprehensive plans are significantly above the mean in terms of county responsibility in providing public services, and in their emphasis on non-road transportation. This cluster was also above the mean in emphasizing community responsibility in both community design and housing, and is the only cluster that is consistently above the mean on making these objectives the county’s responsibility and below the mean on making third parties responsible. In terms of the exogenous variables, this cluster of counties are the growing urban counties that include Ada County, which is by far the most populated county in the state and is home to Idaho’s largest city, Boise, and other highly populated counties such as Kootenai County (includes the city of Coeur d’Alene) and Twin Falls County (includes the city of Twin Falls). This cluster also includes some of the high recreation counties including Teton and Shoshone. Population of these counties is far and away the highest of any cluster at 87% above the mean. This is also represented in the urban/rural continuum with Cluster 2 being the most urban on the continuum. They also have the highest median household income at 8% higher than the sample mean. Given the differences in counties that make up these clusters, specifically in this cluster the high recreation counties with the urban counties, an additional regression analysis would be a nice additional step, but that is beyond the scope of this paper. Cluster 2 counties also showed the highest level of population growth, with population growth from 2000 to 2009 being 91% above the sample mean. The urbanite counties also had the highest growth in private nonfarm employment over the last decade, 93% above the state mean. This coincides with their current lowest unemployment, 11% below the sample mean, the only cluster with a below average unemployment rate. In keeping with what would be expected for more urban regions, this cluster had the highest creative class index in the state, 10% above the mean. Interestingly, this cluster had the lowest natural amenity index, although that is only 3% below the sample mean. These counties are the highest income counties, lead the state in population growth, and have had the best growth in employment over the last decade. All of this is fairly consistent with urban areas. While the urbanite counties had fairly balanced approaches to most of their sections, it is interesting to note that in the sections looking at county responsibility and third party responsibility for given objectives, these counties consistently pushed towards county responsibility. This emphasis on county responsibility suggests that these counties may be more willing to invest in themselves. Cluster 3 (Passive Counties) In many ways, cluster 3 is the inverse of cluster 2. Cluster 3 counties also did not address property rights, neither placing restrictions on them nor giving them explicit protection. This cluster was also below the mean in statements regarding either conservation or traditional economic use of natural resources. Land use is another area where these counties are much below the mean, 74% and 24% below state averages respectively on objectives that protect existing land use and land use objectives that actively prepare for economic growth. These counties are also below the mean on objectives for active pursuit of economic development. However, they score above average (68% above the sample the mean) in elements which
31
Western Economics Forum, Fall 2012 respond to economic development. In transportation Cluster 3 is very similar to Cluster 2 being 56% above the mean on non-road objectives and 22% below the mean on strictly road objectives. This cluster takes a fairly laissez-faire approach to the provision of public services. Cluster 3 is 70% below the mean on elements which make the provision of public services a county responsibility and are 125% above the mean on elements which enumerate third party responsibility for public services. A similar situation is seen in the housing section where cluster 3 is 20% below the mean for county responsibility and 62% above the mean for third party responsibility. However, Cluster 3 had the largest emphasis of any cluster on county responsibility for community design at 14% above the mean and was 7% below the mean on third party responsibility for community design. The counties in Cluster 3 tended to be the smallest counties in the sample, having the lowest average population of all the clusters. Cluster 3 is 58% below the state mean for population. It is also slightly below average in income, at 7% below the sample mean, and is a low population growth cluster at 42% below the mean. Similar to cluster 1, cluster 3 experienced much below average job growth from 2000-2008, at 50% below the sample mean. Cluster 3 had, on average, the most current comprehensive plans in the sample. The comprehensive plans across the entire sample (all clusters) range from one to ten years since updating, and the age of the plans is fairly scattered throughout the clusters. The exception is cluster 3 where all the comprehensive plans were only one, two, or three years old representing a cluster mean 61% below the mean across the entire sample. This indicates that the counties with the smallest population in this study also had the newest comprehensive plans. What distinguishes the “passive counties” of Cluster 3 is their relative lack of required elements in their comprehensive plans. When they do enumerate a requirement it is most often a requirement that a party other than the county be responsible for that respective element. Cluster 3 counties are low population, low population growth, primarily low income, and low employment growth. Additionally, their plans say very little about economic use of natural resources, property rights, or protection of existing land uses. These counties are also pushing for more multi-modal transportation options, being more passive in economic development, and placing responsibility for community development with the counties. This all suggests a desire to adapt to changes in land use and economic environments. Cluster 4 (The Conservationists) Counties in Cluster 4 place high emphasis on conservation of natural resources. They are 43% below the mean on objectives relating to traditional economic use of natural resources, while being 31% above on conservation of natural resources, the highest of any cluster. They were also low on explicit protection of property rights, 31% below the mean, although they did address this issue. Conversely, they were 400% above the mean on placing restrictions on property rights, by far the highest. Similarly to the property rights section these counties placed less emphasis on protection of existing land use in their objectives, 38% below the mean, and were the highest with using their objectives to prepare for growth, 36% above the mean. In the economic development section, Cluster 4 counties were heavily tilted toward actively pursuing economic development at 24% above the mean, over responding to it, where they were 24% below the mean.
32
Western Economics Forum, Fall 2012 For county responsibility and third party responsibility in public services, community design and housing, Cluster 4 is just about average in every category. These counties are also quite average on transportation, being closer to the mean on both road and non-road objectives than any other Cluster. In terms of exogenous variables, the counties in cluster 4 are the closest to the mean in terms of population size, income, home ownership, educational attainment, and income inequality. They were also the closest to the sample mean for population growth even though they are 26% below the state mean growth rate, indicating there was a great deal of variation in this variable. The differences for Cluster 4 arise in three areas. First they have the highest Amenity Index, 8% above the state mean, and while there is not a great amount of variability here, it is twice as far away from the mean as the next furthest cluster. Second, these counties voted for Mr. Obama, a proxy for political leaning, at a greater rate (15% above the sample mean) than any of the other clusters. Finally, these clusters have the highest unemployment rate (9% above the sample mean), due in part to the housing boom and bust in high amenity areas. “The Conservationists” are average in income, population, and population growth. But they are also attractive (high on the Amenity Index), voted more for Mr. Obama in the 2008 presidential election, and have a higher than average creative class. This gives us a profile of these counties that are average in many ways but have some reliance on tourism. Based on this there are certain features within the comprehensive plans that one would expect to see, and that play out well. Emphasis on conservation of natural resources, high emphasis on restrictions on property rights, and on preparing for growth in their land use are all expected in areas that have likely been experiencing high development pressure.
Conclusions This analysis shows that there are some distinctions in the way counties with differing characteristics place emphasis within their comprehensive plans. It establishes a relationship between counties with separate clustered priorities, as defined by their objectives, and those clusters differing exogenous characteristics. It does not prove any sort of causation, but these correlations could be used as a good starting point to begin looking for causality. For example, “does investment in community design contribute to the differences in per capita income within a county?”; or “does higher per capita income result in more demand for community design?”. While causality cannot be established between the similarities in the comprehensive plans and the demographic and economic characteristics of the counties, a crucial purpose of the comprehensive plan is for a community to identify where it wants to go. Whether it be a proactive vision of the future or simply identify the status quo as a priority, a community identifies its identity and goals though the comprehensive plan. As can be seen by our results, counties with similar interests (objectives in their comprehensive plans) have many other similarities; this is at least suggestive that comprehensive plans are fulfilling their objective of representing their specific communities. While these results might suggest this linkage, comprehensive plans and in a larger context local government, is only one of a myriad of factors that produce the characteristics of a county. Nonetheless, the suggestive results here could offer insights to counties looking for model comprehensive plans when their rewrite cycle comes around. Offering a list of counties that may seem very different, but have some underlying similarities and similarities in comprehensive plans, could allow a rewriting county to choose among other model compressive
33
Western Economics Forum, Fall 2012 plans. This would allow them to find example counties that may have similar strengths, but be in a more desirable position economically and/or demographically. Beyond using this information to create a hypothesis for future research, much of this information could be useful for individual counties. As counties grow and develop, the assumptions upon which their comprehensive plans also change. Examining plans of counties which are already facing situations that your respective county is anticipating gives insights into how to amend your comprehensive plan for your future community needs. It is all too often the case that communities necessarily develop comprehensive plans based on current conditions rather than developing plans for desired conditions. It is often the case that communities eschew changing planning efforts until the absolutely and obviously necessary. Unfortunately, when the need is obvious, the opportunity to implement effective change has already passed. It is hoped that, by looking at the comprehensive plans of regions with characteristics similar to the desired future conditions of their own community, communities can use this information to help establish a unique vision while benefiting from the experiences of other communities Likewise, if a county likes the outcomes of a different cluster in regard to a certain section, they could look at the ways these counties write their objectives and adjust theirs accordingly. This could also be scaled up to rewrite whole plans. If one type of plan consistently is associated with more positive county attributes this could even be used to start giving a metric to what actually makes a good plan, which has been a somewhat elusive goal in the field of planning.
References Ada, County. 2007. “Ada County Comprehensive Plan.” Benewah, County. 2003. “Benewah County Comprehensive Plan.” Berke, Philip, and Maria Manta. 2000. “Are We Planning for Sustainable Development? An Evaluation of 30 Comprehensive Plans.” Journal of the American Planning Association 66 (1). Bingham, County. 2005. “Bingham County Comprehensive Plan.” Bureau of Labor Statistics. 2011. “Tables and Maps Created by BLS.” Accessed May 10. http://www.bls.gov/lau/tables.htm. Camas, County. 2006. “Camas County Comprehensive Plan.” Caribou, County. 2006. “2006 Comprehensive Plan Caribou County Idaho.” Elmore, County. 2004. “2004 Comprehensive Growth and Development Plan.” Evans-Cowley, Jennifer, and Meghan Zimmerman Gough. 2009. “Evaluation New Urbanist Plans in Post-Katrina Mississippi.” Journal of Urban Design 14 (4) (November): 439– 461. Grimes, Matthew. “Virgina Transportation Research Council Research Report: An Evaluation of County Comprehensive Plans in Virginia.” http:/www.virginiadot.org/vtrc/main/online_reports/pdf/07-r6.pdf. Hopkins, Lewis D. 1977. “Methods for Generating Land Suitability Maps: A Comparative Evaluation.” Journal of the American Institute of Planners 43 (4): 386–400. doi:10.1080/01944367708977903. Jefferson, County. 2005. “Jefferson County Comprehensive Plan.”
34
Western Economics Forum, Fall 2012 Jerome, County. 2006. “Jerome County Comprehensive Plan.” Karl Gudmunds, and USDA Economic Research Service. 2011. “ERS/USDA Data Sets Natural Amenity Index.” Accessed May 10. http://www.ers.usda.gov/data/. Kootenai, County. 2010. “Kootenai County Comprehensive Plan.” Nez Perce, County. 1998. “Nez Perce County Comprehensive Plan.” Pendall, Rolf, Robert Puentes, and Jonathan Martin. 2006. “From Traditional to Reformed: A Review of the Land Use Regulations in the Nation’s 50 Largest Metropolitan Areas”. The Brookings Institiution. Power, County. 2009. “Power County Comprehensive Plan.” Rovniak, Liza S., James F. Sallis, Brian E. Saelens, Lawrence D. Frank, Simon J. Marshall, Gregory J. Norman, Terry L. Conway, Kelli L. Cain, and Melbourne F. Hovell. 2010. “Adults’ Physical Activity Patterns Across Life Domains: Cluster Analysis with Replication.” Health Psychology : Official Journal of the Division of Health Psychology, American Psychological Association 29 (5) (September): 496–505. doi:10.1037/a0020428. Schamess, Lisa. 2006. “Everything Old Is New Again.” American Planning Associaton, December. Tim Parker, and USDA Economic Research Service. 2011. “ERS/USDA Briefing Room Measuring Rurality: Rural-Urban Continuum Codes.” Accessed May 10. http://www.ers.usda.gov/briefing/rurality/ruralurbcon/. Washington, County. 2000. “Washington County Comprehensive Plan.” Wojan, T. R., D. M. Lambert, and D. A. McGranahan. 2007. “Emoting with Their Feet: Bohemian Attraction to Creative Milieu.” Journal of Economic Geography 7 (6) (May): 711–736. doi:10.1093/jeg/lbm029.
35
Western Economics Forum, Fall 2012
Appendix 1 Detailed Methods for Scoring Comprehensive Plans The rating metric for each of the eight selected state required components broke down into the following criteria. Private Property objectives were either classified as explicit protection of private property, or placing restrictions on private property. Explicit protection would include any objective that had a main focus of protecting private property rights, whereas placing restrictions would include any objective that placed or suggested any type of limitation on private property rights. An example of an objective that explicitly protects private property is, “encourage the protection of the property rights of landowners to the extent possible” (Bingham 2005). This is in contrast to the view that there should be limitations placed on private property rights, “Property owners must recognize they are only temporary stewards of the land, and shall preserve and maintain their property for the benefit of future generations” (Elmore 2004, 13). Natural resource objectives were categorized as either promoting conservation or promoting traditional economic uses of natural resources. Conservation objectives included anything that preserved natural resources simply for the sake of the resource, with the primary regard not being its monetary value. Traditional economic use objectives included any objective that had a monetary focus but consisted primarily of timber, mining, and agricultural uses. An example of a conservation objective would be, “Protect and preserve the natural beauty and habitat of the Boise River and the black cottonwood forest and land abutting the river” (Ada 2007, 6–12). Whereas an example of an objective focusing on traditional economic uses of natural resources would be, “Work cooperatively with relevant agencies to, identify and protect productive resource farm, timber, and mining lands”(Kootenai 2010, 11–10). There were many instances of objectives addressing tourism in the Natural Resources section, which could fit into either category. In this case, these objectives were classified under traditional economic use as tourism objectives primarily focused on economic impacts. The land use section is often the largest of any section in comprehensive plans. Objectives in this section were broken down between protection of existing use, and preparing for growth. Protection of existing use includes any objective that specifically addresses an existing use and gives it some form of deference. Preparing for growth encapsulated the majority of objectives not dealing with existing uses, but dealing with issues such as directing growth, placement of new development, and desired outcomes. For example, an objective addressing the protection of existing use is, “Prevent the loss of range and agricultural lands” (Jerome 2006, 79). Protection of existing agricultural land is a common theme in Idaho. An objective preparing for growth, on the other hand, would be exemplified as, “Encourage rural residential cluster developments outside incorporated city's limits that will encourage self-sustaining communities”(Caribou 2006, 2). This example objective is targeted at dealing with development growth as opposed to protecting existing uses. While both approaches may have the effect of mitigating effects in the county, the focus and approach is distinguishable. The two strategies identified to separate the economic development objectives are actively pursuing economic development or responding to it. The former represents a proactive and directional stance toward economic development and the later represents a more reactionary or facilitatory approach. All counties hope for more economic development, so this difference in actively pursuing versus preparing an area for additional economic development is a way to distinguish more nuanced differences in strategies. An example of actively pursuing would be, “to attract new and retain current business in Camas County with a focus on light manufacturing and production and the tourism and recreational industry, creating a better wage base for
36
Western Economics Forum, Fall 2012 county residents”(Camas 2006, 12). This is clearly an active stance the county is taking. In contrast, an example of responding to economic development would be, “Provide the best method of transition between those areas in the county that are agricultural and those areas that may be suitable for other types of development”(Power 2009, 15). This represents an objective that more passively facilitates economic development. As opposed to actively pursuing the specific industry, this strategy responds to a potential new industry through more generalized assistance to revealed needs. These are just two examples in a wide variety of strategies that communities might employ, and of course, additional objectives that might be found elsewhere could contribute to economic development in practice. A trend that has been emerging in the transportation field is a push toward more multi-modal transportation. This includes not only biking and walking but also use of different forms of public transportation. However, in many counties this has not become an important issue. Thus the transportation section is separated into objectives that promote some sort of multi-modal policy, and those that deal only with traditional road transportation. An example of a non-road objective is, “Expand pedestrian, bicycle and transit facilities to provide transportation alternatives and promote an environment that is inviting for pedestrians, bicyclists and transit riders”(Jefferson 2005, 75). This is contrasted with an example of a road-centric objective, “Recognize the value of the roads systems to the agricultural community and work to reduce conflicts between transportation needs of agriculture and non-agricultural pursuits”(Washington 2000, 21). The final three sections, Public Services, Housing, and Community Development were all broken down based on who was responsible for carrying out the objective. The objectives could be primarily categorized as either the county being responsible for the actions in the objective, or a third party being responsible, often a company doing business in the area. For example, if a county wants to “encourage the designation of open space in new developments,”(Benewah 2003, 42) even though the county is encouraging it, the main responsibility will be with the developer creating a new development. As such, this would be an objective where the primary responsibility is with a third party. If the primary responsibility for the objective is on the county such as, “Nez Perce County should develop design standards to be included in county land use ordinances”(Nez Perce 1998, 2–2), it would be categorized as a county responsibility. Holding third parties to a set of standards is an important for all communities; this categorical dichotomy attempts more to address the participatory level of involvement of the county in these objectives.
37