Zoological Studies 51(7): 1094-1104 (2012)
What is the Role of Heterogeneity and Spatial Autocorrelation of Ponds in the Organization of Frog Communities in Southern Brazil? Samanta Iop1,*, Vinícius Matheus Caldart1, Tiago Gomes dos Santos2, and Sonia Zanini Cechin1 Programa de Pós-graduação em Biodiversidade Animal, Universidade Federal de Santa Maria (UFSM), Av. Roraima, 1000, CEP 97105-900, Santa Maria, RS, Brazil 2 Universidade Federal do Pampa (Unipampa), Campus São Gabriel. Av. Antônio Trilha, 1847, CEP 97300-000, São Gabriel, RS, Brazil 1
(Accepted July 25, 2012)
Samanta Iop, Vinícius Matheus Caldart, Tiago Gomes dos Santos, and Sonia Zanini Cechin (2012) What is the role of heterogeneity and spatial autocorrelation of ponds in the organization of frog communities in southern Brazil? Zoological Studies 51(7): 1094-1104. The composition of anuran communities is influenced by deterministic and/or stochastic factors. In this study, we tested whether the occurrence of anuran species in ponds differed from a null model of random placement, hypothesizing that environmental heterogeneity and spatial distribution of ponds have an influence on the structure of anuran communities in southern Brazil. Data were collected for 7 months from 14 ponds located in Turvo State Park, Rio Grande do Sul. To test whether distributions of species in the sampled ponds varied from random, the null model, SIM 2, was applied, while the roles of pond heterogeneity and proximity were evaluated by a redundancy analysis using environmental and spatial descriptors. Distributions of the 15 anuran species recorded in the studied ponds were clearly not random, corroborating our hypothesis that the species composition is influenced by environmental heterogeneity. Geographical proximity did not affect pond species compositions. However, the environmental descriptors had varying effects on anuran communities at different locations, indicating the need for studies to be carried out at local and/or regional levels in order to determine which environmental characteristics are most important for the conservation of anuran species. http://zoolstud.sinica.edu.tw/Journals/51.7/1094.pdf Key words: Amphibia, Habitat use, Null model, Hydroperiod, Spatial autocorrelation.
M
Different researchers working in southeastern and southern Brazil have determined that the organization of both adult frog (Vasconcelos et al. 2009) and tadpole communities (Both et al. 2011c) are in fact not influenced by stochastic processes, with environmental heterogeneity proving to be more important (Kopp and Eterovick 2006, Santos et al. 2007, Vasconcelos et al. 2009). Although few studies evaluated the role of spatial autocorrelation in this process, it was shown that geographical proximity influences the organization of communities, i.e., that adjacent communities tend to exhibit greater similarity in species compositions (Parris 2004, Keller et al. 2009, Santos et al. 2009). Many amphibian populations across the
ost amphibians are characterized by a biphasic life cycle in which young develop in aquatic environments and adults live in terrestrial environments. During the breeding season, adults must therefore choose a suitable environment favorable for the survival of their offspring (Duellman and Trueb 1994). However, factors which influence the geographical distribution of species in their chosen environment of reproduction are currently not well known. The study of community ecology is therefore essential for understanding patterns of species distribution in nature and how ecological attributes (biotic and abiotic) can influence the distribution and organization of communities (Toft 1985).
*To whom correspondence and reprint requests should be addressed. E-mail:
[email protected]
1094
Iop et al. – Organization of Frog Communities in Ponds
world are currently in decline (Stuart et al. 2004). According to Hayes et al. (2010), the worldwide decline of amphibians is caused by the action of 5 factors: atmospheric change, environmental pollutants, habitat modification, invasive species, and pathogens. In Brazil, drastic environmental changes such as deforestation, habitat fragmentation, and conversion, fire, water and atmospheric pollution, and exotic species were identified as main factors responsible for population declines (Haddad and Sazima 1992, Silvano and Segalla 2005, Becker et al. 2007, Machado et al. 2012). In the state of Rio Grande do Sul, Brazil, the lack of knowledge regarding local amphibian species is a constraining factor with respect to assessing the conservation status of this group, with habitat loss considered the principal threat to species conservation (Garcia and Vinciprova 2003). The present study was carried out with the following aims: i) to verify whether the occurrence of anuran species in the ponds differs from a null model of random distributions and ii) to explore the influence of environmental heterogeneity and spatial distributions of ponds on the structure of an anuran community in southern Brazil. The latter is significant since the complexity of local environments provides a great amount of shelter, moisture, and micro-habitats which can be used during the breeding season by anuran species (Parris and McCarthy 1999, Haddad and Prado 2005), while the geographic proximity between sites may result in neighboring ponds having a greater similarity in terms of species compositions than more distant ones (Parris 2004, Keller et al. 2009, Santos et al. 2009).
1095
forests regional domain (sensu Prado 2000), with the park representing the largest remaining area of this vegetation type in the state (SEMA 2005). The regional climate is characterized as subtropical sub-humid with dry summers (ST SB v); the average annual temperature is 18.8°C (Maluf 2000), while the average annual rainfall is 1665 mm, with the lowest amounts falling in summer. There is no dry season (SEMA 2005). The local photoperiod ranges from a minimum of 10 h 26 min in the cold season to a maximum of 13 h 54 min in the warm season (Observatório Nacional Brasileiro 2011). Data were collected monthly in 14 ponds of variable heterogeneity (Table 1). The sampling frequency ranged from 5 to 6 nights/month but was concentrated in the period from Sept. 2009 to Mar. 2010, which is the breeding season of most frog species in Rio Grande do Sul (Both et al. 2008, Santos et al. 2008). The method used for sampling anurans was ‘sampling sites of reproduction’ (sensu Scott Jr. and Woodward 1994). Searches were conducted from early evening to 24:00 along the
N
Turvo State Park
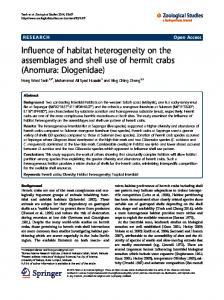
MATERIALS AND METHODS The study was carried out in Turvo State Park (TSP) (27°14'32.98"S, 53°56'56.46"W; 100400 m in elevation), located in the municipality of Derrubadas in the extreme northwest of the state of Rio Grande do Sul, Brazil (Fig. 1). Covering a total area of 17,491 ha, the park has a perimeter of about 90 km, including part of the border between Brazil and Argentina and that between the Brazilian states of Rio Grande do Sul and Santa Catarina, both formed by the course of the Uruguay River (SEMA 2005). The local vegetation type is mesophytic semideciduous forest (sensu Oliveira-Filho et al. 2006) which belongs to the Misiones nucleus in the tropical seasonal
0
km
500
Fig. 1. Map of South America highlighting the state of Rio Grande do Sul, Brazil. Black point: Turvo State Park.
Zoological Studies 51(7): 1094-1104 (2012)
1096
perimeter of ponds, with the number of calling males used to evaluate species abundance. Sampling effort varied with the size and complexity of the ponds (Scott Jr. and Woodward 1994); greater effort was spent at ponds of greater area and/or complexity. Voucher specimens were deposited in the Scientific Collection of the Univ. Federal de Santa Maria (ZUFSM) (licenses of Secretaria Estadual do Meio Ambiente #302 and SISBIO/RAN #18320-1). Pond heterogeneity was determined 3 times during the sampling period (at the beginning, middle, and end of the sampling period) in terms of 9 environmental descriptors adapted from Santos et al. (2007) and Vasconcelos et al. (2009) (Table 1): 1. maximum pond size (m2), calculated in terms of the formula for an ellipse or circle; 2. hydroperiod gradient, including (1) temporary ponds that dried up at least once during the sampling period, (2) semi-permanent ponds with a size variation coefficient of > 50%, and (3) permanent ponds with a size variation coefficient of < 50%; 3. complexity of the pond edge, including (1) dry soil without vegetation, (2) dry soil with and without vegetation, (3) moist soil without vegetation, (4) moist soil with and without vegetation, (5) flooded soil without vegetation, and (6) flooded soil with and without vegetation; 4. percentage vegetation cover on the water surface; 5. number of vegetation profiles (strata) on the water surface; 6. number
of vegetation profiles (strata) at the pond edge; 7. percentage vegetation shading the water surface (canopy cover); 8. maximum depth (m); and 9. linear distance between the pond and the nearest park boundary (km). To test whether the distribution of species in the different ponds differed from chance, the null model, SIM2, was applied (with fixed lines and equiprobable columns; Gotelli and Entsminger 2009). In total, 5000 simulations were generated by substituting community null sequences (sequential swap) (Gotelli and Entsminger 2003 2009), while degenerate matrices were retained (Gotelli and Entsminger 2009). The index used in the model was the variance ratio (V-ratio) (Robson 1972), a robust index which was applied here to measure the variability in the number of species per pond. The analysis was performed using the EcoSim 7.72 (Gotelli and Entsminger 2009). Evaluation of the roles of pond heterogeneity and geographical proximity on the organization of the studied frog communities was performed via a redundancy analysis (RDA). The RDA assumes that species exhibit linear relationships with environmental gradients (Palmer 2010). Three matrices were built for the RDA: (1) a data matrix containing the maximum abundance of species recorded in the ponds during the sampling period, to avoid overestimation (Vasconcelos and RossaFeres 2005, Santos et al. 2008); (2) a matrix of
Table 1. Summary of the heterogeneity of 14 ponds studied at Turvo State Park, Rio Grande do Sul, Brazil, from Sept. 2009 to Mar. 2010. A, area (m2); H, hydroperiod; HE, heterogeneity of the pond edge; PVM, percentage vegetation cover on the water surface; NVM, number of profiles (strata) of vegetation on the water surface; NVE, number of profiles (strata) of vegetation at the pond edge; PVC, percentage vegetation cover over the water surface (canopy); D, depth (m); DE, distance in relation to nearest park boundary (km) Geographic coordinates Pond
Latitude
Longitude
A
H
HE
PVM
NVM
NVE
PVC
D
DE
P1 P2 P3 P4 P5 P6 P7 P8 P9 P10 P11 P12 P13 P14
27.22950 27.22895 27.22421 27.21384 27.20964 27.19548 27.19646 27.19697 27.19404 27.24038 27.23855 27.23772 27.97845 27.21898
53.85012 53.85163 53.85171 53.85475 53.85494 53.84459 53.84517 53.84478 53.84396 53.97161 53.97725 53.97947 53.97845 53.99819
3481.50 2945.24 3080.33 1017.72 972.01 679.59 2247.81 3785.80 1297.79 856.39 623.56 1273.17 4241.15 781.55
3 1 2 2 1 1 2 1 1 2 1 1 1 2
3 3 3 3 3 4 5 3 1 4 3 3 3 4
99 100 90 98 99 95 98 99 100 95 99 98 100 100
4 3 6 5 3 3 4 4 3 3 4 3 5 4
3 3 4 4 4 4 3 3 3 6 4 5 4 3
10 15 20 100 40 10 10 10 10 10 40 20 10 50
2 0.7 1 0.6 0.1 0.65 1.5 1 0.4 0.8 0.55 0.8 0.3 0.5
0.41 0.44 0.75 1.78 1.91 1.49 1.55 1.59 1.68 0.98 1.29 1.46 1.66 1.55
Iop et al. – Organization of Frog Communities in Ponds
pond heterogeneity; and (3) a matrix representing the spatial distribution of ponds determined using the principal coordinates of the neighbor matrices algorithm (PCNM) (Borcard and Legendre 2002). To construct the 2nd matrix, a principal component analysis (PCA) was performed to summarize the environmental variables that showed correlations. We used the 1st and 2nd PCA axes, which were responsible for most of the data variation. After the data were summarized, the PCA axes were correlated with environmental variables to determine the contribution of each variable to the formation of the 1st and 2nd axes. The PCA results explained 52.67% of total data variability, of which axis 1 was responsible for 31.70%. This axis was positively correlated with the percentage vegetation cover on the water surface and the distance to the nearest park boundary, and negatively related to pond area, hydroperiod, and depth. Explaining 20.97% of the data variability, axis 2 was positively related to the heterogeneity of the pond edge, the number of profiles (strata) of vegetation at the pond edge, and the percentage of vegetation shading the water surface (canopy), and negatively correlated with the area and percentage vegetation cover on the water surface. The 3rd matrix was used to test for possible effects of pond proximity on the structure of frog communities. This effect, also known as spatial autocorrelation, refers to the potential lack of independence among samples (i.e., ponds) due to geographic proximity (Legendre and Legendre 1998). This spatial matrix was subjected to a process of manual selection (999 Monte Carlo permutations) in order to determine the significance of each of the 7 axes generated via the PCNM. After this process was carried out, none of the axes was retained in the model (p > 0.05), showing that geographic proximity between ponds did not influence the structure of TSP frog community. As a result, the spatial matrix was not included in the subsequent analysis. Potential multicollinearity among environmental descriptors was measured in terms of variance inflation (VIF) (ter Braak 1986). Descriptors associated with high VIF values (> 20) are indicative of multicollinearity, which produces unstable estimates in regression equations due to the redundancy of information (ter Braak 1986). In this study, all environmental descriptors presented low VIF values (< 20). The abundance matrix was Log10-transformed (for correction of data heteroscedasticity, sensu Zar 1999). The heterogeneity matrix was either arcsine or square root-transformed,
1097
depending on the variable (Krebs 1999), before being stan-dardized using the standard deviation in order to eliminate any heterogeneity of original data variance (Clarke and Gorley 2006). The RDA was performed using the CANOCO 4.5 for Windows (ter Braak and Smilauer 1998), while the PCA and PCNM axes were obtained via package ʻvegan’ in the R environment (Oksanen et al. 2011). Correlations between the scores of the 1st and 2nd PCA axes and variables were determined using BioEstat 5.0 (Ayres et al. 2007). RESULTS We recorded 14 native and 1 exotic frog species at the monitored ponds (Table 2). Distributions of these species significantly differed from random (V-ratio: mean observed = 2.59, mean simulated = 1.00; p < 0.01). No PCNM axis representing the spatial distributions of ponds was included in the RDA. The 4 RDA axes, representing correlations between the abundances of frog species in ponds and their heterogeneity, were significant (F = 1.33; p < 0.05), and explained 61.7% of the total data variation. The 1st and 2nd axes were responsible for 52.4% of the total variation, with the 1st axis alone explaining 44.7% of the total inertia (F = 4.04; p < 0.01) (Table 3). The 1st axis was positively correlated with pond area, the number of profiles (strata) of vegetation at the pond edge, and pond depth, and negatively related to the percentage vegetation shading the water surface (canopy cover). The 2nd axis was positively correlated with the percentage vegetation shading the water surface (canopy cover), number of profiles (strata) of vegetation at the pond edge, and pond depth, and negatively related to pond area (Table 4). From the triplot, it was clear that most species recorded in TSP ( Dendropsophus minutus, Elachistocleis bicolor, Hypsiboas faber, Leptodactylus latrans, L. mystacinus, Lithobates catesbeianus, Phyllomedusa tetraploidea, Physalaemus cuvieri, P. cf. gracilis, Scinax fuscovarius, S. granulatus, and S. perereca) preferred ponds with a long hydroperiod which tended to be deeper, have larger areas and lower percentages of shading and vegetation on the water surface, and ponds located away from the park’s boundary (P1, P3, P7, and P10). In contrast, Leptodactylus plaumanni was found to be associated with ponds with a short hydroperiod and shallow depth (P6 and P9), while
Zoological Studies 51(7): 1094-1104 (2012)
1098
Proceratophrys avelinoi was observed at ponds with a high percentage of vegetation cover on the water surface (P5). Phyllomedusa tetraploidea was recorded mostly in permanent and semipermanent ponds (Fig. 2).
anuran species tended to select the same ponds for reproduction. In testing the species distribution of anuran communities of both adults and larvae (Vasconcelos et al. 2009, Both et al. 2011a), the use of null models showed that species were not randomly distributed across all available ponds in a given area. In those earlier studies, the structure of anuran communities was explained as a potential result of interaction among species, some kind of habitat selection, processes linked to spatial autocorrelation, and phylogenetic constraints. In the present study, the structure of anuran communities was not influenced by the spatial
DISCUSSION Distributions of the 15 anuran species found in the monitored ponds were clearly not random, with V-ratio index values showing a positive variance between species (average observed > 1), a result which demonstrated that most pairs of
Table 2. Maximum abundance data for anuran species recorded in the 14 ponds monitored at Turvo State Park, Rio Grande do Sul, Brazil, from Sept. 2009 to Mar. 2010. *Exotic species; RM, reproductive mode (sensu Haddad & Prado 2005) Pond Taxa Cycloramphidae Proceratophrys avelinoi Hylidae Dendropsophus minutus Hypsiboas faber Phyllomedusa tetraploidea Scinax aromothyella Scinax fuscovarius Scinax granulatus Scinax perereca Leptodactylidae Leptodactylus latrans Leptodactylus mystacinus Leptodactylus plaumanni Physalaemus cuvieri Physalaemus cf. gracilis Microhylidae Elachistocleis bicolor Ranidae Lithobates catesbeianus*
P1
P2
P3
P4
P5
P6
P7
P8
P9
P10
P11
P12
P13
P14
RM
0
0
0
0
5
0
0
0
0
0
0
0
0
0
1
24 8 6 0 15 17 19
35 1 0 11 7 0 2
41 9 1 8 22 22 52
9 2 0 2 6 1 9
0 7 0 1 0 0 0
10 0 1 1 0 33 0
27 17 2 1 5 51 14
30 1 0 2 24 0 76
2 0 0 4 2 0 0
35 5 10 4 22 4 34
3 0 0 6 1 0 2
12 4 5 5 0 13 13
19 1 0 2 12 62 2
4 1 1 1 0 0 12
1 4 24 1 1 1 1
15 8 0 14 6
20 32 7 7 9
24 15 0 11 9
6 4 0 5 2
0 0 1 0 0
0 5 3 1 6
11 12 2 18 14
1 4 5 1 5
2 8 6 0 3
25 16 0 25 3
0 0 0 0 2
7 8 0 2 9
2 17 13 3 11
2 7 1 1 9
11 30 30 11 11
4
6
3
1
0
3
2
0
0
2
8
1
11
0
1
23
0
12
0
0
3
14
2
0
0
2
0
0
0
1
Table 3. Summary of the results of a redundancy analysis investigating relationships between abundances of anuran species and pond heterogeneity variables, derived from data recorded between Sept. 2009 and Mar. 2010 at Turvo State Park, Rio Grande do Sul, Brazil
Eigenvalue Species-environment correlation Cumulative percentage variance of species data Cumulative percentage variance of species-environment relationship
Axis 1
Axis 2
Axis 3
Axis 4
0.447 0.977 44.7 65.7
0.077 0.817 52.4 77
0.055 0.7 57.9 85.1
0.038 0.739 61.7 90.6
Iop et al. – Organization of Frog Communities in Ponds
1099
1.0 4
PVC H
10 NVE
11 14
DE 5 9
12
Pave
PVM
Ptet
HE
Hfab Llat Sper
Pcuv D
Saro Ebic
6
7
Lcat
3
Dmi Sgra Sfus Lmys Pgra
2
A
8 Lpla
1
13
-1.0 -1.0
1.0
Fig. 2. Triplot ordination showing the 1st and 2nd axes of the redundancy analysis considering ponds, anuran species, and heterogeneity descriptors derived from data recorded between Sept. 2009 and Mar. 2010 in Turvo State Park, Rio Grande do Sul, Brazil. A, area (m2); H, hydroperiod; PVM, percentage vegetation cover on the water surface; NVE, number of profiles (strata) of vegetation at the pond edge; PVC, percentage vegetation cover over the water surface (canopy); D, depth (m); HE, heterogeneity of the pond edge; DE, distance in relation to nearest park boundary (km); Dmi, Dendropsophus minutus; Ebic, Elachistocleis bicolor; Hfab, Hypsiboas faber; Llat, Leptodactylus latrans; Lmys, L. mystacinus; Lpla, L. plaumanni; Lcat, Lithobates catesbeianus; Ptet, Phyllomedusa tetraploidea; Pgra, Physalaemus cf. gracilis; Pcuv, P. cuvieri; Pave, Proceratophrys avelinoi; Saro, Scinax aromothyella; Sfus, S. fuscovarius; Sgra, S. granulatus; Sper, S. perereca.
Table 4. Canonical coefficients and correlations for environmental variables automatically selected during the redundancy analysis procedure for the 14 ponds monitored between Sept. 2009 and Mar. 2010 in Turvo State Park, Rio Grande do Sul, Brazil. A, area (m2); H, hydroperiod; HE, heterogeneity of the pond edge; PVM, percentage vegetation cover on the water surface; NVE, number of profiles (strata) of vegetation at the pond edge; PVC, percentage vegetation cover over the water surface (canopy); D, depth (m); DE, distance in relation to nearest park boundary (km) Canonical coefficients
A H HE PVM NVE PVC D DE
Correlation coefficients
Eixo 1
Eixo 2
Eixo 3
Eixo 4
Eixo 1
Eixo 2
Eixo 3
Eixo 4
0.4912 0.3027 0.1429 -0.1578 0.3254 -0.0807 0.3824 0.0107
-0.5449 0.3107 -0.2125 0.1312 0.3783 0.5061 0.4085 -0.1519
0.381 -0.288 -0.3185 0.2073 0.3265 0.4825 -0.2495 -0.9929
-0.0086 0.3713 0.2685 0.3955 0.8128 -0.6498 -0.7101 -0.1099
3.8502 1.9594 1.2857 -1.3118 2.5552 -0.6039 2.1793 0.0832
-1.3104 0.6172 -0.5865 0.3348 0.9115 1.1619 0.7142 -0.3638
0.6332 -0.3953 -0.6077 0.3656 0.5437 0.7655 -0.3015 -1.6435
-0.0159 0.5704 0.5733 0.7805 1.5148 -1.154 -0.9602 -0.2037
1100
Zoological Studies 51(7): 1094-1104 (2012)
distribution of ponds. This result indicates that anuran communities along the studied ponds were independent regarding their structure (sensu Legendre and Legendre 1998). However, several studies reported that geographically close ponds tend to exhibit greater similarities in the composition of their resident anuran species (Wells 2007, Santos et al. 2009, Vasconcelos et al. 2009, Chen et al. 2011), supporting the spatial autocorrelation hypothesis. These conflicting results may have been due to the type of environment studied, since, curiously, most studies reporting the importance of geographical distance were carried out in open unforested areas. Future studies must therefore show if movements of individuals between water bodies are facilitated in the open with respect to forest environments, since the latter tend to have greater structural complexity. Finally, the hypothesis that the community structure is influenced by some attribute of pond heterogeneity was confirmed by the former’s correlation with pond area, depth, hydroperiod, percentage vegetation shading the water surface, the number of edge types, and the distance from the nearest park boundary. The influence of pond size on anuran species in TSP is possibly related to resource availability. With their more numerous microhabitats i.e., sites used for calling and/or spawning, larger ponds may be considered larger ‘targets’ and can thus be colonized by a greater number of individuals. In addition, larger ponds often have decreased rates of local extinction due to their ability to support larger populations, and provide more stable physical and chemical conditions (Kiflawi et al. 2003). In the present study, the large ponds monitored seemed to act as open environments, i.e., as large forest clearings, since they usually exhibited low levels of plant shading (canopy). In fact, this type of water body was frequently colonized by anuran species typical of more open areas, such as Dendropsophus minutus, Leptodactylus latrans, Physalaemus cuvieri, P. cf. gracilis, and Scinax fuscovarius (Kwet and Di-Bernardo 1999, Loebmann 2005, Uetanabaro et al. 2008). The presence of these species may be a result of historical factors related to the original climate of seasonal forests, since during the maximum expansion of this forest type (in the Pleistocene), the climate in South America was colder and drier than it is currently (Prado and Gibbs 1993, Pennington et al. 2000). Variations in a pond’s hydroperiod may explain the observed composition and richness
of anuran species (see examples for adults and larvae in Both et al. 2011a and Vasconcelos et al. 2011a b), either as a result of ecological adaptation (Heyer et al. 1975) or evolutionary constraints (Eterovick and Sazima 2000) relating to the duration of water bodies (see Vasconcelos et al. 2011b). Heyer et al. (1975) proposed that permanent ponds are more complex and stable than ephemeral ponds. While permanent ponds can support more predators, especially fish, which are able to exert strong predation pressure on tadpoles, the risk of desiccation in ephemeral ponds is higher, and predator pressure is smaller. Therefore in lentic systems, the structure of predator communities varies across an increasing hydroperiod gradient: ephemeral - temporary permanent ponds (Wellborn et al. 1996). This pattern may result in ecological conflicts for anuran species in ephemeral water bodies, since minimizing predation risk would mean increasing the risk of death by desiccation (Beebee 1996). In this context, the colonization of water bodies with an intermediate hydroperiod (i.e., long-term temporary) would be ecologically advantageous compared to those at the extremes of the hydroperiod gradient (Burne and Griffin 2005). In fact, most anuran species observed in TSP used ponds with longer hydroperiods for reproduction (P1, P3, P7, and P10). In contrast, Oda et al. (2009) reported results that differed from those expected according to ecological theory, with many anuran species in an area of the Cerrado in central Brazil reproducing in permanent ponds. In that case, the authors related the pattern of water body use to a pronounced dry season in the region, which significantly affected short-term temporary water bodies. Pond hydroperiod variations may also be correlated with anuran reproductive patterns (Vasconcelos et al. 2009 2011b). For example, while permanent ponds tend to be colonized by species with an extended reproductive pattern (sensu Wells 1977), such as Dendropsophus minutus, temporary ponds tend to be colonized by species that adopt explosive breeding strategies (sensu Wells 1977), such as Proceratophrys avelinoi. In this regard, species of the family Leptodactylidae were more abundant in the present study in temporary or semi-permanent ponds, a pattern which likely reflects evolutionary adaptations of these groups to deal with ponds that either completely dry out or exhibit large fluctuations in water levels, such as the nest foam that protects eggs from desiccation (Vasconcelos and
Iop et al. – Organization of Frog Communities in Ponds
Rossa-Feres 2005, Santos et al. 2007). The presence of Phyllomedusa tetraploidea in permanent and semi-permanent ponds can be explained by considering the reproductive requirements of this species, since their eggs are deposited in nests of leaves from which tadpoles fall directly into lentic water bodies (Haddad and Prado 2005). The use of ponds with large seasonal variations in water contents would therefore be disadvantageous to the reproductive success of this species, as also indicated by observations of Pombal Jr. and Haddad (1992). Accompanied by reduced levels of water surface cover, deeper ponds at TSP were colonized by Hypsiboas faber, Leptodactylus latrans, Lithobates catesbeianus, and Physalaemus cuvieri. The amount of aquatic plants in the ponds is determined by the water depth via a process known as zonation, with the highest concentration of hydrophytes (emergent and floating) occurring in shallower areas, while deeper regions usually are characterized by water surface free of plant growth (Brönmark and Hansson 2005, van der Valk 2006, Williams 2006). The use of this type of water body by anuran species as breeding sites can partly be explained by their greater stability compared to that of shallower water bodies, since at least 2 of the species (H. faber and L. catesbeianus) observed in the present study have long larval development periods (24 and 23-36 months, respectively) (Bury and Whelan 1984, Kwet and Di-Bernardo 1999). Thus deeper ponds are less likely to dry out before the larval period is completed. However, L. latrans and P. cuvieri have short larval development periods (about 45 days each) (Gallardo 1964, Andrade 1995). In this case, the pattern of pond usage is not a reflection of the duration of larval development, but rather the requirements of these 2 species regarding calling sites. Indeed, an examination of the literature reveals that males of P. cuvieri vocalize floating on the water surface in places without emergent vegetation (Santos and Rossa-Feres 2007), while males of L. latrans commonly vocalize in deeper areas (Fernández and Fernández 1921). The exclusivity of Proceratophrys avelinoi in shallow and densely vegetated water bodies corroborates the information available in the literature that indicates this species as a habitat specialist (Caldart et al. 2010), since P. avelinoi reproduces mainly among dense vegetation or dead leaves in swamps and shallow ponds (Machado et al. 1999, Kwet and Faivovich 2001, De Sá and Langone 2002). In this case, vegetation
1101
provides protection for spawn, tadpoles, and adults against solar radiation, and effective shelter from visually oriented predators (Cardoso et al. 1989, Parris and McCarthy 1999, Vasconcelos et al. 2009). As a complement, the low depth is related to increased water temperature, which favors larval development (Gotthard 2001, Brönmark and Hansson 2005, van der Valk 2006, Williams 2006). Most anuran species recorded in ponds at TSP are typical of open areas; however, they typically selected pools away from the boundaries of the park. Species occupying open areas within forest fragments require a refuge during dry periods, day roosts during the breeding season, and foraging areas (Silva and Rossa-Feres 2007). This was also reported in northwestern São Paulo, where open-area anuran species are more abundant in ponds near forest remnants (Silva and Rossa-Feres 2007). Such forested areas may therefore provide greater stability for populations due to their humidity and protection against ultraviolet radiation, both of which are very important for anuran conservation. TSP, the last large remnant of mesophytic semideciduous forest in the state of Rio Grande do Sul, is home to a high diversity of anurans (31 species) (Iop et al. 2011), including those dependent on streams located inside the forest, such as Crossodactylus schmidti and Hypsiboas curupi, which are threatened by changes in humidity and water temperature generated by environmental degradation (e.g., clear-cutting) (Duarte et al. 2012). In fact, TSP is currently threatened by a number of hydroelectric power projects, including that of the Garabi-Panambi complex and others on the Uruguay River. The hydroelectric dams planned as part of these projects will flood extensive areas, including the Salto Yucumã, a peculiar rocky environment which is home to a unique population of Limnomedusa macroglossa recorded at TSP, and an undescribed species of Leptodactylus (L. aff. latinasus). The lack of a buffer zone around TSP is an additional problem facing biodiversity conservation, since such a zone would act as a barrier against the leaching of pesticides and invasion by exotic species. The effectiveness of a buffer zone is essential in order to minimize negative impacts on the local flora and fauna and could potentially prevent/retard the invasion of the park by exotic species. In this context, the lack of a buffer zone has possibly facilitated the invasion by Lithobates catesbeianus in TSP. The bullfrog is native to the US and Canada, but was introduced to Brazil for human
Zoological Studies 51(7): 1094-1104 (2012)
1102
consumption in 1935 (Fontanello and Ferreira 2004) and now can be found in 130 municipalities across the country (Both et al. 2011b). The bullfrog is a generalist predator that even eats native frogs (Silva et al. 2009 2011) and has high fertility (Kaefer et al. 2007), attributes that favors its invasion in various parts of the world. It has been found in the TSP since 1996 (Borges-Martins et al. 2002) and may be negatively impacting native frogs. Therefore, it is necessary to evaluate the actual impacts of this species in the park. In conclusion, the results of our study and of others reported worldwide reveal the heterogeneity of water bodies to be a strong regulator of anuran community structure (Parris 2004, Vasconcelos et al. 2009). The variation between studies with respect to the importance of different environmental descriptors, and the role of geographical distance, may simply be a product of the number of water bodies sampled (Vasconcelos et al. 2009), and of the processes that occur on a local scale. As a result, strategies for the conservation of anurans species should be based on the results of studies carried out on both local and regional levels, in order to represent the dynamic processes that operate at different scales. Acknowledgments: The authors are grateful to the director and staff of TSP. SI and VMC would like to thank CAPES for granting the master’s degree fellowships, and SZC would like to thank CNPq for the award of a research fellowship (process no. 303359/2009-9). We also thank R.J. Sawaya, R. Maneyro, E.L. Gonsales, D.L. Guadagnin, E.R. Behr, and 2 anonymous reviewers for valuable suggestions on the manuscript, and P.M. Paim, V.M. Lipinski, T.R.N. Bertaso, and M.C. Rocha for their help with fieldwork. REFERENCES Andrade GV. 1995. A história de vida de Physalaemus cuvieri (Anura: Leptodactylidae) em um ambiente temporário. Tese de Doutorado, Univ. Estadual de Campinas, Campinas, Brazil. Ayres M, M Ayres Jr, DL Ayres, AS Santos. 2007. BioEstat 5.0. Aplicações estatísticas nas áreas das ciências biológicas e médicas. Belém, Brazil: Sociedade Civil de Mamirauá. Becker CG, CR Fonseca, CFB Haddad, RB Batista, PI Prado. 2007. Habitat split and the global decline of amphibians. Science 318: 1775-1777. Beebee TJC. 1996. Ecology and conservation of amphibians. London: Chapman and Hall, 214 pp. Borcard D, P Legendre. 2002. All-scale spatial analysis of ecological data by means of principal coordinates of
neighbour matrices. Ecol. Model. 153: 51-68. Borges-Martins M, M Di-Bernardo, G Vinciprova, J Measey. 2002. Geographic distribution. Rana catesbeiana. Herpetol. Rev. 33: 319. Both C, SZ Cechin, AS Melo, SM Hart. 2011a. What controls tadpole richness and guild composition in ponds in subtropical grasslands? Aust. Ecol. 36: 530-536. Both C, IL Kaefer, TG Santos, SZ Cechin. 2008. An austral anuran assemblage in the Neotropics: seasonal occurrence correlated with photoperiod. J. Nat. Hist. 42: 205222. Both C, RL Lingnau, A Santos-Jr, B Madalozo, LP Lima, T Grant. 2011b. Widespread occurrence of the American bullfrog, Lithobates catesbeianus (Shaw, 1802) (Anura: Ranidae), in Brazil. S. Am. J. Herpetol. 6: 127-132. Both C, AS Melo, SZ Cechin, SM Hartz. 2011c. Tadpole cooccurrence in ponds: When do guilds and time matter? Acta Oecol. 37: 140-145. Brönmark C, LA Hansson. 2005. the biology of lakes and ponds. New York: Oxford Univ. Press, 216 pp. Burne MR, CR Griffin. 2005. Habitat associations of poolbreeding amphibians in eastern Massachusetts, USA. Wetlands Ecol. Manage. 13: 247-259. Bury RB, JA Whelan. 1984. Ecology and management of the bullfrog. Washington DC: US Fish and Wildlife Service, 23 pp. Caldart VM, S Iop, TG Santos, SZ Cechin. 2010. Extension of the geographical distribution of two anuran species for Rio Grand do Sul State, Brazil, with comments on natural history. Biota. Neotrop. 10: 143-147. Cardoso AJ, GV Andrade, CFB Haddad. 1989. Distribuição espacial em comunidades de anfíbios (Anura) no sudeste do Brasil. Rev. Bras. Biol. 49: 241-249. Chen S, G Jiang, J Zang, Y Li, H Qian. 2011. Species turnover of amphibians and reptiles in eastern China: disentangling the relative effects of geographic distance and environmental difference. Ecol. Res. 26: 949-956. Clarke KR, RN Gorley. 2006. Software PRIMER v6. Plymouth UK: PRIMER-E. De Sá RO, JA Langone. 2002. The tadpole of Proceratophrys avelinoi (Anura: Leptodactylidae). J Herpetol. 36: 490494. Duarte H, M Tejedo, M Katzenberger, F Marangoni, D Baldo, JF Beltrans et al. 2012. Can amphibians take the heat? Vulnerability to climate warming in subtropical and temperate larval amphibian communities. Glob. Change Biol. 18: 412-421. Duellman WE, L Trueb. 1994. Biology of amphibians. Baltimore, MD and London: McGraw-Hill, 670 pp. Eterovick PC, I Sazima. 2000. Structure of an anuran community in a montane meadow in southeastern Brazil: effects of seasonality, habitat, and predation. Amphib. Reptil. 21: 439-461. Fernández K, M Fernández. 1921. Sobre la biología y reproducción de algunos batracios argentinos. I - Cystignathidae. Anal. Soc. Cien. Arg. 91: 97-140. Fontanello D, CM Ferreira. 2004. Histórico da Ranicultura nacional. Available at http://www.aquicultura.br/historico. htm Accessed 23 July 2011. Gallardo JM. 1964. Consideraciones sobre Leptodactylus ocellatus (Amphibia, Anura) y especies aliadas. Physis 68: 373-384. Garcia PCA, G Vinciprova. 2003. Anfíbios. In AAB Marques, CS Fontana, E Vélez, GA Bencke, M Schneider, RE Reis,
Iop et al. – Organization of Frog Communities in Ponds eds. Livro vermelho da fauna ameaçada de extinção no Rio Grande do Sul. Porto Alegre, Brazil Edipucrs, pp. 85100. Gotelli NJ, GL Entsminger. 2003. Swap algorithms in null model analysis. Ecology 84: 532-535. Gotelli NJ, GL Entsminger. 2009. EcoSim: null models software for ecology. Vers. 7. Jericho, VT: Acquired Intelligence and Kesey-Bear. Available at http://garyentsminger. com/ecosim.htm Accessed 10 Apr. 2010. Gotthard K. 2001. Growth strategies of ectothermic animals in temperate environments. In Environment and animal development. D Atkinson, M Thorndyke, eds. Oxford, UK: BIOS Scientific Publishers, pp. 287-304. Gudynas E. 1984. Sobre el Río Uruguay como barrera biogeográfica para anfibios, y la significancia de la presencia de Leptodactylus chaquensis Cei, 1950 (Anura, Leptodactylidae) en el Uruguay. Bol. Soc. Zool. Uruguay 2a epoch 2: 78-89. Haddad C, I Sazima. 1992. Anfíbios anuros da Serra do Japi, sudeste do Brasil. In LPC Morellato, ed. História Natural da Serra do Japi: ecologia e preservação de uma área florestal no sudeste do Brasil. São Paulo: UNICAMP e FAPESP, pp. 188-210. Haddad CFB, CPA Prado. 2005. Reproductive modes in frogs and their unexpected diversity in the Atlantic forest of Brazil. Bioscience 55: 207-217. Hayes TB, P Falso, S Gallipeau, M Stice. 2010. The cause of global amphibian declines: a developmental endocrinologist’s perspective. J. Exp. Biol. 213: 921-933. Heyer WR, RW McDiarmid, DL Weigmann. 1975. Tadpoles, predation and pond habitats in the tropics. Biotropica 7: 100-111. Iop S, VM Caldart, TG Santo, SZ Cechin. 2011. Anurans of Turvo State Park: testing the validity of seasonal forest as a new biome in Brazil. J. Nat. Hist. 45: 2443-2461. Kaefer IL, RA Boelter, SZ Cechin. 2007. Reproductive biology of the invasive bulfrog Lithobathes catesbeianus in southern Brazil. Ann. Zool. Fenneci. 44: 435-444. Keller A, M Rödel, KE Linsenmair, TU Grafe. 2009. The importance of environmental heterogeneity for species diversity and assemblage structure in Bornean stream frogs. J. Anim. Ecol. 78: 305-314. Kiflawi M, A Eitam, L Blaustein. 2003. The relative impact of local and regional processes on macro-invertebrates species richness in temporary pools. J. Anim. Ecol. 72: 447-452. Kopp K, PC Eterovick. 2006. Factors influencing spatial and temporal structure of frog assemblages at ponds in southeastern Brazil. J. Nat. Hist. 40: 1813-1830. Krebs CJ. 1999. Ecological methodology. Menlo Park, California: Addison Wesley Educational Publishers. Kwet A, M Di-Bernardo. 1999. Anfíbios. Porto Alegre, Brazil: EDIPUCRS. Kwet A, J Faivovich. 2001. Proceratophrys bigibbosa species group (Anura: Leptodactylidae), with description of a new species. Copeia 1: 203-215. Legendre P, L Legendre. 1998. Numerical ecology developments in environmental modeling. New York: Elsevier. Loebmann D. 2005. Os anfíbios da região costeira do extreme sul do Brasil. Pelotas, Brazil: USEB, União SulAmericana de Estudos da Biodiversidade. Machado IF, LFB Moreira, L Maltchik. 2012. Effects of pine invasion on anurans assemblage in southern Brazil
1103
coastal ponds. Amphib. Reptil. 33: 227-237. Machado RA, PS Bernarde, SAA Morato, L Anjos. 1999. Análise comparada da riqueza de anuros entre duas áreas com diferentes estados de conservação no Município de Londrina, Paraná, Brasil (Amphibia: Anura). Rev. Bras. Zool. 16: 997-1004. Maluf JRT. 2000. Nova classificação climática do Estado do Rio Grande do Sul. Rev. Bras. Agrometerol. 8: 141-150. Observatório Nacional Brasileiro. 2011. Photoperiod. Available at http://euler.on.br/ephemeris/index.php Accessed 14 June 2011. Oda FH, RP Bastos, MACS Lima. 2009. Taxocenose de anfíbios anuros no Cerrado do Alto Tocantins, Niquelândia, Estado de Goiás: diversidade, distribuição local e sazonalidade. Biota Neotrop. 9: 219-232. Oksanen J, FG Blanchet, R Kindt, P Legendre, PR Minchin, RB O’Hara et al. 2011. Vegan: community ecology package. R. package vers. 2.0-1. Available at http://CRAN. R-project.org/package=vegan Accessed 12 Feb. 2011. Oliveira-Filho AT, JA Jarenkow, MJN Rodal. 2006. Floristic relationships of seasonally dry forests of eastern South America based on tree species distribution patterns. In RT Pennington, GP Lewis, J Ratter, eds. Neotropical savannas and seasonally dry forests: plant diversity, biogeography, and conservation. Florida, USA: Taylor & Francis CRC Press, pp. 159-192. Palmer M. 2010. Ordination methods for ecologists. Available at http://ordination.okstate.edu/ Accessed 4 Apr. 2010. Parris KM. 2004. Environmental and spatial variables influence the composition of frog assemblages in subtropical eastern Australia. Ecography 27: 392-400. Parris KM, MA McCarthy. 1999. What influences the structure of frog assemblages at forest streams? Aust. J. Ecol. 24: 495-502. Pennington RT, DE Prado, CA Pendry. 2000. Neotropical seasonally dry forests and Quaternary vegetation changes. J. Biogeogr. 27: 261-273. Pombal Jr JP, CFB Haddad. 1992. Espécie de Phyllomedusa do grupo burmeisteri do Brasil oriental, com descrição de uma espécie nova (Amphibia, Hylidae). Rev. Bras. Zool. 52: 217-229. Prado DE. 2000. Seasonally dry forests of tropical South America: from forgotten ecosystems to a new phytogeographic unit. Edin. J. Bot. 57: 437-461. Prado DE, PE Gibbs. 1993. Patterns of species distributions in the dry seasonal forests of South America. Ann. Miss. Bot. Gard. 80: 902-927. Robson DS. 1972. Appendix: statistical tests of significance. J. Theor. Biol. 34: 350-352. Santos TG, K Kopp, MR Spies, R Trevisan, SZ Cechin. 2008. Distribuição temporal e espacial de anuros em área de Pampa, Santa Maria, RS. Iheringia (Zool.) 98: 244-253. Santos TG, DC Rossa-Feres. 2007. Similarities in calling site and advertisement call among anuran amphibians in southeastern Brazil. S. Am. J. Herpetol. 2: 17-30. Santos TG, DC Rossa-Feres, L Casatti. 2007. Diversidade e distribuição espaço-temporal de anuros em região com pronunciada estação seca no sudeste do Brasil. Iheringia (Zool.) 97: 37-49. Santos TG, TS Vasconcelos, DC Rossa-Feres, CFB Haddad. 2009. Anurans of a seasonally dry tropical forest: Morro do Diabo State Park, São Paulo State, Brazil. J. Nat. Hist. 43: 973-993. Scott NJ Jr, BD Woodward. 1994. Surveys at breeding sites.
1104
Zoological Studies 51(7): 1094-1104 (2012)
In WR Heyer, MA Donnelly, RW McDiarmid, LAC Hayek, MS Foster, eds. Measuring and monitoring biological diversity - standard methods for amphibians. Washington DC and London: Smithsonian Institution Press, pp. 84-92. SEMA. 2005. Plano de Manejo do Parque Estadual do Turvo. Estado do Rio Grande do Sul. Porto Alegre, Brazil: Secretaria Estadual do Meio Ambiente (SEMA). Silva ET, EP Reis, RN Feio, OP Ribeiro-Filho. 2009. Diet of the invasive frog Lithobathes catesbeianus (Shaw, 1802) (Anura: Ranidae) in Viçosa, Minas Gerais state, Brasil. S. Am. J. Herpetol. 4: 286-294. Silva ET, OP Ribeiro-Filho, RN Feio. 2011. Predation of native anurans by invasive bullfrogs in southeastern Brazil: spatial variation and effect of microhabitat use by prey. S. Am. J. Herpetol. 6: 1-10. Silva FR, DC Rossa-Feres. 2007. Uso de fragmentos florestais por anuros (Amphibia) de área aberta na região noroeste do Estado de São Paulo. Biot. Neotrop. 7: 141148. Silvano DL, MV Segalla. 2005. Conservação de anfíbios no Brasil. Megadiversidade 1: 79-86. Stuart SN, JS Chanson, NA Cox, BE Young, ASL Rodrigues, DL Fischman, RW Waller. 2004. Status and trends of amphibian declines and extinctions worldwide. Science 306: 1783-1786. ter Braak CJF. 1986. Canonical correspondence analysis: a new eigenvector technique for multivariate direct gradient analysis. Ecology 67: 1167-1179. ter Braak CJF, P Smilauer. 1998. CANOCO reference manual and user’s guide to Canoco for Windows: software for canonical community ordination (vers. 4). Ithaca, NY: Microcomputer Power. ter Braak CJF, P Smilauer. 2002. CANOCO reference manual and CanoDraw for Windows user’s guide: software for canonical community ordination (vers. 4.5). Ithaca, NY: Microcomputer Power.
Toft CA. 1985. Resource partitioning in amphibians and reptiles. Copeia 1: 1-21. Uetanabaro M, CPA Prado, DJ Rodrigues, M Gordo, Z Campos. 2008. Guia de campo dos anuros do Pantanal e planaltos de entorno. Cuiabá, Brazil: Editora UFMT, 196 pp. van der Valk AG. 2006. The biology of freshwater wetlands. New York: Oxford Univ. Press, 192 pp. Vasconcelos TS, DC Rossa-Feres. 2005. Diversidade, distribuição espacial e temporal de anfíbios anuros (Amphibia, Anura) na região noroeste do estado de São Paulo, Brasil. Biota Neotrop. 5: 1-14. Vasconcelos TS, TG Santos, DC Rossa-Feres, CFB Haddad. 2009. Influence of the environmental heterogeneity of breeding ponds on anuran assemblages from southeastern Brazil. Can. J. Zool. 87: 699-707. Vasconcelos TS, TG Santos, DC Rossa-Feres, CFB Haddad. 2011a. Spatial and temporal distribution of tadpole assemblages (Amphibia, Anura) in a seasonal dry tropical forest of southeastern Brazil. Hydrobiologia 673: 93-104. Vasconcelos TS, TG Santos, DC Rossa-Feres, CFB Haddad. 2011b. Spatio-temporal distribution of calling male frogs in Morro do Diabo State Park (southeastern Brazil): implications for conservation and management in a seasonally dry tropical forest. S. Am. J. Herpet 6: 107116. Wellborn GA, DK Skelly, EE Werner. 1996. Mechanisms creating community structure across a freshwater habitat gradient. Ann. Rev. Ecol. Syst. 27: 337-3363. Wells KD. 1977. The social behavior of anuran amphibians. Anim. Behav. 25: 666-693. Wells KD. 2007. The ecology and behavior of amphibians. Chicago, IL and London: Univ. of Chicago Press, 1148 pp. Williams DD. 2006. The biology of temporary water. New York: Oxford Univ. Press, 337 pp. Zar JH. 1999. Biostatistical analysis. Upper Saddle River, NJ: Prentice Hall, 663 pp.