Drug Prices and Markets
What Price Data Tell Us About Drug Markets
Jonathan P. Caulkins* Peter Reuter**
Abstract This paper reviews empirical evidence on drug prices and discusses implications for understanding of drug markets and for policy. The most striking characteristics of drug prices are their high levels and extreme variability over time and space. High prices deter consumption but have ambiguous effects on drug-related crime. The consequences of the variability are largely unexplored and are difficult to determine. Conclusions are mixed with respect to the ability of policy to influence prices. Prohibition plus some degree of enforcement can drive prices far above what they would be if drugs were legal. In certain circumstances, interventions can create transient spikes in price or alter the source of drugs by driving up prices from one source relative to another. However, increasing enforcement over and above an already strongly enforced prohibition appears to have only limited ability to drive prices up further.
*
H. John Heinz III School of Public Policy and Management, Carnegie-Mellon University, 5000 Forbes Ave., Pittsburgh, PA 15213-3890. E-mail:
[email protected]. Phone: (412) 268-5064. FAX: (412) 268-7036. ** School of Public Affairs and Department of Criminology, van Munching Hall, University of Maryland, College Park, MD 20742. E-mail:
[email protected]. Phone: (301) 405-6367. FAX: (301) 4034675.
3/17/98
1
Drug Prices and Markets
Introduction Illicit drugs are, ultimately, consumer goods, and like other goods in modern societies they are provided primarily through markets. The markets for illicit drugs have distinctive characteristics with implications for social welfare and for drug policy choices. For example, illicit drugs are enormously valuable per unit weight, so smugglers can afford to employ very sophisticated methods to conceal and transport even modest quantities. The markets are also characterized by small, short-lived, vertically un-integrated and technologically unsophisticated sole proprietorships which generate great violence and disorder. The goal of this paper is to systematically assess the implications of empirically observed regularities in data on drug prices. This rigorous, inductive approach may generate new insights and tests inferences drawn deductively or from journalistic accounts. Much of what we “know” about drug markets has been deduced from knowledge of their basic structure, but such deductions – in the absence of confirmatory evidence – are vulnerable to error. For example, since a kilogram of cocaine in the US is worth about $25,000 one might expect spatial variation in wholesale cocaine prices to be modest in percentage terms. If kilograms of cocaine sold for $6,000 more in Boston than they did in New York City, one would expect arbitrage to shrink quickly the price difference to approximately that of the cost of travel between the two cities. However, such a $6,000 per kilogram difference has persisted for many years (Caulkins, 1995). Similarly, it was once widely believed that the price elasticity of demand for cocaine and heroin must be low because they are addictive substances, but that turns out not to be the case; recent empirical studies show elasticities comparable to those for many familiar consumer goods. Another common source of knowledge about drug markets is generalization from casual empiricism, sometimes amplified by such frequent repetition that the roughest of estimates become enshrined as “mythical numbers”. For example, Singer (1971) observed and Reuter (1984) confirmed that official estimates of the numbers of heroin addicts and crimes committed per addict were implausibly high given the number of crimes actually committed. Likewise, it has been widely believed that crack is cheaper than powder cocaine, but that is not the case (Caulkins, 1997a). So it is important to complement “arm chair” speculation and journalistic accounts with inferences grounded in solid empirical evidence, but why do we focus on price data? Some focus is necessary because of the breadth and complexity of drug-related phenomena. At a practical level, a focus on prices is appealing because price data are relatively abundant and can be disaggregated
3/17/98
2
Drug Prices and Markets
to the municipal or even the neighborhood level (Weatherburn and Lind, 1997). Every time a drug agent makes an undercover purchase we get an observation of the market price, or at least the market price charged to people that dealers do not know personally. Conceptually the focus on price is appealing because a market clearing equilibrium is characterized by price and quantity, and though data pertaining to quantity (specifically the number of users) have received relatively greater attention, they are of low quality and inherently more complicated and expensive to gather. We organize the discussion around four themes: data on price levels, data on price variation, evidence on how policies affect prices, and evidence on how prices affect outcomes of interest. The focus is on US prices because the data are most abundant in the US, but where possible we draw on information about prices elsewhere.
Prices are High Perhaps the most striking observation about illicit drug prices is simply that they are extraordinarily high per unit weight. Gold sells for about $300 per ounce. Marijuana is quite literally worth its weight in gold, selling for $140 - $1,000 per ounce, depending on the quality (ONDCP, 1997a, pp.10-11). Cocaine and heroin are even more expensive, selling for about $100 and $1,100 per pure gram, respectively. Since there are about 28.375 grams in an ounce, the cocaine and heroin sold in retail markets in the US are quite literally one and two orders of magnitude more expensive per unit weight than gold. (ONDCP, 1997b, p.240). The high prices, and dependency potential of these drugs, imply that spending on drugs accounts for a significant fraction of users’ disposable income, particularly for heavier users. Johnson et al. (1985) observed this more than a decade ago, and it continues to be true. Rhodes et al. (1997, p.11) estimate that in 1995 “hardcore” cocaine and heroin users spent a median of $187 and $208 per week, respectively, on their drug of choice. Because of the limited earning opportunities available to typical heavy drug users,1 spending at a rate of $10,000-12,000 per year represents the vast majority of their total outlays. Given how high dollar prices are in absolute terms and relative to disposable income, one would expect drug prices, and changes in those prices, to affect users’ behavior. This would be consistent with the observation that heavy drinkers’ consumption is responsive to the price of 1
E.g., the heroin users interviewed by Boyum and Rocheleau (1994) report median monthly income from legal sources of $522.50 and median illegal income of $500, suggesting an annual income of only slightly more than $12,000. These do not include income transfers from family members and other individuals.
3/17/98
3
Drug Prices and Markets
alcohol (Cook and Tauchen, 1982) and evidence concerning the responsiveness of consumption to changes in price discussed below. The high prices of drugs imply that some of the normal costs of producing and distributing drugs are small relative to the retail price of those drugs. Raw material costs are very low; wholesale prices of cocaine and heroin in source countries are only about 1% of US retail prices.2 This distinguishes drugs from some conventional consumer products (e.g., gasoline and sugar3), but not others. For example, the farm gate price of the wheat in a box of shredded wheat (which is 100% wheat) only accounts for about 2.5% of the retail price of the cereal.4 However, the nature of the costs other than raw material costs are quite different. For illicit drugs, no taxes are paid, conventional shipping costs are negligible,5 and packaging materials account for perhaps 0.25 - 0.5% of the retail price.6 Promotional costs are negligible because, other than stamping bags with a distinctive label, very little marketing is done. There is little or no overhead associated with shelf space as with conventional retail products; even when drug dealers operate out of buildings, the buildings are often abandoned and, at any rate, the drugs are not bulky. Inventory costs are modest.7 Processing costs are low in the source countries, as reflected in the negligible export prices for refined products. In the United States dealers can hire people to convert cocaine powder into crack for about 2% of the value of the cocaine,8 and the cost of diluents and adulterants are negligible.9 2
The DEA (1990) lists source country prices of cocaine in Colombia at $800-$1,600/kg and heroin in Bangkok at $7,000-$11,000/kg. Phone calls to intelligence analysts at DEA confirm that prices as of February 1998 were similar, roughly $1,500 per kilogram for cocaine and $8,000 - $10,000 per “unit” of 700 grams of heroin in Bangkok. 3 A 42 gallon barrel of oil sells on the world oil market for $15 - $20, or $0.36 - $0.48 per gallon; the pump price for a gallon of gas is about $0.95 - $1.20. International prices for bulk shipments of sugar (e.g., 12 - 14,000 mt) are about $0.12/pound for raw and $0.18/pound for refined sugar. Wholesale prices for refined sugar in the US are about $0.27/pound. Five pound bags of sugar are available at the local grocer for $0.40/pound. 4 Farmgate prices of $3.50 per bushel are common. (U.S. Bureau of the Census, 1995, p.688). One bushel of wheat = 60 pounds. A 17.2 ounce box of shredded wheat can be purchased at the local grocery for $2.49. Ignoring any wastage in production, that implies the farm gate value of the wheat in a box of shredded wheat would be $0.06 (about 2.5% of the retail price). 5 FedEx can ship a one kilogram package from Bogota to New York City for $44, which is about 0.2% of the kilogram price of cocaine in New York City. (Price quote obtained by phone, 11/25/97.) 6 Dealers report paying about $2.50 per 100 count for vials and glassine bags used to package drugs for retail sale. Crack is often sold in vials containing $5 “rocks” and heroin in $10 bags. (Caulkins et al., in submission) 7 Even assuming an inventory of 3 months supply (probably mostly held at the upper levels with low, wholesale level replacement costs) and 25% interest rates (reflecting high risk), holding costs would be on the order of 1% of retail sales. 8 Carlson and Siegal (1991, p.12) report that “One cooker claimed that he normally charges a person a $50 piece of crack to rock up an ounce of cocaine.” Since a $50 rock is not usually larger than one-half
3/17/98
4
Drug Prices and Markets
Instead, for illicit drugs, the dominant costs appear to be associated with importing, labor, product and asset seizures, and compensation for the risks of incarceration and physical harm. In the next few pages and ensuing table, we illustrate this assertion with some rough calculations for cocaine in the US.
Import Costs At import, within US borders, cocaine costs about $15,000 per kilogram, up from $1,500 per kilogram in Colombia. Cocaine sells at retail for about $110 per gram (adjusted for purity), which is equivalent to $110,000 per kilogram. Hence, about 12% ($13,500/$110,000) of the retail value is attributable to import costs.
Labor Costs Labor costs are high in part because illegality forces the distribution system to operate in inefficient ways. Drugs are diluted and packaged by hand. Simple machines could do that work at a small fraction of the cost (as is done for mass produced goods such as sugar), except that enforcement makes it risky (i.e. expensive) to maintain dedicated, fixed capital resources. Crews of a half dozen or more are used to staff a single selling “spot.” Only one person actually sells the drug; the others provide protection from robbery, look out for police, and make frequent runs to a hidden cache to replenish supply because it is too risky to maintain large quantities at the point of sale. Reuter et al. (1990) estimate that in 1988 a daily cocaine retailer sold a median of $3,600 worth of drugs each month. These same individuals were estimated to have spent 66 hours per month selling; to earn a median of $7 per hour when working in the licit labor market; and thus to have foregone something like 66 hours * $7/hour = $462 in legitimate earnings per $3,600 sold. Hence, one could view about $462/$3,600 = 13% of the retail value of the cocaine market as
gram, this suggests conversion costs of not more than 2% of the cocaine’s value. In transcripts of interviews with crack sellers, Caulkins et al. (in submission) note that one respondent was paid the equivalent of $40 to cook up crack that sold for $2,000 and another paid someone $100 to cook up 1.25 ounces of cocaine that sold at retail for $6,500, suggesting conversion costs of 2% and 1.5% of retail sales, respectively. 9 Consider the cost of diluents and adulterants for cocaine. In 1992 the average purity of cocaine sold at retail in the US was roughly 76% (ONDCP, 1997). At import, it was roughly 90% pure. Total cocaine consumption was about 290 tons of pure cocaine (Everingham and Rydell, 1994, p.xvi), suggesting that a little over 60 tons of diluents and adulterants were added to the cocaine within the US. Common adulterants and diluents include manitol and inositol (vitamin B-12). Even purchased at retail, these cost on the order of $10 for 100 grams, at which price 60 tons costs just $6 million.
3/17/98
5
Drug Prices and Markets
compensation for retailers’ time. Including costs of labor at higher levels and – to the extent that they are excluded from the Reuter et al. study – support workers (touters, holders, baggers, lookouts, etc.) would no doubt increase this proportion.
Costs of Product and Asset Seizures The Federal-wide Drug Seizure System (FDSS) recorded 98 metric tons of cocaine seizures within the United States in 1995 (ONDCP, 1997). Valued at wholesale prices of $20 25,000 per kilogram, this represents a loss to traffickers of $1.96-2.45 Billion, which is 5-6% of the $38 billion in retail cocaine sales. About $800 million worth of non-drug assets are forfeited to the DEA, Organized Drug Enforcement Task Forces, and US Customs each year,10 which represents about 1.3% of the roughly $60 billion per year market for all illicit drugs (Rhodes et al., 1997). State and local seizures probably account for at least another 1-3.5% of retail sales11, suggesting that seizures of all forms by all levels of government account for about 8-11% of the retail price of cocaine.
Risk Compensation In 1994, drug law violators were sentenced to terms that are expected to lead to about 325,000 person years of incarceration,12 the vast majority of which are associated with drug trafficking. If, on average, a drug dealer required compensation of $43,500 per expected cell year of incarceration,13 that would represent $14.14 billion, or about 23.6% of the $60 billion market for illicit drugs. Reuter et al. (1990) estimate that per year of retail drug selling in Washington, DC, compensation for the risk of death ($10,500) and injury ($2,100) together were about 1.4 times 10
In 1990 the DEA seized more than one billion in assets and forfeited $427 million. ONDCP (1992) reports that Organized Drug Enforcement Task Force seizures in 1992 were valued at $434 million and forfeitures were valued at $110 million. The Sourcebook (1991, p.485) reports that Customs Service arrests were associated with the seizures worth $785 million. If Customs forfeitures were one-third its seizures, total forfeitures for the three agencies would be about $800 million per year. 11 STRIDE data indicate that the Washington DC metropolitan police seized about $5 million worth of cocaine in 1991. Extrapolating that rate to national levels based on Washington DC’s proportion of all drug arrests suggests state and local government seizures have a replacement value of about 1% of retail sales. On the other hand, WEFA (1987) estimated that state and local agency seizures were about half as large as federal seizures. These are probably smaller seizures, on average, than federal seizures and so have somewhat higher replacement costs, suggesting they might be worth about 3.5% of retail sales. 12 From Maguire and Pastore (1997, Tables 5.50, 5.55, 5.58) and assumption that the average time served by felony defendants sentenced to jail is three months.
3/17/98
6
Drug Prices and Markets
greater than that for the risk of incarceration ($9,000). If this same ratio applied nationwide, this suggests that 1.4 * 23.6% = 33% of the retail value of drug sales represents compensation for the risk of injury or death. The national percentage may be lower, however, because Washington DC in 1988 may have been unusually violent for drug dealers; the DC homicide rate was near the top among US cities and the share attributed to drug trafficking by the local police department was very high. The late 1980s was also a time when the cocaine market was still evolving, so that it may have generated very high rates of competitive and transactional violence.
Summary Table 1 summarizes these estimates and supports several observations. First, a little over 50% of the costs can be attributed to risk compensation. Risks incurred represent real costs, but they are not paid in dollar terms, so the accounting profits of dealers (dollar revenues minus dollar costs) can be very large even if the economic profits (revenues minus dollar costs minus dollar value of non-monetary costs incurred) are small. Boyum (1992) observed that this implies dealers are essentially never driven out of business by negative accounting profits, a common reason legitimate businesses close. Second, because of the large non-monetary costs, people who place relatively lower value on such costs have a significant comparative advantage in providing “drug dealing services.” That is, one would expect drug dealing – at least for cocaine, the cost structure may be different for different drugs – to be dominated by people who are relatively less averse to the risks of criminal justice sanction and physical harm. Young, poorly educated, violence prone males are indeed just the ones most often arrested for selling in cocaine and heroin markets; marijuana markets being subject to less pressure from law enforcement and less prone to internal violence have a much broader representation of socio-demographic groups. Third, compensation for the risks of incarceration accounts for about one-quarter of all costs. That is a significant proportion, but it is not the case that incarceration risk is the only cost of consequence.
13
This is the average of the $25,000 - $50,000 per cell year range suggested by Kleiman (1992), updated for inflation.
3/17/98
7
Drug Prices and Markets
Table 1: Estimates of Magnitude of Cost Components for Cocaine Sold at Retail, 1990 Wholesale Price in Colombia 1% Importing of drug 12% Retail labor 13% Higher-level labor ~3% Drug and asset seizures 8-11% Money laundering fees 2-4% Packaging, Processing, and Inventory Costs ~2% Compensation for risk of prison 23.6% Compensation for physical risk 33% Total ~100%
Prices Vary Variation Across Market Levels Next to the high levels of retail drug prices, the most striking observation about illicit drug prices is how widely they vary across market levels, between locations, over time, and from transaction to transaction. The simplest expression of the variation across market levels is that there are substantial quantity discounts for a wide variety of illicit drugs (Caulkins and Padman, 1993). The drugs change hands multiple times between import (or production in the case of domestically produced drugs) and final sale to the user (Caulkins, 1997b). For example, there may be five or six separate sales transactions between a 250 kilogram import of cocaine and the 0.2 gram sale on the street. As one moves down through this distribution hierarchy, transaction sizes get smaller and the price per unit gets larger in a manner which is very well described by a simple power relation (Caulkins and Padman, 1993). Specifically, price per unit is proportional to transaction size raised to a (negative) power. Quantity discounts are familiar from the marketing of many consumer goods, but the discounts are far larger for illicit drugs. These mark-ups have several important implications. First, they affect estimates of how much damage law enforcement does to the drug distribution system by seizing drugs. By weight, most of the drugs seized come from a few large seizures at the higher levels of the distribution system. The cost of replacing drugs at those higher levels is much less than the cost of replacing an equivalent amount at the retail level. That is, there can be a significant difference between the replacement cost of drugs and their retail value. (Reuter, 1988) Second, most of the accounting profits accrue not to a handful of “kingpins” but rather are divided among a large number of low-level dealers. Profit per person is certainly higher for high-
3/17/98
8
Drug Prices and Markets
level dealers than for low-level dealers, but the greatest price increases occur between what the first level wholesale dealer pays his or her supplier and what the user pays the retail seller. With 75% mark-ups, about 67% of total revenues go to those involved in the last two transactions, usually carried out by independent agents who conduct many small transactions. (In recent years the one ounce price of cocaine has been about one-third to one half the 1 gram price.) Third, since retail prices are much greater than those at higher market levels, the ability of enforcement directed at higher market levels to raise retail price depends crucially on how price increases at one level are transmitted to lower levels. The “additive” model predicts that increasing high-level prices by $1/gram will increase the retail price by $1/gram. It assumes that each level of the market is competitive and that the higher purchase price affects no other cost element. The “multiplicative” model predicts that increasing high-level prices by 1% will increase the retail price by 1%. (Caulkins, 1990; Boyum, 1992) This model identifies the threat of robbery and the price of maintaining loyalty of workers as the most important cost elements and ones that are proportional to the value of the goods possessed, not their weight. To illustrate why these two models have vastly different implications for the efficacy of interdiction and high-level enforcement, suppose the import and retail prices are initially X and 10X, respectively. Would a control program that drove the import price up to 2X significantly reduce consumption? According to the additive model, the retail price will rise only from 10X to 11X – a modest increase.14 According to the multiplicative model, on the other hand, if import prices double, retail prices will double, from 10X to 20X, a large enough increase to appreciably affect consumption. Hence, a necessary condition for high-level enforcement to suppress consumption substantially by driving up retail prices is that the multiplicative model holds. Caulkins (1990, 1994a) and Boyum (1992) analyze some historical price data which are more consistent with the multiplicative than the additive model, but they do not test the multiplicative model directly and their data are primarily from kilogram level transactions and below. Near the origins of the distribution chain the multiplicative model does not seem plausible because there are considerable variations in coca leaf prices which are not paralleled (even with a lag) by retail prices. No
14
An increase to 11X is implied by a very literal interpretation of the additive model. Those who have employed the spirit of the additive model in the past (e.g., Reuter and Kleiman, 1986) have recognized that the increase would likely be slightly greater because there are additional inventory carrying costs incurred by those who purchase the more expensive drugs for resale.
3/17/98
9
Drug Prices and Markets
analyses have been done for intermediate market levels (between export in Colombia and the kilogram level within the US) because of insufficient data. A fourth implication of quantity discounts is that one cannot estimate the dollar value of the retail market just by multiplying the quantity consumed by the price per gram; one also needs to consider the distribution of retail purchase sizes. Furthermore, if the retail purchase size distribution changes over time, just multiplying quantity consumed times the price per gram could even distort estimates of trends in the dollar value of the market not just its absolute value. This distortion could have been as large as 40% between the early and late 1980s. (Caulkins, 1994b)
Spatial variation We have already alluded to the fact that there is systematic variation in wholesale prices between cities, implying that there are poor information flows and/or significant transaction costs associated with lateral market transactions. Examining spatial variation in retail prices also yields insights about these markets. Caulkins (1995) found that illicit drug prices within the United States increase as one moves away from the drug sources and that prices are lower in larger markets. For cocaine in particular, the data support the notion that cocaine is distributed through an “urban hierarchy,” in which large cities tend to be “leaders,” with drugs diffusing down through layers of successively smaller surrounding communities. Points of import, such as New York City, are at the top of the hierarchy. Large, cosmopolitan cities such as Philadelphia occupy the first tier below points of import; more regionally oriented cities such as Pittsburgh the second; and smaller cities the third. Of course drug distribution networks do not always follow such a regimented pattern; some cocaine is shipped directly to smaller cities from more distant points of import such as Miami and Houston. Nevertheless, prices show the general pattern of an urban hierarchy. This is consistent with anecdotal observations but stands in marked contrast to common depictions of trafficking paths which suggest that drugs more or less follow the shortest path from place of import to point of retail sale.15,16 The size of lateral transaction costs is interesting. It suggests that it is sensible to speak of local and regional markets. Furthermore, inasmuch as such distinct markets exist, it seems
15
E.g., Raeful Edmonds, once a prominent cocaine dealer in Washington DC, apparently received his drugs from LA, and other dealers have reported supplying the Carolinas from New York City. 16 Interestingly, European wholesale cocaine prices are similarly consistent with a hypothesis of increasing prices as one moves away from the reputed points of import in the Netherlands and the Iberian peninsula (DEA, 1991, p.39).
3/17/98
10
Drug Prices and Markets
plausible that, at least in principle, local interventions might be able to raise prices in the target area. There even seems to be systematic variation in prices between different neighborhoods within one city. As Kleiman (1992) observed, heroin prices are consistently lower in Harlem than in the Lower East Side, just half an hour away by subway. For example, in data from the 1993 domestic monitor program (DEA, 1994), the mean price per pure gram in East Harlem was $0.358/mg vs. a mean price of $0.471/mg on the Lower East Side, a difference that is statistically significant at the 0.05 level.17 These official data are similar to accounts given in interviews with dealers who report that prices in Harlem are lower than those in Greenwich Village but higher than those in Washington Heights.18 The markets may serve different ethnic or demographic groups, so that purchasers may believe (perhaps correctly) that attempting to buy in another market would involve significant danger. On the supply side, the same ethnic differences may be relevant; e.g. Asian wholesalers may be able to operate more cheaply because the police are less capable of penetrating their networks and they can purchase in lower cost Asian producer countries.
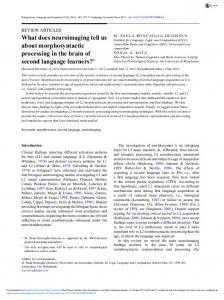
Variation over time Drug prices also vary substantially over time. Figure 1 shows how the inflation-adjusted, gram price of cocaine and heroin fell by 75% between 1981 and 1988. Clearly, a given size cocaine or heroin habit was much more affordable after that decline than it was before. The parallel between the retail prices of cocaine and heroin despite quite different enforcement efforts and developments in source countries is striking and largely unexplained. There may be some demand side equilibration process; perhaps when heroin prices per pure gram are more than about 10-12 times cocaine prices, heroin users shift to cocaine and vice versa. Alternatively, enforcement may be generic, rather than drug-specific, so that over time costs are highly correlated. Figure 1 depicts variation in prices from year to year. There can also be substantial and fairly erratic variations over shorter intervals as Weatherburn and Lind (1997) show for a heroin market in Sydney, Australia.
17
The difference is even sharper in terms of price per street gram (not adjusted for purity) because there is less variability in price per street gram. In particular, the averages are $0.246/mg and $0.338/mg in East Harlem and the Lower East Side, respectively, and the difference is statistically significant at the 0.01 level. The prices for heroin in New York generally are consistently half or less of the estimated price in other cities. 18 Analysis of unpublished transcripts of interviews with dealers from the “Natural History of Crack Distribution/Abuse” project, Bruce D. Johnson, Principal Investigator.
3/17/98
11
Drug Prices and Markets
Figure 1 Retail Cocaine and Heroin Prices per Gram (Heroin Prices Divided by 10 to fit Scale) $600 Cocaine Heroin/10
$500 $400 $300 $200 $100 $0 1980
1982
1984
1986
1988
1990
1992
1994
1996
Variation in purity Purity varies enormously from purchase to purchase even for a given transaction size in a given city and year (Caulkins, 1994; Weatherburn and Lind, 1997). Furthermore, when regressing transaction price on transaction size and purity, the coefficient on purity is very small (Caulkins and Padman, 1993). One interpretation of that is that drug users do not care how pure the drugs they consume are, but that seems odd and would make it difficult to explain why dealers do not dilute drugs even more than is customarily done. An alternative explanation is that, at least at lower market levels, drugs are experience goods. Buyers do not know the purity of the drugs at the time of purchase, so the price is driven by the purity the customer would expect to receive on transactions of this nature (in terms of size, location, time, and other directly observable characteristics). Caulkins (1994) finds evidence for this proposition, and to the extent that it is true, it has several important implications.
3/17/98
12
Drug Prices and Markets
First, if drugs are experience goods, then buyers are exposed to the financial risk of being defrauded or “ripped-off”. Most discussions of risk in drug markets focus on enforcement risk and the risk of violence, but the volatility of drug purity is large enough that financial risks may be important as well. Note that this specific financial risk is borne by the buyer not the seller. Second, the inability to verify easily the quality of the goods transacted creates opportunities for disputes between sellers and buyers. Sellers can defraud customers by claiming the drugs are more pure than they in fact are; buyers can falsely complain to sellers by claiming the drugs were less pure than they in fact were. Given the lack of regulation and inability to resolve disputes through official channels, such disputes could contribute to a substantial amount of violence. 19
Policy and Prices The extraordinarily high prices for cocaine, heroin and marijuana are clearly a function of their illegality. Cocaine, heroin, and marijuana are not scarce in the way diamonds are. They are little more than semi-refined agricultural products like coffee or tea (which can be purchased for $0.37 and $0.52 per ounce, respectively, at the local grocery). A central question is the extent to which it is illegality per se as opposed to enforcement of prohibition that drives these prices. One would expect that, ceteris paribus, more stringent enforcement would lead to higher prices. Some evidence is clearly consistent with this hypothesis. For example, enforcement and sentences in the US are much less stringent for marijuana than for heroin or cocaine20, and penalties are usually more severe for a given amount of heroin than for a similar amount of cocaine. Hence, as expected, heroin is the most expensive and marijuana by far the least expensive of the three drugs. Not all of the evidence fits the overall story so neatly, however. For example, the sharp declines in cocaine and heroin prices illustrated in Figure 1 occurred during a period of increasing
19
Transcripts of interviews with dealers (from Johnson’s “Natural History of Crack Distribution/Abuse” project) record instances in which a dealer beat up a user for complaining that crack purchased the previous day was counterfeit and dealers getting beat up for selling a fake package of drugs (respondents #306 and #319, respectively). 20 This statement reflects penalties per dose, not merely per weight. A marijuana joint is estimated to contain 0.4 grams, compared to about 0.2 grams for a cocaine dose. However federal penalties for cocaine provide for a 5 year minimum for a half kilogram of cocaine and 100 kilograms of marijuana.
3/17/98
13
Drug Prices and Markets
enforcement stringency, as measured for example by expected jail time per gram of cocaine21. To make sense of this conflicting evidence, it is important to remember that policy is not the only determinant of price, to differentiate between the effects of prohibition and increments in enforcement beyond a strictly enforced prohibition, and to distinguish between short term and longer-term equilibrium effects. Besides enforcement, perhaps the most obvious determinant of prices is geography. Heroin is an order of magnitude more expensive than cocaine in the US, but in Europe cocaine and heroin prices are comparable, with cocaine actually being more expensive in Belgium, France, Germany, Italy, the Netherlands, and Switzerland (Farrell et al., 1996). That difference is probably at least as much a consequence of the US being closer to South America than Europe is, both physically22 and in terms of trade and population flows. It is difficult to enumerate all of the factors beyond enforcement that drive prices, but collectively they are considerable. Table 1 suggests that enforcement is directly responsible for only on the order of one-quarter of the price of cocaine. Hence, it is possible for overall price to decline even as enforcement stringency increases if the declines in the other cost-components more than offset the increase in enforcement’s component. For example, import costs might decline as smugglers acquire experience (Cave and Reuter, 1988). Labor costs might decline if the industry shifted to less skilled labor (e.g. from pilots to small boat crew members) or if there was a decline in the prevailing wage for current dealers (e.g. aging dealer/users whose legitimate labor force opportunities weaken as their drug using careers lengthen). Risk compensation for the physical risks of selling drugs could decline if the markets stabilized and the risk of being killed declined. Stares (1996) argues that the trend toward globalization, improved communication and transportation networks, and the persistence of poverty in source countries are enhancing the ability to bring drugs to market cheaply. Even though enforcement is directly responsible for only a modest share of drugs’ prices, it is indirectly responsible for much more by giving force to the prohibition. The fact that the illicit drugs are illegal goes a long way toward explaining why drugs are distributed in such costly and inefficient ways. This effect has been termed the “structural consequences of product illegality” (Reuter, 1983). 21
The estimates of total consumption reported by Rhodes et al. (1997) for the period 1988-1995 show a decline for cocaine from a peak of 386 tons in 1989 to 304 tons in 1995, during which period the annual cell years for cocaine offenses probably quintupled.
3/17/98
14
Drug Prices and Markets
But prohibition in and of itself does not necessarily drive prices up; sports bookmakers offered the same prices as are now available from Las Vegas bookmakers for betting on baseball or football. Clearly prohibition with some enforcement behind it that can have such an effect, but it is not clear how much enforcement is “enough” to keep prices high. Apparently the level of prohibition and enforcement associated with US alcohol prohibition was not enough since prices were only moderately higher during prohibition (Miron, 1997). Evidently, the level of enforcement pursued by all the industrial nations for the last several decades has been enough to keep heroin and cocaine prices far above legal levels, but there’s a huge gap in enforcement intensity between those examples. A completely distinct question concerns the effect on prices of increments in enforcement above and beyond a fairly strictly enforced prohibition. Here the answer clearly depends on whether one is interested in transient or long term effects. Specific enforcement interventions have created spikes in prices. Perhaps the greatest success was when the combination of the Turkish Opium ban, the breaking of the “French Connection” case, and Mexican opium eradication efforts substantially drove up purity-adjusted heroin prices during the mid to late 1970’s, before Asian heroin filled the gap. (Reuter, 1985) The greatest success with cocaine was the result of a combination of US efforts and the “war” between the Colombian government and the Medellin-based traffickers in 1989 which led to a sharp (50100% at its peak) but short-lived (about 18 month) increase in cocaine prices. (Caulkins, 1994a) More recently, in 1995 Peruvian air force interdiction of the “air bridge” to Colombia led to a smaller but identifiable increase in cocaine prices (peak increase in prices of 50%, which disappeared within a year). (Crane et al., 1997) These transient price increases can, at least in some cases, have meaningful effects on drug use and consequences. The heroin scarcity in the 1970s is temporally correlated with the ebbing of the heroin epidemic (DuPont and Greene, 1973), and emergency room and medical examiner mentions declined in parallel with higher cocaine prices in 1989-1990 (ONDCP, 1992). The price increases and associated benefits do not last, however, because suppliers react to market disruptions by modifying their tactics and operations. There are many examples of such adaptation; Reuter (1988) cites three: reductions in the size of maritime marijuana shipments in response to increased interdiction, cocaine smugglers’ shifting routes to use Mexico as a transshipment point, and a shift to maritime cocaine smuggling in response to aggressive air 22
The Mexican border provides a cheap entry point that has no counterpart for cocaine coming into
3/17/98
15
Drug Prices and Markets
interdiction. There is also adaptation in the source of drugs. At one time or another over the last 25 years, four different regions have been the principal supplier of heroin to the US (Mexico, South America, Southwest Asia, and Southeast Asia). Similarly, Colombia quickly replaced Mexico as the principal supplier of marijuana to the US in response to paraquat spraying and fears of adverse health-effects of using sprayed marijuana (Kleiman, 1992). As a result of these and other types of adaptation, the long-run, or equilibrium effects of increments in enforcement are more modest. This is predicted by so-called “risks and prices” analyses (Reuter and Kleiman, 1986; Rydell and Everingham, 1994; Caulkins et al., 1997). It is seen empirically in the lack of correlation between increases in federal enforcement and increases in cocaine or heroin prices on a month-by-month basis (Yuan and Caulkins, forthcoming), and the fact that crack and powder consistently sell for the same price per pure unit even though federal sanctions for crack are more stringent than for possession of a comparable amount of powder cocaine (Caulkins, 1997a).23 Indeed, the very fact that cocaine and heroin prices fell during a period of increasing enforcement stringency is an indication of the limitations of enforcement in this regard. Thus, it would appear that four broad statements can be made about how policy affects prices. (1) Prohibition plus some modest but nontrivial amount of enforcement can drive prices far above their legal levels. (2) Interventions can create short-run scarcity that leads to substantial price increases with corresponding benefits. (3) Enforcement can create price-differentials between different sources of drugs, thereby shifting distribution patterns. (4) The marginal ability of additional enforcement to drive up equilibrium prices beyond the levels created by prohibition plus stringent enforcement is less than its average ability.
Prices and Outcomes Any discussion of how prices affect outcomes must begin with the price elasticity of demand, which measures the percentage change in consumption associated with a one percent change in price. If a 1% increase in price leads to a greater than one percent change in consumption, demand for the good is termed “elastic”; if less than one percent, demand for the good is called relatively inelastic. Europe; small plane and small boat importing is also not feasible for European cocaine smuggling. 23 Of course sanction given conviction is only one of several determinants of enforcement risk, so it is still conceivable that the risks per transaction are no higher for crack than for powder cocaine.
3/17/98
16
Drug Prices and Markets
There is considerable empirical evidence that prices affect consumption not only of idealized, perfectly rational actors, but also of patients in psychiatric institutions, animals (Kagel et al., 1981), and users of the two licit addictive substances, cigarettes and alcohol (see literature review by Manning et al., 1991). Early quantitative estimates of the elasticity of demand for illicit goods produced widely varying results. Nisbet and Vakil (1972) estimated the price elasticity of demand for marijuana among UCLA students to be between −0.41 and −1.51. Roumasset and Hadreas (1977) believed that, in Oakland, the price elasticity of demand for heroin was −1. Silverman and Spruill (1977) estimated an elasticity of demand of −0.22 for heroin in Detroit. Moore (1977) argued that, in New York, tacit coordination among suppliers kept the price at a level such that demand was elastic. White and Luksetich (1983) pointed out that the observed elasticity depends not just on the nature of demand, but also on the market structure and the extent of monopolistic control. More recent estimates, while by no means entirely concordant, paint a consistent picture of elasticities of demand that are rather larger than some might initially expect. van Ours (1995) estimated short and long run elasticities of demand for pre-World War II opium consumption in the Dutch East Indies (−0.7 and −1.0, respectively). Using survey data on the household population, Saffer and Chaloupka (1995) estimate elasticities for cocaine of between −1.10 and −0.72, and for heroin between −1.80 and −1.60. Using survey data on use by young adults as reflected in the Monitoring the Future study, Grossman et al. (forthcoming) estimate an elasticity of demand of − 1.35. Caulkins (1996) estimates that for arrestees, a group responsible for much of the social harm related to drugs, elasticities of demand for cocaine are between −1.50 and −2.0. There is also reason to believe that consumption is more responsive to price changes in the long run than it is initially. Becker et al. (1994) found such a difference between short and long run elasticities in the demand for cigarettes (estimates of −0.4 and −0.75, respectively). The longrun elasticity could be greater because prices affect not just how much the average drug user consumes but also the prevalence of use. For example, Saffer and Chaloupka (1995) estimate elasticities of participation for heroin of about −0.9 to −0.8 and a participation price elasticity for cocaine of about −0.55 to −0.36. Likewise, even though Bachman et al. (1988, 1990) find that trends in use among youth as reflected in the Monitoring the Future surveys are not highly correlated with self-reports of “availability”, Grossman et al. (forthcoming) using the same data estimate that a permanent 10 percent reduction in price would lead to a 10% increase in the number of users and a 3% increase in the frequency of use.
3/17/98
17
Drug Prices and Markets
Although drug use is the most obvious outcome of interest, many aspects of “the drug problem” including most drug-related crime are driven by the dollar value of the black. In particular, Caulkins et al. (1997) estimate that, in Goldstein’s terms, only about one-sixth of drugrelated crime and violence is driven directly by drug use (i.e., “psychopharmacological” drugrelated crime), whereas five-sixths is motivated primarily by drug money (roughly one-third is “economic-compulsive” and one-half is “systemic”). If drugs were not enormously valuable per unit weight and if large quantities were not sold, then the incentives for violence, whether to protect territories or punish cheating, would be modest. The same can be said for corruption of authorities; high prices provide the incentive for paying police to overlook violations, and it is the total dollar volume that provides the means for doing so. The incentive of organized crime to enter these activities also is positively affected by price and quantity. Policies which suppress use by driving up price will tend to have a less beneficial effect on drug-related crime and corruption (in percentage terms) than they have on drug use.
Conclusions This essay has examined what price data tell us about drug markets, but it is worth pausing to reflect as well on how much they tell us. Certainly they tell us a great deal, some but not all of which is reflected in policy debates. At the same time much remains unknown. Given the number of instances in which deductive arguments have been promulgated with great confidence only to be refuted by empirical evidence, it seems wise to be somewhat cautious in drawing conclusions that go beyond the scope of the data. Although some of what is not known is probably unknowable – at least in the medium term – there are considerable opportunities for expanding the range of questions which have been addressed empirically. Price data are much more accessible than data pertaining to prevalence or quantity. A relatively modest investment of resources could substantially increase both the quantity and the quality of the price data available for analysis. The easiest way to increase the quantity of price data would be to collect centrally information on all undercover purchases made by agents in all agencies at the state, local, and federal level. Currently the STRIDE system includes only data from samples analyzed by DEA
3/17/98
18
Drug Prices and Markets
laboratories, principally those collected by federal agencies and the Washington DC metropolitan police. Such an expansion would be enormously valuable, but there are inevitably limitations associated with analyzing administrative data that are produced as a byproduct of other operations. There would seem also to be room for a program whose explicit and primary goal was gathering price information, whether from undercover buys, ethnographic interviews, and/or self-report surveys.
3/17/98
19
Drug Prices and Markets
REFERENCES Bachman, J., L. Johnston, and P. O’Malley (1988) Explaining the Recent Decline in Marijuana Use: Differentiating the Effects of Perceived Risks, Disapproval, and General Lifestyle Factors, Journal of Health and Social Behavior, Vol. 29, pp.92-112. ________. (1990) Explaining the Recent Decline in Cocaine Use Among Young Adults: Further Evidence that Perceived Risks and Disapproval Lead to Reduced Drug Use, Journal of Health and Social Behavior, Vol. 31, pp.173-184. Becker, Gary S., Michael Grossman, and Kevin M. Murphy (1994) An Empirical Analysis of Cigarette Addiction, The American Economic Review, Vol. 84, No. 3, pp.397-418. Boyum, David Anders (1992) Reflections on Economic Theory and Drug Enforcement, unpublished Ph.D. thesis in public policy, Harvard University, Cambridge, MA. Boyum, David and Ann Marie Rocheleau (1994) Heroin Users in New York, Chicago, and San Diego, Office of National Drug Control Policy White Paper, Washington, DC. Brown, G.F. and P. Silverman (1974) Retail Price of Heroin: Estimation and Applications, J. American Statistical Association 69 (347 September) pp.595-606. Bureau of Justice Statistics, (1991) Correctional Populations in the United States, NCJ-142729 (Washington, DC: USGPO). ________. (1994) Drugs and Crime Facts, 1993, NCJ-146246 (Washington, DC: USGPO). Carlson, Robert G. and Harvey A. Siegal (1991) The Crack Life: An Ethnographic Overview of Crack use and Sexual Behavior Among African-Americans in a Midwest Metropolitan City, Journal of Psychoactive Drugs. Vol. 23, No. 1, pp.11-20. Caulkins, J. (1990) The Distribution and Consumption of Illicit Drugs: Some Mathematical Models and Their Policy Implications, unpublished Ph.D. thesis in operations research, Massachusetts Institute of Technology, Cambridge, MA ________. (1994a) Developing Price Series for Cocaine, Corporation, Santa Monica, CA.
MR-317-DPRC, The RAND
________. (1994b) What is the Average Price of an Illicit Drug?, Addiction, Vol. 89, pp. 815819. ________. (1995) Domestic Geographic Variation in Illicit Drug Prices, The Journal of Urban Economics, Vol. 37, pp.38-56. ________. (1996) Estimating the Elasticities and Cross Elasticities of Demand for Cocaine and Heroin, Carnegie Mellon University, Heinz School Working Paper 95-13. ________. (1997a) Is Crack Cheaper than (Powder) Cocaine?, Addiction, Vol. 92, No. 11, pp..
3/17/98
20
Drug Prices and Markets
________. (1997b) Modeling the Domestic Distribution Network for Illicit Drugs, Management Science, Vol. 43, No. 10, pp.1364-1371. Caulkins, Jonathan P., Bruce Johnson, Angela Taylor, and Lowell Taylor. Draft. “What Drug Dealers Tell Us About Their Costs of Doing Business.” Caulkins, Jonathan P. and Rema Padman (1993) Quantity Discounts and Quality Premia for Illicit Drugs, The Journal of the American Statistical Association. Vol. 88, No. 423, pp.748-757. Cave, Jonathan and Peter Reuter (1988) The Interdictor’s Lot Santa Monica, CA, RAND Cook, P. and G. Tauchen (1982) The Effect of Liquor Taxes on Heavy Drinking, The Bell Journal of Economics, Vol. 13, No. 2, pp.379-390. Crane, Barry D., A. Rex Rivolo, and Gary C. Comfort (1997) An Empirical Examination of Counterdrug Interdiction Program Effectiveness, Institute for Defense Analysis, IDA Paper P3219. Drug Enforcement Administration (DEA) (1990) Intelligence Trends: From the Source to the Street, Vol. 17, No. 1. ________. (1991) Worldwide Cocaine Situation, 1990, US Department of Justice, Washington, DC. ________. (1994) Domestic Monitor Program: 1993 Annual Summary, US Department of Justice, Washington, DC. DuPont, Robert L. and Mark H. Greene (1973) The Dynamics of a Heroin Addiction Epidemic, Science, Vol. 181, pp.716-722. Farrell, Graham, Kashfia Mansur, and Melissa Tullis. (1996) Cocaine and Heroin in Europe: A Cross-national Comparison of Trafficking and Prices, The British Journal of Criminology, Vol. 36, No. 2. Goldstein, Paul J. (1985) The Drugs/Violence Nexus: A Tripartite Conceptual Framework, Journal of Drug Issues, Fall, pp.493-506. Grossman, Michael, Frank J. Chaloupka, and Charles C. Brown (forthcoming) The Demand for Cocaine by Young Adults: A Rational Addiction Approach, forthcoming in the Journal of Health Economics. Johnson, B. et al. (1985) Taking Care of Business: The Economics of Crime by Heroin Abusers. Lexington: D.C. Heath. Kagel, J., Battalio, R., Rachlin, H. and L. Green (1981) Demand Curves for Animal Consumers, Quarterly Journal of Economics, Vol. 96, pp.1-15. Kleiman, Mark A.R. (1992) Against Excess: Drug Policy for Results. New York: Basic Books.
3/17/98
21
Drug Prices and Markets
Maguire, Kathleen and Ann L. Pastore, eds. (1997) Sourcebook of Criminanl Justice Statistics 1996. US Department of Justice, Bureau of Justice Statistics. Washington, DC: USGPO. Manning, Willard G., Emmett B. Keeler, Joseph P. Newhouse, Elizabeth M. Sloss, and Jeffrey Wasserman (1991) The Costs of Poor Health Habits. Cambridge, MA: Harvard University Press. Moore, M. (1973) Achieving Discrimination on the Effective Price of Heroin, American Economic Review Vol. 63, May pp.270-277. Moore, Mark H. (1977) Buy and Bust. Lexington, MA: Lexington Books. Nisbet, Charles T. and Firouz Vakil (1972) Some Estimates of Price and Expenditure Elasticities of Demand for Marijuana Among U.C.L.A. Students, Review of Economics and Statistics, Vol. 54, pp.473-475. Office of National Drug Control Policy (1992) Price and Purity of Cocaine: The Relationship to Emergency Room Visits and Deaths, and to Drug Use Among Arrestees. Washington DC, Office of National Drug Control Policy. Office of National Drug Control Policy (1997a) Pulse Check: National Trends in Drug Abuse, Summer, Washington DC, Office of National Drug Control Policy Office of National Drug Control Policy (1997b) The National Drug Control Strategy, 1997: Budget Summary, Washington DC, Office of National Drug Control Policy Reuter, P. and M. Kleiman (1986) Risks and Prices: An Economic Analysis of Drug Enforcement, in Tonry, M. and N. Morris (eds.) Crime and Justice: An Annual Review of Research Vol 7, Chicago: University of Chicago Press. Reuter, Peter, MacCoun, Robert and Patrick Murphy (1990) Money from Crime: A Study of the Economics of Drug Dealing in Washington, DC, Santa Monica, RAND. Reuter, Peter (1983) Disorganized Crime: The Economics of the Visible Hand Cambridge, MA., MIT Press. Reuter, Peter (1984) The (Continued) Vitality of Mythical Numbers, The Public Interest, no. 75, 135-147. Reuter, Peter (1985) Eternal Hope: America’s International Narcotics Efforts, The Public Interest, Spring. Reuter, Peter (1988) Quantity Illusions and Paradoxes of Drug Interdiction: Federal Intervention into Vice Policy, Law and Contemporary Problems, Vol. 51, No. 1, pp.233-252. Rhodes, William, Paul Scheiman, Tanutda Pittayathikhun, Laura Collins, and Vered Tsarfaty (1995) What America’s Users Spend on Illegal Drugs, 1988-1993. Office of National Drug Control Policy, Washington, DC.
3/17/98
22
Drug Prices and Markets
Roumasset, James and John Hadreas (1977) Addicts, Fences, and the Market for Stolen Goods, Public Finance Quarterly. April, pp.247-272. Rydell, C. P. and S. S. Everingham (1994) Controlling Cocaine: Supply vs. Demand Programs. RAND, MR-331-ONDCP/A/DPRC, Santa Monica, CA. Saffer, Henry and Frank Chaloupka (1995) The Demand for Illicit Drugs, Working Paper No.5238, National Bureau of Economic Research, Cambridge, MA. Silverman, Lester P. and Nancy L. Spruill (1977) Urban Crime and the Price of Heroin, Journal of Urban Economics. Vol. 4, pp. 80-103. Singer, M. (1971) The Vitality of Mythical Numbers, The Public Interest, no. 23, pp.3-9. Stares, Paul B. (1996) Global Habit: The Drug Problem in a Borderless World. Washington, DC: Brookings Institution. US Bureau of the Census (1995) Statistical Abstract of the United States: 1995 (115th edition.) Washington, DC: US Government Printing Office. US Department of Justice (1992) Drugs, Crime, and the Justice System: A Report from the Bureau of Justice Statistics, Washington, DC: US Government Printing Office. van Ours, Jan C (1995) The Price Elasticity of Hard Drugs: The Case of Opium in the Dutch East Indies, 1923-1938, Journal of Political Economy. Vol., 103, No. 2, pp.261-279. Weatherburn, Don and Bronwyn Lind. (1996) The Impact of Law Enforcement Activity on a Heroin Market, Addiction, Vol. 92, No. 5. White, Michael D. and William A. Luksetich (1983) Heroin: Price Elasticity and Enforcement Strategies, Economic Inquiry. Vol. XXI, October, pp.557-564. Yuan, Yuehong and Jonathan P. Caulkins (forthcoming) The Effect of Variation in High-Level Domestic Drug Enforcement on Variation in Drug Prices, Socio-Economic Planning Sciences.
3/17/98
23