minneapolis, minnesota, usa • 20-25 april 2002
Paper: Contextual Displays
Where Do Web Sites Come From? Capturing and Interacting with Design History Scott R. Klemmer 1, Michael Thomsen 2, Ethan Phelps-Goodman 1, Robert Lee1, James A. Landay 1 1
Group for User Interface Research Computer Science Division University of California Berkeley, CA 94720-1776, USA
[email protected]
ABSTRACT
To form a deep understanding of the present; we need to find and engage history. We present an informal history capture and retrieval mechanism for collaborative, earlystage information design. This history system is implemented in the context of the Designers’ Outpost, a wall-scale, tangible interface for collaborative web site design. The interface elements in this history system are designed to be fluid and comfortable for early-phase design. As demonstrated by an informal lab study with six professional designers, this history system enhances the design process itself, and provides new opportunities for reasoning about the design of complex artifacts. Keywords
history management, design rationale, activity capture, web design, sketching, informal interfaces, tangible UI, CSCW . INTRODUCTION
To form a deep understanding of the present, we need to find and engage an account of the past. People invested in understanding the trajectory of history from the past to the present include decision makers, students, designers, and their successors. These stakeholders engage history through creation, revision, and reflection. In this paper, we present an informal history capture and retrieval mechanism that supports these activities for collaborative, early-stage information design. A video of the system is available at http://guir.berkeley.edu/projects/outpost/video/History.asx. We present three mechanisms for accessing design history: a main timeline, a local timeline, and a synopsis view. The main timeline is a visually navigable set of design thumbnails organized on a timeline. This view can be filtered by activity (By Actions, By Bookmarks, or By Permission to make digital or hard copies of all or part of this work for personal or classroom use is granted without fee provided that copies are not made or distributed for profit or commercial advantage and that copies bear this notice and the full citation on the first page. To copy otherwise, or republish, to post on servers or to redistribute to lists, requires prior specific permission and/or a fee. CHI 2002, April 20-25, 2002, Minneapolis, Minnesota, USA. Copyright 2002 ACM 1-58113-453-3/02/0004…$5.00.
2
Department of Computer Science University of Aarhus Aabogade 34 8200 Aarhus N, Denmark
[email protected]
Meeting) or by inferred properties (By Time, By Note, or By Author). We employ a branched history, presenting the current branch to the user as a linear history. This linear history is annotated with stubs, indicating the existence and position of other branches. It is possible for users to jump to any point on the timeline, including semantic places such as when an object was created. The local timeline enables users to see, in the actual design, a history with just the actions relating to an individual object in the design. The synopsis view enables post-design review of key bookmarks. These bookmarked states can be annotated with text, and printed as hard copy for easy portability and sharing. We designed the history system around a set of scenarios that we distilled from design fieldwork studies. We present four here: 1) reaching an unproductive point, and heading off in a new direction from an earlier point; 2) writing a summary of a design session; 3) finding the rationale behind a decision; 4) creating a set of action items from a design session. In addition to supporting web design in a collaborative wall-scale system, our work on design history should in many aspects be transferable to other professional practices that center on the creation of an artifact by several individuals over an extended period of time. We thus hope that this work will inspire research on tools for other professional domains as well. The Designers’ Outpost: Collaborative Design
Our history system is built as an extension of the Designers’ Outpost [7], a tool that supports information design for the web. In our previous studies into web design, we found that pens, paper, walls, and tables were often used for explaining, developing, and communicating ideas during the early phases of design. Outpost embraces and extends this paper-based practice through a large electronic wall with a tangible user interface (see Figure 1). Users have the same fundamental capabilities in the Outpost system as in a paper and whiteboard system. One can create new pages by writing on new Post-it notes, add them to the electronic wall and organize a site by physically
Volume No. 4, Issue No. 1
1
Paper: Contextual Displays
CHI
changing the world, changing ourselves
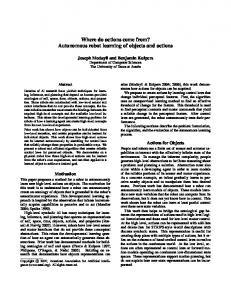
Figure 2. The two cameras used to track and capture physical documents in Outpost. Figure 1. Users’ view of history in the Designers’ Outpost, a system for collaborative web design. Outpost runs on a touch sensitive SMART Board augmented with physical Post-it notes.
maintaining a separate rationale representation in parallel with the design itself. VKB: History in Hypertexts
moving Post-it notes around on the board. Paper in the physical world becomes an input device for the electronic world. A rear camera mounted inside the board captures the location of notes, detecting when notes are added, removed, or moved. A front camera captures the contents on the physical notes so that electronic counterparts can be created by means of a rear-mounted projector that outputs electronic information back onto the wall surface in the physical world (see Figure 2). For our history system, we preserved this basic system as a platform, radically extending the electronic output possibilities of the system to support design history. RELATED WORK
Our work is inspired by both the work in design rationale and in capture and access applications. Design Rationale
Much of our thinking about design history is motivated by Design Rationale: Concepts, Techniques, and Use, edited by Moran and Carroll [11]. The sixteen contributed chapters characterize the primary goal of design as giving shape to artifacts—design products— yet underscoring that “the artifact is a concrete form that does not (except in very subtle ways) manifest this process of creation.” Semi-Formal Design Rationale: IBIS and QOC
A number of design rationale systems have been proposed in the past, such as the seminal IBIS [17] system in the 1970s, and more recently, QOC [10]. These systems employ semi-formal syntaxes to capture design rationale in the form of argumentation surrounding decisions made during a design process. These systems have not caught on with designers, possibly because they impose a rigid structure on design thinking and burden designers with creating and
2
Volume No. 4, Issue No. 1
The VKB system [18] introduces the notion of “constructive time,” which is the reader’s experience of accessing a history in a hypertext. Our third scenario, finding the rationale behind a design decision, draws inspiration from the VKB notion of history being created for the benefit of an external viewer. Our By Meeting filter is implemented in a similar fashion to the VKB meeting discretization. History through Capture and Access
Our focus on informal interaction [9] leads us to shy away from structured approaches and borrow from another thread of research, informal meeting capture. Informal capture systems attempt to collect information from users in natural ways, i.e., information that they are producing in the normal course of their activities, and attempt to structure it in useful ways for later retrieval. The Classroom 2000 project [1] captures information from multiple sources including audio and video of classroom lecturers, ink from students’ notes and annotations, and lecturers’ presentations slides. This information is then merged and indexed in order to support students’ task of reviewing lecture notes. The AudioNotebook [20] and the Dynomite system [21] both focus on personal information capture, and on offering users ways of browsing histories. Although they are concerned with audio, their techniques for creating inferred bookmarks inspired us. AudioNotebook’s technique of creating bookmarks based on change in pitch or pausing inspired us to add inferred filters in our history system, and Dynomite’s ink properties inspired us to add author information to created notes. Outpost differs from these systems in that it is designed to support collaborative, rather than individual, practice.
minneapolis, minnesota, usa • 20-25 april 2002
Paper: Contextual Displays
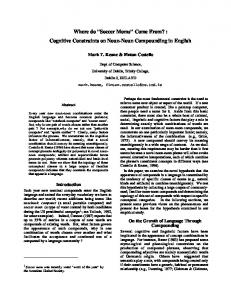
Figure 3 (top). The global timeline at the bottom of the SMART Board. The pop-up menu lets users choose available filters. ‘Bookmark’ adds the current state to the synopsis. ‘Bookmark Timeline’ adds all states in the current view to the synopsis. ‘Filter Further’ allows users to intersect filters. Figure 4 (right). Close-up of the global timeline. Above each thumbnail is a time-stamp. The main thumbnail is a scaled down version of the board, with the changes highlighted in green. The frame around future thumbnails is dark blue, past medium blue, and current light blue.
The CORAL [12] system captures and coordinates data from multiple sources such as audio and whiteboard notes to support meeting capture. These systems share with Classroom 2000 a task-oriented focus on visualizations to support later retrieval.
their design came to be, or they would alter their design and then realize that they preferred an older design. These studies both gave us insight into the working practice of web designers, and motivated our focus on better supporting design history.
The visual design of our global timeline is inspired by the Chimera graphical editor [8], that introduced the comic strip metaphor for displaying a history of changes. Chimera also used highlighting to focus on the parts that changed in each frame. Our timeline extends the design in Chimera with numerous ways of filtering the displayed frames, and with display of branched history.
HISTORY INTERFACE
In the WeMet system [15]a distributed, collaborative drawing systemthe history is also automatically captured. According to the authors this allows users to “reconstruct the present,” and among other things allows parties that join work in progress to review the work performed by the other participants so far. WeMet inspired us to include explicit bookmarks in the history. FIELD AND DESIGN STUDIES
Before building this history system, we conducted and learned from field and design studies. Newman and Landay [14] interviewed eleven professional web site designers, providing us with two important insights. First, designers create many different intermediate representations of a web site. Second, “Designers expressed a desire to have a unified way to manage different variations of design ideas. Variations play a key role during the design exploration phase, and it would behoove an effective design tool to help support their creation and management.” During the creation of the Designers’ Outpost, we conducted a design study with fifteen professional web site designers, which guided the design of the basic system as described in [7]. It became evident though, that the designers really needed support for design history: They stated that they often forgot the history of how some part of
To promote design history, we have made the history a first-class citizen (as in Timewarp [3]), while keeping the design history as a relatively calm entity that does not distract from the main design work at hand. Our system provides three facilities for interacting with design history: a main timeline, a local timeline, and a synopsis view. We describe the functionality of each of these and then illustrate their utility in the context of the scenarios presented previously. Timeline Visualization
The main timeline displays a history of the design using thumbnails, as seen in Figure 3. Each thumbnail presents the contents of the board at the time of capture. To support the user in determining what has changed between adjacent frames, we highlight the elements that were altered in the most recent frame (see Figure 4). Filtering Thumbnails
Designers use the timeline display to choose the set of thumbnails to display. In the most detailed view, the timeline displays all thumbnails—one thumbnail per single action the users have performed at the board, such as adding a note or moving a relation. View all is useful for local undo, but more substantive interactions mandate using our other filters. These filters can be divided into activity filters and inferred filters. The activity filters are based on explicit actions made by the user and include show By Actions, By Bookmarks, and By Meeting. For each of these, the user can select to have a thumbnail generated for every n Bookmarks, Actions, or Meetings.
Volume No. 4, Issue No. 1
3
CHI
Paper: Contextual Displays
changing the world, changing ourselves
5 Figure 5 (top). The main timeline, with an expanded strand containing a collapsed strand. Figure 6 (middle). Physical jog dial for scrolling through history. Figure 7 (right). The electronic context menu for physical objects. The bottom element in the menu is the local timeline. In this case, the note was created, the note was moved, and a link drawn.
Inferred filters are more advanced, allowing a user to filter on properties that she did not explicitly set herself; they include show By Time, By Note, and By Author. In the By Time filter, the user chooses to only see frames that correspond to actions carried out every n seconds. With the By Note filter she can select a note on the board to view only frames that correspond to actions performed on or in relation to that note. Finally, when using the By Author filter only frames that correspond to notes that were altered by the chosen author are displayed. The By Author filter is one example of many possible context-sensitive history queries. Here, the system needs to sense who is the author of each operation. Although this could be implemented using an RFID tag and a reader behind the board, we currently simulate this using a Wizard of Oz approach: during design sessions an operator indicates the person currently at the board in a simple list of names shown on a secondary monitor. Timeline Navigation
Thumbnails not only display information about the state changes of the board, they also provide a directmanipulation interface for navigating the design history: By clicking on any thumbnail, the system undoes or redoes all commands that have been issued since that point in time, restoring the board to that state. This multi-level undo/redo allows designers to experiment with the information design, as they know that they can always return to a previous state (see Figure 5). While the electronic touch interface works very well for selection, we found operating electronic GUI widgets clumsy for scrolling and browsing. To support more fluid scrolling, we integrated a Contour Design USB jog dial (see Figure 6) for direct physical interaction with our system. While our studies have shown many benefits to a papercentric tangible interface for freeform design, the physicality of a design artifact becomes problematic when engaging its history: It is not possible for the system alone to perform an undo operation for all possible physical actions made by the user, such as adding or removing a note from the board. In our system, a combination of user actions and history manipulations can yield one of two degenerate cases: either the current view calls for
4
Volume No. 4, Issue No. 1
6
7
presenting an object without a physical presence, or there is a physical object that should not be present. In the former case, we display the electronic capture of the object. In the latter, we give the object a red shadow to indicate it should not be present, hinting that it should be removed by the user. Branched Time Visualization
As mentioned above, the system supports multi-level undo/redo. One simple example of multi-level undo/redo is the functionality present in Microsoft Office. This functionality does allow unlimited undo and redo, but one major problem is that only one strand of actions is held in the history. If the user performs actions A, B, C, D, E, undoes three times, and then performs actions F and G (the sequence shown in Figure 8), the current action strand in the history is A, B, F, G. The fact that C, D, and E used to follow B is lost in a linear history. Some undo/redo systems, such as the one in Emacs [19], offer the user a truly branched history. Branched histories have traditionally been difficult to navigate; the user is likely to get lost because they will have a difficult time building an accurate and complete mental model of the history tree. Our goal was to preserve the entire history, with all constituent action strands, without introducing unwieldy complexity. We achieved this by merging the concept of a branched action history with the linearity of a single stranded history. One possible way of presenting the branched history is as a branched tree as in Figure 8. While this way of displaying the multiple strands presents the whole history and its two constituent strands, the visualization rapidly becomes complex as the number of branches increases. This complexity is too large a user burden to incur for our domain of informal, early stage design. As a lighter weight alternative, we present the history as a linear list of actions, where inactive branches are represented by a collapsed stub, as illustrated in Figure 5. This presentation preserves the time-wise order of the actions; a frame presented to the right of another frame corresponds to an action that was issued after the other. It also scales well; multiple branches can be shown inside each other by nesting the stub parenthesis markers as
minneapolis, minnesota, usa • 20-25 april 2002
Paper: Contextual Displays
Figure 8. Branched history: Actions A, B, C, D, and E form one strand; A, B, F, and G form the other.
shown along the bottom of Figure 9. Users can open or close (collapse) any branch, choosing a presentation of the timeline relevant to the objects he is interested in. Local Timeline Visualization
The main timeline visualizes the history for the whole board; the local timeline provides a lighter weight history for an individual object. When selecting a note by tapping it, an object menu is displayed (see Figure 7). The object menu supports both common operations such as deleting the note or making it persistent, as well as displaying a small note history along the bottom. This novel in situ timeline offers the user more detailed information about a particular note without visually cluttering the entire board . Synopsis Visualization
One advantage of electronic capture is its ability to support radically different visualizations. When interacting with a design history, it is important to create a list of states and then view that list. We provide the ability to work with this list electronically (see Figure 10) or printed on paper (see Figure 11). Users may not always be at the board; a printout serves as a take-away design record that they can share, discuss and write on. The synopsis visualization fills these needs.
Figure 9. Stub-branching history presentation: the top history fully displays the current strand; other strands are visualized as stubs. The bottom history displays the full history; states not part of the current strand are placed between brackets.
A synopsis can be constructed in two ways. First, it can be constructed via explicit user bookmarks. Bookmarks can be created at design time when a team arrives at a spot worth marking or they can be created after the fact by going back to a point in the timeline and bookmarking it. Users can view their set of bookmarks when viewing By bookmarks. A synopsis can also be constructed from a filtered history view (e.g., every 12 actions). A user can select bookmark timeline to add that set of states to the synopsis. These two techniques can be combined to manually augment an autogenerated state set. For example, a user could begin a bookmark set with the states produced from the By Meeting filter, augmenting it manually with key points from the meetings. This combination of automatic and manual history echoes work by Kaasten and Greenberg [6] on managing web browsing histories. When viewing the main timeline by bookmarks, there is a button to bring up a synopsis view. The synopsis view displays each of the bookmarks vertically on the left-hand side of the screen. It provides a text-box to the right of each bookmark for entering a description of that state. The synopsis view can also be printed for offline use. HISTORY USAGE SCENARIOS
Drawing on field studies of web design [14], in lab studies
Figure 10 (left). The on-screen synopsis view. Figure 11 (top). A print version of the same information.
Volume No. 4, Issue No. 1
5
Paper: Contextual Displays
[7], and on the related research literature [2, 12, 16], we have constructed four scenarios that reflect current and envisioned uses for design history capture. Del, Erykah, Jeru, and Rahzel are designing a portal web site for hip-hop music and culture. They are young and enthusiastic, and would like to use this project to prove themselves. The portal they are designing will enable site visitors to read music reviews, interviews with artists, and relevant news stories. It will also be possible to purchase music for download, and find out about local concerts. Scenario 1: Reaching a Dead-end
In the first design session, Erykah, Jeru, and Rahzel came up with what seemed like a compelling information architecture for the portal, which they are now trying to refine in a second session. After looking at the initial design for a while, Rahzel points out that the music reviews section is completely disconnected from the purchasing music section. If they are to make money from the site, the two should be strongly tied. After a while, Jeru concludes it isn’t possible to alter the current design, so she create an ink annotation on the main ‘music review’ note explaining this. Then she selects the note, selects by note view on the main timeline and clicks the first thumbnail to reset the state of the board to the point where that note was created. Starting from there they then create a redesign where purchasing is easily accessible from the music reviews area. Scenario 2: Writing a Session Summary
After the design session, Erykah stays in the project room. She uses the main timeline to review the team’s progress. As she rolls the time forward By Actions she bookmarks important states in the design. Upon reaching the end of the meeting, she opens the synopsis view (see Figure 10), and annotates the key states with text. Finally, she makes a print version (see Figure 11) for herself and the other team members. This portable, sharable summary serves as an overview of what has been accomplished, and helps the team members communicate their progress to the client. Scenario 3: Find the Rationale Behind a Decision
Del missed the design session; he was helping friends set up for a show. When he returns, viewing the electronic wall in the project room, he notices the strong linking between the album reviews and the music purchase areas. Curious why this is, he taps on the ‘album reviews’ note, and quickly finds its local history, which he scans to understand the changes it underwent while he was away. He also inspects the ink annotation that one of the other members made on the note and reads the summary, and he quickly understands the rationale for the change. Scenario 4: Following up on a Session
On Friday morning, the designers decide to perform a review of their work in the past week. Several design issues warrant further consideration; they bookmark each of these. They then annotate the bookmarks in the Synopsis view and
6
Volume No. 4, Issue No. 1
CHI
changing the world, changing ourselves
print it. The print view serves as a to-do list that the designers bring back to their personal workspace. In the afternoon they reconvene and discuss the issues that each has examined, yielding a much cleaner sitemap. IMPLEMENTATION
At the core of the history system is a data structure that holds command objects [4, 13]—one command object for each action carried out by the users. Typical command objects include add note, remove note, move note, add link, and add ink annotation. These command objects are stored in a tree shaped data structure with branches. A new branch is added when the user jumps back to a previous state and then starts modifying the board from there. The actual restoration of the board’s state from a given state X to the user requested state Y is handled by first calculating the least common ancestor L of X and Y, then the up-path from X to L and finally the down-path from L to Y. Given these paths, the state is easily restored by following the path from X to L undoing each command on the way, and then the path from L to Y redoing the commands found here. Each of the thumbnails used to visualize the command history is calculated by asking the main SATIN sheet [5] to redraw itself into a new, thumbnail-sized graphics context. This procedure is performed “on the fly” when the filter changes: Given a criterion, the whole tree is traversed, and the whole visualization rebuilt. It would be computationally more efficient to cache some of this information, but we have found, as others have [15], that for a research prototype rolling forward is not a substantial bottleneck. Efficiency has not been our focus so far and this simple approach has shown fast enough for medium sized designs; a commercial implementation of this system should cache state. DESIGN STUDY
We had six professional designers use the history system and offer us their feedback (see Figure 12). When the history system was in an early state, we brought in two designers who worked at the same firm to talk with us about their current practices and try our system. From prestudy interviews with the pair, we found the participants currently had a difficult time managing history; their state of the art was to save “bookmarks” and “versions” simply as files with different names. When working with our system, the history utility was primarily used at a macro scale. Working physically and electronically occurred in cycles. They would add content for a while, work with it, then make the board electronic, and delve into the history. In addition to finding the history useful for reflection and design rationale, the pair commented that they would find value in using the history to make accountability from the client clearer. The pair’s collaborative work helped us realize that knowing the author of content might be
minneapolis, minnesota, usa • 20-25 april 2002
Paper: Contextual Displays
The participants were very enthusiastic about the history in that it enables easy capture of different states. Having a simple, touch-based visual interface with the ability to negotiate the history of the board was highly appreciated as well. Need for Visual Comparison and Merging
The designers encouraged us to provide facilities for simultaneous comparison and merging of history states. One participant said, “It is very important to view multiple versions in juxtaposition, at the same time and at a scale that we can make sense out of. Much of the impact is visual.”
Figure 12. Two professional designers collaborate on an information architecture for the Oakland Zoo web site during the study.
beneficial, leading us to implement the author wizard for the next group of participants. With the software completed, we brought in four more designers in three groups: one pair of colleagues and two individuals. The participants were very enthusiastic about our bookmarking features, and in the ability to generate a synopsis view. Participants found the View all filter distracting, reminding us of the need for calm interaction. Viewing every single command is only useful for local undo, rare during fluid brainstorming. (The one time it was useful was when the system misrecognized the users’ input.) One finding from our previous study was that calm interaction is essential to an effective electronic whiteboard. Beyond its limited utility, View all is the antithesis of calm; it renders a new thumbnail for every command the user executes. This makes for a hyperactive electronic whiteboard. Based on this, we have changed the default filter to be the By Actions filter. This provides visual locations the user can move back to at a coarser interval (the default is every 6). One participant commented that his favorite aspect of using computer-based tools was easy saving enabled him to try new ideas and have different versions. After three of the participants had worked with the system, it became clear that save and bookmark should be integrated. We eliminated a separate save button, including the save functionality as part of the bookmarking process for the last participant. He found this integration intuitive. Timeline Usability
The participants used the history smoothly for the most part, but sometimes, the presence of branches was confusing. As a solution, one designer suggested that that sometimes it might be valuable to see the entire branch structure as a traditional graph.
One designer commented that in his current practice, “When I’m working, I’ll do the information architecture on Post-its, and draw links on the whiteboard. I’ll take snapshots at different points in time. And then I’ll project earlier states onto a wall, and go from there.” This was a current practice uncannily similar to what Outpost and its history support. (The other participants did not have this advanced a practice for dealing with history, possibly because such a practice is difficult with current tools.) FUTURE WORK
Our design study showed that calm, lightweight history provides substantial value to designers. We plan to look further into heuristics that help build a concise history without distracting the user. Examples include automatically bookmarking periods of intense work and bookmarking changes between creating content and editing. We also plan to integrate informal audio capture techniques into our history system, structuring the audio using board work, and using the timeline as an access interface. We have found that in brainstorming sessions, the discussion among designers often captures information sometimes not expressed in the resulting visual artifact. Our previous [7] and current studies have shown that design teams are very interested in remote collaboration. Many of the designers we have spoken with either work in a firm with multiple offices or sometimes work with clients far away. We have begun building a command object based synchronous remote collaboration system; we plan to study how a combined physical/electronic collaboration tool like Outpost can be used to facilitate early phase design practices among distributed teams. CONCLUSIONS
We have presented an informal history mechanism for collaborative design of information architectures. The history system extends the Designers’ Outpost. We have presented three novel history visualizations for collaborative early-phase design: a stub-branching main timeline, an in situ object timeline, and an annotated synopsis view. Six professional web site designers evaluated the system. They were excited about the functionality with the
Volume No. 4, Issue No. 1
7
CHI
Paper: Contextual Displays
exception of garish interactions like constantly updating history thumbnails, encouraging us to make calmer interactions be the default, such as manual bookmarks and infrequent auto-bookmarks. Many professional practices center around the creation of an artifact by several individuals over an extended period of time (writing papers is an example that comes to mind at the moment). We hope that this work exploring interfaces for history in the context of collaborative wall-scale design will inspire work in other professional domains as well.
9
10
11
ACKNOWLEDGEMENTS
Many thanks to Katie Everitt and Orna Tarshish for help with the design study. We also thank Mark Newman and Warren Sack for insightful discussions. This work is supported by National Science Foundation grant # IIS 0084367. Finally, a big shout out to all the designers who participated in our studies. REFERENCES
1
2
3
4
5
6
7
8
8
Abowd, G.D., Classroom 2000: An Experiment with the Instrumentation of a Living Educational Environment. IBM Systems Journal, 1999. 38(4): p. 508–530. Bellotti, V. and Y. Rogers. From Web Press to Web Pressure: Multimedia Representations and Multimedia Publishing. In Proceedings of Human Factors in Computing Systems: CHI ’97. Atlanta, GA. pp. 279– 286, 1997. Edwards, W.K. and E.D. Mynatt. Timewarp: techniques for autonomous collaboration. In Proceedings of Human factors in computing systems. Atlanta, GA: ACM Press. pp. 218–225, March 22–27, 1997. Gamma, E., R. Helm, R. Johnson, and J. Vlissides, Command, in Design Patterns: Elements of Reusable Object-Oriented Software. Addison-Wesley Pub Co. p. 233–242, 1995. Hong, J.I. and J.A. Landay, SATIN: A Toolkit for Informal Ink-based Applications. UIST 2000, ACM Symposium on User Interface Software and Technology, CHI Letters, 2000. 2(2): p. 63–72. Kaasten, S. and S. Greenberg. Integrating Back, History and Bookmarks in Web Browsers. In Proceedings of Extended Abstracts of the ACM Conference of Human Factors in Computing Systems. Seattle, WA: ACM Press. pp. 379-380, 2001. Klemmer, S.R., M.W. Newman, R. Farrell, M. Bilezikjian, and J.A. Landay, The Designers’ Outpost: A Tangible Interface for Collaborative Web Site Design. The 14th Annual ACM Symposium on User Interface Software and Technology: UIST2001, CHI Letters, 2001. 3(2): p. 1–10. Kurlander, D. and S. Feiner. A history-based macro by example system. In Proceedings of UIST '92: 5th Annual Symposium on User Interface Software and
Volume No. 4, Issue No. 1
12
13
14
15
16
17
18
19
20
21
changing the world, changing ourselves
Technology. Monterey, CA, USA: ACM Press. pp. 99– 106, November 15–18, 1992. Landay, J.A. and B.A. Myers, Sketching Interfaces: Toward More Human Interface Design. IEEE Computer, 2001. 34(3): p. 56–64. MacLean, A., R.M. Young, V. Bellotti, and T.P. Moran, Questions, options, and criteria: elements of design space analysis. Human-Computer Interaction, 1991. 6(3–4): p. 201–250. Moran, T.P. and J.M. Carroll, Design Rationale: Concepts, Techniques, and Use. ed. Lawrence Erlbaum Associates.: Mahwah, N.J., 1996. Moran, T.P., et al. “I’ll get that off the audio”: a case study of salvaging multimedia records. In Proceedings of Conference on Human Factors in Computing Systems. Atlanta, GA. pp. 202–209, March 22–27, 1997. Myers, B.A. and D.S. Kosbie. Reusable hierarchical command objects. In Proceedings of Human factors in computing systems. Vancouver, Canada: ACM Press. pp. 260-267, April 13–18, 1996. Newman, M.W. and J.A. Landay. Sitemaps, Storyboards, and Specifications: A Sketch of Web Site Design Practice. In Proceedings of Designing Interactive Systems: DIS 2000. New York, NY. pp. 263–274, August 17–19, 2000. Rhyne, J.R. and C.G. Wolf. Tools for supporting the collaborative process. In Proceedings of the fifth annual ACM symposium on User interface software and technology. Monterey, CA: ACM Press. pp. 161– 170, November 15–18, 1992. Richter, H., G.D. Abowd, W. Geyer, L. Fuchs, S. Daijavad, and S. Poltrock. Integrating Meeting Capture within a Collaborative Team Environment. In Proceedings of Ubicomp 2001. pp. 123–138, 2001. Rittel, H.W.J. and M.M. Webber, Dilemmas in a general theory of planning. Policy Sciences, 1973. 4: p. 155-169. Shipman, F.M. and H. Hseih, Navigable History: A Reader’s View of Writer’s Time. The New Review of Hypermedia and Multimedia, 2000. 6(1): p. 147–167. Stallman, R., GNU Emacs: The extensible selfdocumenting text editor, 1993. Free Software Foundation: Cambridge, MA. ftp://prep.ai.mit.edu/pub/gnu Stifelman, L., B. Arons, and C. Schmandt, The audio notebook: paper and pen interaction with structured speech. CHI 2001, Human Factors in Computing Systems, CHI Letters, 2001. 3(1): p. 182–189. Wilcox, L.D., B.N. Schilit, and N. Sawhney. Dynomite: a dynamically organized ink and audio notebook. In Proceedings of Conference on Human Factors and Computing Systems. Atlanta, GA. pp. 186– 193, March 22–27, 1997.


![[eBook] [PDF] Where Do Babies Come From? - Google Sites](https://m.moam.info/img/260x300/ebook-pdf-where-do-babies-come-from-google-sites_6478b2bb097c4796708d18e4.jpg)