UNIVERSITY OF WAIKATO Hamilton New Zealand
Which Households Are Most Distant from Health Centers in Rural China? Evidence from a GIS Network Analysis John Gibson University of Waikato Xiangzheng Deng Chinese Academy of Sciences Geua Boe-Gibson University of Waikato Scott Rozelle Stanford University Jikun Huang Chinese Academy of Sciences
Department of Economics Working Paper in Economics 19/08 December 2008 Corresponding Author John Gibson Department of Economics University of Waikato, Private Bag 3105, Hamilton, New Zealand Fax: +64 (7) 838 4331 Email:
[email protected]
Abstract In this paper we have two objectives - one empirical; one methodological. Although China’s leaders are beginning to pay attention to health care in rural China, there are still concerns about access to health services. To examine this issue, we use measures of travel distances to health services to examine the nature of coverage in Shaanxi Province, our case study. The mean distance by road to the nearest health center is still more than 6 kilometers. When we use thresholds for access of 5 and 10 kilometers we find that more than 40 (15) percent of the rural population lives outside of these 5 (10) kilometer service areas for health centers. The nature of the access differs by geographical region and demographic composition of the household. The methodological contribution of our paper originates from a key feature of our analysis in which we use Geographic Information System (GIS) network analysis methods to measure traveling distance along the road network. We compare these measures to straightline distance measures. Road distances (produced by network analysis) produce measures (using means) that are nearly twice as great as straight-line distances. Moreover, the errors in the measures (that is, the difference between road distances and straight-line distances) are not random. Therefore, traditional econometric methods of ameliorating the effects of measurement errors, such as instrument variables regression, will not produce consistent results when used with straight-line distances.
Keywords health access measurement error network analysis
JEL Classification I12, O15
Acknowledgements We are grateful to the Research and Education Advanced Network New Zealand (REANNZ) Capability Build Fund for financial assistance and to Susan Olivia and Qunou Jiang for assistance with the data. All remaining errors are our responsibility.
2
I.
Introduction
Despite fast economic growth and success in reducing poverty during the reform period (1980 to now), China has experienced periods that can only be described as rural health crises (Dummer and Cook, 2007). At least through the mid-2000s, there was a growing gap between rural and urban areas in the quality and accessibility of health services (World Bank, 2005). Even today indicators like the infant mortality rate (IMR) are worse in rural areas, and the gap with the cities is growing. Inferior geographic access to health care in rural areas has contributed to this gap (Liu et al, 1999). According to one recent review of spatial equity in China: ‘the enlarging difference in access to healthcare appears to be a contributing factor to the widening gap in IMR between rural and urban residents’ (Zhang and Kanbur, 2005, p.200).
Evidence of the declining health status of China’s rural population during the reform era, compared with urban areas, is available for several indicators. For example, the death rate in cities declined by 4.7 percent between 1989 and 1999, while in counties that are predominantly rural, it increased by one percent (Dummer and Cook, 2007). Hence the relative risk of death in the countryside compared with the city rose from 1.18 to 1.25 over that decade. While the infant mortality rate declined in both urban and rural areas, the decline was more rapid in the cities, so the risk of rural infant mortality (relative to urban areas) rose from 1.7 to 3.1 between 1981 and 2000 (Zhang and Kanbur, 2005; Dummer and Cook, 2007). Although China has begun to address rural health issues since the mid-2000s, most of the focus has been on the provision of rural health insurance (Yi et al., 2008). Hence, even as rural households begin to get aid in paying for health care, there is widespread evidence of declining access to rural health facilities and health workers. For example, in 1980, just after the start of economic reforms, there were 7.82 healthcare personnel per 1000 people in China’s cities, and 1.81 per 1000 in the countryside (Zhang and Kanbur, 2005). Thus, urban residents could see an average of 4.3 (7.82/1.81) health workers per health worker that a rural resident could see. Since then, the number of urban health workers rose as the number in rural areas fell. By 1998 every urban resident could see 5.4 health workers per health worker seen by a rural resident. This decline in rural health facilities and personnel appears to have been particularly acute at the lower and middle tier of rural China’s health care system.1 According to Liu et al (1999), there was a 14.2 percent decline in the number of township health centers between 1980 and 1989, while the number of primary health care workers at village level declined by 35.9 percent. Moreover, since the mid-1990s, efficiency-minded officials have 1
Prior to the economic reforms rural health care was organised into a three-tier structure, financed through the Cooperative Medical System (CMS). The first tier of ‘barefoot doctors’ provided preventative and primary care services at village level, including issuing prescription drugs. For more serious illnesses, they referred patients to township health centers, which were the second tier. The third tier of county hospitals dealt with only the most seriously ill patients.
3
merged townships, at least in part to be able to save the costs of running public services, such as health centers. While there is little reason to expect that the number of rural health facilities have increased in recent years, this does not mean that access to health care has fallen or stagnated. During this time period China’s leaders have invested heavily in infrastructure. To the extent that new roads let the population in rural villages now access health centers at township or county level the loss of village level health care workers may be less concerning. Indeed, according to Liu et al (2003), this urbanization of the countryside is beneficially increasing access to health care and health insurance coverage. In view of these conflicting claims it would be useful to have reliable data on the accessibility of health care in rural China. While several Chinese surveys have self-reported measures of distance or traveling time to health facilities, collected at either household or community level (e.g. Akin et al, 2005)), these may not be reliable. Evidence is accumulating from developing countries that self-reported distance and travel times are inaccurate, when compared with the benchmark provided by Global Positioning System (GPS) measurements. For example, Escobal and Laszlo (2008) find respondents in rural Peru under-report the time taken to reach their nearest service center by over 50 percent and the correlation between self-reported and true travel time is only 0.28, at best. Gibson and McKenzie (2007) find that even in an urban area, in Bolivia, actual distance is only weakly correlated (r=0.39) with self-reported distance. Moreover, both evidence and a priori reasoning suggest that measurement errors in selfreports are not random. For example, if people are asked to report travel times to a health provider, those who currently use the provider will have more accurate knowledge than those who do not (Entwisle et al. 1984). Thus the measurement error is likely to be correlated with usage patterns, a problem if one wishes to investigate the impact of distance on usage. To provide more reliable estimates of healthcare accessibility in rural China we georeference existing rural household survey data and the locations of township health centers in Shaanxi province. We use these geo-referenced data to calculate what fraction of the rural population live in households outside a given radius of the nearest township health center. We also examine some of the correlates of distance to health centers to see whether geographic access to healthcare is especially poor for certain types of households. Our decision to focus on Shaanxi has several advantages in a study of rural health care and access. Shaanxi has one of the slowest rates of poverty reduction in rural China (Ravallion and Chen, 2007). Life expectancy is the ninth lowest of China’s 31 provinces (Dummer and Cook, 2007). While it has built a lot of roads during the reform period (NBSC, 2006), travel across the province reveals that the province’s road networks are heterogeneous. In some places roads are dense; in others not.
4
A key feature of our analysis is that we use Geographic Information System (GIS) network analysis methods to measure traveling distance along the road network. Since Shaanxi is a mountainous province, these road network distance measures are likely to provide more plausible estimates of accessibility than do simpler straight line ‘crow-fly’ distance measures that ignore topography. Furthermore, to better understand the nature of the measurement error that would come from not using road networks, we construct and compare two sets of accessibility estimates; one created using the road network and one created in a more short-cut fashion by assuming that households can travel in a straight line to the nearest health center. Since a curve between two points is always longer than a line, we know a priori that road network travel distances will exceed straight-line distances. Hence, measures of access based on straight-line distances will over-estimate the population covered within a given service area. While it is an empirical issue as to how large will be the resulting error, existing studies suggest that it may be significant. For example, Noor et al. (2006) show how using straight-line distances makes it appears that 82 percent of the Kenyan population is currently within the government target of one hour to the nearest health service, but using road network distance this drops to 63 percent. Our results for rural China will help further illustrate the importance of this type of measurement error. While we measure distance to health centers rather than actual patterns of usage, other studies show that utilization of services declines, the further the service centers are from the population (Cromley and McLafferty, 2002). Moreover, since only a few existing studies use GIS to measure the accessibility of health facilities in developing countries (Perry and Gesler, 2000; Rosero-Boxby, 2004; Noor et al, 2006),2 these distance estimates for rural China should still be of broad interest. Finally, the primacy of distance as an explanatory factor for health facility usage in developing countries (Buor, 2003) means that studies such as this on the nature of the measurement error in distance estimates may help in assessing whether prior results are likely to have been biased by this type of measurement error. The rest of the paper proceeds as follows. The next section describes the data, followed by an explanation of the GIS methodology used in the study. Section 4 presents the main results on distance to health centers in rural Shaanxi, the population coverage within service areas and the characteristics of the households that are most remote from health centers. Section 5 looks at the nature of the measurement errors that result from using straight-line distance rather than road network distance. Section 6 presents our conclusions.
2
GIS-based studies of the geographic accessibility of health facilities in developed countries are quite common, with a good review provided by Higgs (2004).
5
II.
Data
The data come from three sources: the 2001 Rural Household and Income Expenditure Survey (RHIES) conducted by China’s National Bureau of Statistics; GPS data on the location of households in the RHIES and their nearest health centers (conducted by ourselves); and a digitized road network for Shaanxi. By using the RHIES as the base for the collection of georeferenced data on the spatial distribution of the population we can ensure that the results are representative for Shaanxi. Specifically, the RHIES used a random multi-stage sample of 1,990 households in Shaanxi, with 34 counties selected in the first stage and 182 townships selected from amongst these counties.3 Each of these townships has many constituent villages, so typically one and occasionally two villages per township were selected by the RHIES. During the final stage 10 households from each selected village are recruited (randomly) into the sample. For the analysis reported here we obtained from the statistics bureau a randomly chosen sub-sample of just under 60 percent of these RHIES households (n=1068), located in 22 counties. Figure 1 shows the location of the counties and townships in the sub-sample that we use. In addition to ensuring that our sample is representative of rural Shaanxi, a further advantage of basing results on the RHIES is that it gives access to the wide range of socioeconomic variables collected from each surveyed household by the RHIES. In addition to income and expenditures, the survey also collected information on the demographic composition, educational attainment and dwelling characteristics of households. These socioeconomic variables can be used to determine whether certain characteristics are associated with worse geographic access to health centers in rural Shaanxi. In order to precisely measure the distance from sampled households to the nearest health center, we retrospectively (in 2007) established the exact coordinates of both the primary dwelling of each sample household and of the township’s primary health center. To carry out this work we first obtained a list of the village and household names of the 2001 RHIES sample from the state statistical bureau (SSB) in Shaanxi. This step of our task required the close cooperation between our colleagues in China and the personnel in the provincial SSB since this information is not part of the standard RHIES data in order to protect confidentiality.4
3
Shaanxi has 98 counties with approximately 2200 townships.
4
In our agreement with the statistical authorities we only used the data for obtaining the GPS coordinates and then we eliminated this identifying information from our data set.
6
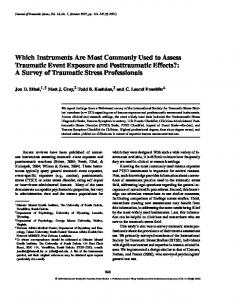
Figure 1. Sampled Counties and Townships in the Rural Household Income and Expenditure Survey for Shaanxi
Note: County boundaries of Shaanxi province are based on the digitalized administrative maps of Shaanxi from the data center of Chinese Academy of Sciences (CAS data center); Township boundaries are generated by the authors using the Proximity toolset in ArcGIS 9.2 according to the point coverage of township locations supplied by CAS data center.
7
After the counties, towns, villages and households were identified, the second step of our data collection effort involved recruiting teams of enumerators and training them in the operation of the GPS equipment. All of the enumerators were masters students from the Institute of Geographical Sciences and Natural Resources Research, Chinese Academy of Sciences. In training the student-enumerators rules for consistency and accuracy were created so that there could be little measurement error. Once each team entered a village that was part of the RHIES sample, the first task was to find the exact location of each household from the list of RHIES respondents provided by the statistics office. This was done by getting one or more villagers who were familiar with the households in their villages to guide the team. Because China’s villages are relatively small—on average, the distance between the furthest two households within a single village was only 0.5 kilometers—most villagers could easily take us to all of the households.5 In each case, the guide was able to tell us if the household had moved their residence between the time of the original survey (2001) and the time of our fieldwork for the GPS data collection (2007). Because of the static nature of housing in China’s villages over the past 10 years (especially since the late 1990s when strict rules on land use were beginning to be implemented and enforced), during our visit in 2007 of the more than 1000 sample households that we visited, fewer than 10 were identified as moving more 50 meters from the site at which they lived in 2001. Before the GPS coordinates of each household were recorded the teams always double checked with the household itself or with at least one neighbor to confirm that the dwelling that we had identified was indeed the main place of residence of the household. The GPS team did not engage in any further survey activity except that the enumerators asked each and every household that they met about the location of the health center that most villagers used when they got sick or had to visit a doctor for any reason. In most villages it was easy to determine which health center was servicing most of the villagers. In more than 80 percent of villages, all of the villagers that we talked to (i.e., the 10 sample households) told us they visited the same health center. In a small minority of villages, some villagers would typically visit one health center and other villagers said they visited another. In these cases the GPS location was taken of the health center that most of the villager respondents visited. In order to compute travel distances, it was necessary to create a digitized map of the road network. The basic data for the roads variable came in part from existing digital maps for provincial, county and local areas held by the Data Center for Resources and Environmental Sciences of the Chinese Academy of Sciences (CAS). The digitized road network maps were up to date through 1996 (with the digitizing having taken place in 1999 and 2000 and carried 5
In a small subset of big villages or ones where the households were scattered across a large area we sometimes had to engage the guiding services of more than one villager.
8
out by the Institute of Geographical Sciences and Natural Resource Research within CAS). However for the current project the road network from these maps did not have enough information and needed to be updated and supplemented with additional digitizing. This additional work was carried out in 2008 by adding digitized data on the newer and smaller roads, such as from county roads down to the villages, that had appeared between 1996 and 2001. The hardcopies of the supplementary maps used for updating the maps and extending the roads to the villages also came from the Chinese Academy of Sciences. III.
Methods
The methods applied here to derive a measure of access to health centers are based on Network Analysis, a branch of GIS whose functions rely on the use of a network of topologically connected linear structures such as roads. The use of GIS enables researchers to model travel scenarios (by incorporating factors such as the features of the road, natural geographic barriers and estimates of both manmade and environmental impediments enroute) to simulate the travel distances that people face. These distance estimates can also be converted into estimates of travel time if assumptions are made about the speed of travel over each segment of the network and the mode of transport used by the population. Since we do not have information on modes of travel for the respondents in the RHIES we only calculate distance-based measures in this study. In addition to the travel distances we use the Service Area tool in ESRI’s ArcGIS 9.1 Network Analyst extension to generate an areal region (i.e. catchment area) around a facility that denotes its service coverage for travel via road. Using this tool, a service area for each health center is formed, and combined with the geo-referenced RHIES data to calculate estimates of the population outside given service areas. These population estimates are made both for households and for persons (by weighting each household by its number of members), in case there is some systematic pattern of larger households being more remote from health centers. In our calculation of both distances and the population outside specified service areas (as discussed above) we base the estimates on the assumption that the local residents use the closest township health center amongst all of those centers whose GPS coordinates were collected. In other words, the GIS network analysis attempts to locate the best situated facility on the network to reach in the shortest travel distance required. Since the only health centers that were geo-referenced were those that typically all villagers we talked to told us they visited (or at least a majority visited in those villages where the population went to multiple health centers) this assumption should be a reasonable depiction of reality. In cases where either a health center or (more typically) a household’s dwelling was not located exactly on a 9
roadside, the road distance calculations include as a component the simulated distance to the nearest road edge. IV.
Results
The key results from our GIS network analysis are contained in Table 1. Both the mean and median distance to the nearest health center and the percentage of the population outside of 5 kilometer (km) and 10 km service areas are reported. In addition to the estimates created using the road network we also report the estimates from the short-cut (or crow-fly) approach based on straight-line travel from each household’s dwelling to the nearest health center. The mean distance by road to the nearest health center is 6.1 kilometers for rural households in Shaanxi. There is somewhat of a skew in the distance estimates so the median distance is 20 percent lower (4.8 kilometers). When the distances are calculated on a population basis (weighting households by the number of members in each household) the distances are almost the same (compare rows 1 and 2 of Table 1). Hence it does not appear that larger households in rural Shaanxi are any further away from health centers than are smaller households. While it does not appear that considering household size matters in China, this may be because of China’s strict population control policies that have reduced the maximum size of households. Table 1. Average distance to nearest health center and percentage of households and persons outside health center service areas in rural Shaanxi Distance (kilometres) Percentage outside service area Mean Median 5 km 10 km Road distance 6.06 4.82 47.3% 15.7% Households 6.09 4.84 47.6% 15.8% Personsa Straight line distance Households Personsa
3.27 3.30
3.19 3.33
15.4% 16.0%
0.9% 0.9%
Source: Authors’ calculations from geo-referenced data on locations of RHIES sample households and health centers and from a digitized road network as described in the text. a Estimates for persons are calculated by weighting each household by the number of members when calculating the averages and percentages.
While the average distance to the nearest health center is only between five and six kilometers, a road journey of at least 10 km is faced by 15.7 percent of households (containing 15.8 percent of the population) in rural Shaanxi. Even using just a 5 km threshold, 47.3 percent of households, containing 47.6 percent of the rural population, are outside the service area of the nearest health center. To the extent that households are discouraged from seeking health care by the travel costs in time and money, rural health officials may be concerned that access to health centers is still not adequate. 10
Because the 5 and 10 kilometer cutoffs are arbitrary, and the definitions of service areas using these cutoffs may not meet the needs of all users, we also produce a Cumulative Distribution Function to show the proportion of the population within service areas of different sizes in Figure 2. For any value of the service area on the horizontal axis, the vertical axis shows the proportion of the population that would be within that service area. For example, 66 percent of the rural population would be within a 6 km service area, 89 percent within a 12 km area and 95 percent within a 18 km service area, for travel by road to the nearest health center. Figure 2. Cumulative Distribution Function for Road and Straightline Distance to Nearest Health Center in Rural Shaanxi
The results when using the short-cut approach of assuming straight-line travel are also illustrated in Table 1 and Figure 2. It is a priori evident that the average distances are shorter and the population outside the service areas lower when straight-line travel is assumed. However, it is nevertheless revealing to see just how large are the discrepancies. According to the results in Table 1, when straight-line travel is assumed (instead of road network travel), the mean distance to the nearest health center appears to be only 54 percent of the actual road distance (66 percent at the median). Similarly, the 10 km (5 km) service area appears to cover 99 percent (84 percent) of the population rather than the actual 84 percent (53 percent) covered when road distance is used. According to Figure 2, the biggest differences between the service areas using straight-line travel and those from the road network occurs between 4 to 6 kilometers, where the population coverage within straight-line service areas is almost 30 percentage points higher than with the road network service areas. 11
The results of a more disaggregated analysis are reported in Table 2. This disaggregation is needed because the rural population in Shaanxi Province is unevenly distributed due to variations in climate, terrain and other natural features. In northern Shaanxi the population density is low because the dominant environmental features are low rainfall and erosion-prone soils. This part of the province forms the heart of China’s Loess Plateau which is a landscape that has many canyons. The population density is much higher in central Shaanxi, which is covered by the Guanzhong Plain and has relatively more rainfall and access to better soils and water resources. The southern part of Shaanxi is mountainous, with some areas above 2000 meters elevation and having slopes of more than 15 degrees. For a number of historic reasons as well as access to more abundant rainfall, the population densities in the southern parts of the province are typically higher. Table 2. Average road distance to nearest health center and percentage of population outside health center service areas in regions of rural Shaanxi Distance (kilometres) Percentage outside service area Mean Median 5 km 10 km Road distance 6.99 5.43 56.4% 20.7% Northern 5.68 4.72 42.9% 12.0% Central 5.59 4.36 44.7% 17.8% Southern Source: Authors’ calculations from geo-referenced data on locations of RHIES sample households and health centers and from a digitized road network as described in the text.
Health centers appear to be the least accessible in northern Shaanxi (Table 2). The mean (median) distance by road to the nearest health center is 7.0 (5.4) kilometers in northern Shaanxi and a road journey of at least 10 kilometers to the nearest health center is faced by 20.7 percent of the rural population. In contrast, the densely populated central Shaanxi region has the greatest geographic accessibility of health centers with only 12.0 percent of the rural population being outside a 10 kilometer service area. Even though average distances are slightly lower in southern Shaanxi (e.g., a mean distance of 5.6 km versus 5.7 km in central Shaanxi) the proportion of the population outside 5 km and 10 km service areas is higher. In fact the distances in southern Shaanxi are quite skewed in comparison for those in central Shaanxi, as seen by the mean distance being 28 percent higher than the median (in central Shaanxi it is only 20 percent higher). To examine whether there are any systematic relationships between household characteristics and road distance from health centers, multivariate regression analysis was carried out. Since there is some skew in the distance estimates, both the Ordinary Least Squares (OLS) and the Least Absolute Deviations (LAD) regression estimators are used. These correspond to a regression through the mean of the distance distribution when using OLS and a regression through the median of the distribution when using LAD. The explanatory variables include two factors that have already been discussed – the region in
12
Shaanxi where the household is located, and household size – and indicators for household wealth (whether the dwelling is made of concrete), demographic structure (the proportion of household members who are either children or elderly) and indicators for educational attainment/economic status (the proportion of household members who are illiterate and the logarithm of total household income per capita).
Table 3. Correlates of road distance to nearest health center for households in rural Shaanxi Mean Regression coefficients (std dev) OLS LAD Region is central Shaanxi 0.513 -1.176 -0.548 (0.500) (2.87)** (2.13)* Region is southern Shaanxi 0.178 -1.589 -1.058 (0.383) (3.36)** (3.54)** Household size 4.354 0.038 0.063 (1.217) (0.29) (0.75) Dwelling made of concrete 0.243 -0.177 -0.461 (0.429) (0.42) (1.76)+ Share of household who are 0-6 years old 0.053 -1.765 0.737 (0.110) (1.22) (0.81) Share of household who are > 60 years old 0.062 -2.723 -1.457 (0.146) (2.49)* (2.11)* Share of adults in household who are illiterate 0.091 0.471 0.103 (0.198) (0.56) (0.20) Log per capita net annual income (Yuan) 7.152 -0.039 -0.079 (0.688) (0.16) (0.54) Constant 7.332 5.781 (3.81)** (4.91)** Zero slopes F-test 3.36** 3.57** R-squared 0.02 Note: The dependent variable is the distance by road to the nearest health center for households in rural Shaanxi. The coefficients are estimated by Ordinary Least Squares (OLS) and Least Absolute Deviations (LAD) regression. N=1068. Absolute value of t statistics in parentheses; + significant at 10%; * at 5%; ** at 1%.
Table 3 contains the results of the regressions, along with summary statistics for the explanatory variables. Holding the control variables (described above) constant, the multivariate analysis shows that households in central Shaanxi have a mean (median) road journey to the nearest health center that is 1.2 km (0.5 km) shorter (relative to households in the base area, northern Shaanxi). In southern Shaanxi, the mean journey is 1.6 km shorter and the median 1.1 km shorter. The only significant demographic factor appears to be the proportion of household residents who are over 60 years old; the higher is this proportion the lower the mean and median travel distances. In other words, households with a larger share of elderly residents tend to be concentrated in areas that have better geographic access to health centers. Since the elderly may be relatively heavy users of health services, one implication of this result is that the distance for the ‘average user’ may be slightly less than the previously reported distances for the average member of the population. In part this pattern may occur 13
because the elderly are making their choice of who they live with (that is, which son or even daughter) based on which one has better access to health care facilities. Amongst the three indicators for the wealth and educational attainment/economic status of households, there is little evidence that richer households have better geographic access to health centers. There is no significant relationship between distance to the nearest health center and either the adult literacy rate within the household or the household per capita income, and the relationship with dwelling construction (as a proxy for wealth) is only weakly significant in the median regressions. Thus, although health centers are remote for a substantial fraction of the population in rural Shaanxi, the relatively poor geographic access is not concentrated on particular types of households once the regional patterns and demographic structure are accounted for. V.
Implications of Measurement Error in Distance Estimates
The comparisons between straight line distances estimates and the road network distances (see Table 1 and Figure 2) suggest that straight line distance estimates are subject to large error. While it is known a priori that road network travel distances will exceed straight-line distances, since a curve between two points is always longer than a line, it is still interesting to explore the properties of this measurement error. Some methods for ameliorating the effects of measurement error, such as the Instrumental Variables (IV) regression estimator, rely on measurement errors having certain ‘well behaved’ properties. These properties include the assumption that the measurement errors have mean zero and are random, which means that they should not be correlated either with the true values or with any other factors. If these properties do not hold, the IV estimator is no longer consistent and coefficients produced by this estimator may be misleading (or in technical terms they would be ‘biased’). So, for example, an investigator who uses straight line distances to study the impact of distance on usage of health facilities could draw incorrect inferences from a regression model, even if precautions like using IV estimation to deal with potential measurement error are taken. Table 4 contains the results of regressions that look at potential correlates of the measurement error in the straight line distance estimates. The error is calculated for each household as the difference between the road network distance and the straight line distance, so it is a positive number which is larger when the error is larger. The correlates used in the regression are the same as those used in Table 3, along with the road network distance, which serves as the measure of actual distance. If the hypothesis of random errors holds, none of the correlates should be significant determinants of the measurement errors. An alternative hypothesis is that the errors are mean-reverting, in the sense that there are larger measurement errors for households who face larger actual distances, so that the error-ridden variable reverts towards the mean. If there are mean-reverting errors, there should be a significant positive partial correlation between actual road network distance and the errors.
14
Table 4. Correlates of measurement error in straight line estimates of distance to nearest health center for households in rural Shaanxi Regression coefficients OLS LAD Actual road distance 0.820 0.629 (81.88)** (92.96)** Region is central Shaanxi 0.943 0.918 (7.04)** (10.19)** Region is southern Shaanxi 0.205 0.872 (1.32) (8.37)** Household size -0.075 -0.019 (1.71)+ (0.64) Dwelling made of concrete 0.207 0.061 (1.52) (0.66) Share of household who are 0-6 years old -0.412 0.164 (0.87) (0.52) Share of household who are > 60 years old 0.159 -0.094 (0.45) (0.40) Share of adults in household who are illiterate 0.179 0.092 (0.66) (0.50) Log per capita net annual income (Yuan) 0.114 0.055 (1.47) (1.05) Constant -3.241 -2.134 (5.14)** (5.01)** Zero slopes F-test 758.07** 968.30** R-squared 0.87 Note: The dependent variable is the error in straight line estimates of distance to the nearest health center for households in rural Shaanxi. The coefficients are estimated by Ordinary Least Squares (OLS) and Least Absolute Deviations (LAD) regression. N=1068. Absolute value of t statistics in parentheses; + significant at 10%; * at 5%; ** at 1%.
The regression results strongly reject the hypothesis of random measurement errors in the straight line distance estimates. Instead, the errors are positively correlated with actual road distance (hence, the errors are mean-reverting), and with the indicator variables for region. The errors also are weakly negatively correlated with household size (for the mean but not the median). There are at least two implications of these results. First, studies that use straight line distances as a proxy for the geographic accessibility of health centers would need to be careful to ensure that the estimation methods used are robust to the presence of mean-reverting errors. The most widely used treatment for measurement error, the IV estimator, is not robust to this type of error, although some other estimators such as reverse regression may be. Second, in the specific context of Shaanxi, not only is the geographic access to health facilities of the more remote residents overstated when straight line distances are used to form service areas, there is a further regional component to the measurement error. Thus, sub-provincial rankings of the population covered by health center service areas may be misleading unless the extra effort is made to calculate these service areas using GIS and a road network.
15
VI.
Conclusions
In this paper we show that although China’s leaders are beginning to pay attention to health care in rural China, there are still concerns about access to health services. To examine this issue, we use measures of travel distances to health centers to examine the nature of geographic access in Shaanxi Province, our case study. The mean distance by road to the nearest health center is found to still be more than 6 kilometers. The results demonstrate that more than 40 percent of the rural population lives outside a service area that is defined by being less than or equal to five kilometers by road from each health center. Moreover, the nature of the access differs by geographical region and demographic composition of the household. As China becomes wealthier and its fiscal resources grow, leaders will begin to worry more about providing its citizens, especially those in poorer, more remote rural areas, better access to rural services, including health. However, in any developing country fiscal resources are limited and leaders want to use them efficiently. It is for this reason that it is important to measure the access of different populations in different regions to key public services. Once these measures are known, policy makers will be able to allocate resources to meet their policy goals more efficiently and monitor progress over time in the achievement of goals such as improved access to health. It is at this point that our methodological contribution becomes important (not only to China’s policy makers, but to policy makers in all developing countries). A key feature of our analysis was that we used Geographic Information System (GIS) network analysis methods to measure traveling distance along the road network. We compared these measures to straightline distance measures. We found that road distances (produced by network analysis) produced measures (using means) that were nearly twice as great as straight-line distances. Moreover, the errors in the measures (that is, the difference between road distances and straight-line distances) were not random. Therefore, traditional econometric methods that are used to ameliorate the effects of measurement errors (e.g., instrumental variables approaches) may not produce consistent results when they are applied to straight-line distance estimates. Therefore, if the leaders of developing countries want more accurate measures of access to public services, they need to direct their statistical bureaus to begin to collect and disseminate more geo-referenced data. In the current study, cooperation with the statistical bureau enabled the GPS coordinates of households in an existing sample to be collected and combined with information gathered on the locations of the public services used by these households. In addition, more systematic efforts to fund and disseminate digital road network information would be helpful, particularly in countries or regions where the topography would be likely to make straight-line distances a very misleading proxy for the geographic accessibility of health services. With these sets of information, health policy analysts can 16
directly compute more accurate measures of access and avoid the biases that may be present in other measures such as direct solicitation of distances from survey respondents or taking the short-cut approach of assuming that the population can travel in straight lines to the nearest services.
References Akin, J., Dow, W., Lance, P., and Loh, C-P. (2005) ‘Changes in access to health care in China, 19891997’, Health Policy and Planning 20(2): 80-89. Buor, D. (2003) ‘Analyzing the primacy of distance in the utilization of health services in the AhafoAno South district, Ghana’, The International Journal of Health Planning and Management 18(4): 293-311. Cromley, E. and McLafferty, S. (2002) GIS and Public Health. Guilford Press, New York. Dummer, T. and Cook, I. (2007) ‘Exploring China’s rural health crisis: processes and policy implications’, Health Policy 83(1): 1-16. Entwisle, B., Hermalin, A., Kamnuansilpa, P., and Chamratrithirong, A. (1984) ‘A multilevel model of family planning availability and contraceptive use in rural Thailand’, Demography, 21(4): 559-574. Escobal, J. and Laszlo, S. (2008) ‘Measurement error in access to markets’, Oxford Bulletin of Economics and Statistics 70(2): 209-243. Gibson, J. and McKenzie, D. (2007) ‘Using the Global Positioning System (GPS) in household surveys for better economics and better policy’, World Bank Research Observer 22(2): 217241 Higgs, G. (2004) ‘A literature review of the use of GIS-based measures of access to health care services’, Health Services and Outcomes Research Methodology 5(1): 119 -139. Liu, G., Wu, X., Peng, C., and Fu, A. (2003) ‘Urbanization and health care in rural China’, Contemporary Economic Policy 21(1): 11-24. Liu, Y., Hsiao, W., and Eggleston, K. (1999) ‘Equity in health and health care: the Chinese experience’, Social Science and Medicine 49(10): 1349-1356. NBSC [National Bureau of Statistics of China], 2006 ‘National Bureau of Statistics of China, 2006’, Beijing: China Statistics Press. Noor, A., Amin, A., Gething, W., Atkinson, M., Hay, I., and Snow, R. (2006) ‘Modeling distances traveled to government health services in Kenya’, Tropical Medicine and International Health 11(2): 1-9. Perry, B. and W. Gesler (2000) ‘Physical access to primary health care in Andean Bolivia’, Social Science and Medicine 50:1177-1188. Ravallion, M. and Chen, S. (2007) ‘China’s (uneven) progress against poverty’, Journal of Development Economics 82(1): 1-42.
17
Rosero-Bixby, L (2004) ‘Spatial access to health care in Costa Rica and its equity: a GIS-based study’, Social Science and Medicine 58:1271-1284. World Bank (2005) ‘Health service delivery in China: a review’, Rural Health in China: Briefing Note Series Note 4, February. Yi, H., Zhang, L., Rozelle, S., and Atlas, S. (2008) ‘China’s new Cooperative Medical System: Update four years after the program’s initiation’, Working Paper, Center for Chinese Agricultural Policy, Institute of Geographical Sciences and Natural Resources Research, Chinese Academy of Sciences. Zhang, X. and Kanbur, R. (2005) ‘Spatial inequality in education and health care in China’, China Economic Review 16(2): 189-204.
18