has to face several technical limitations that require a more in depth study of the ... a vast area with several buildings and open areas inside is needed. One example of .... building of the Higher Polytechnic School of Gandia. (figure 4b), where ...
WIRELESS LAN DEPLOYMENT IN LARGE EXTENSION AREAS: THE CASE OF A UNIVERSITY CAMPUS Jaime Lloret, Jose J. Lopez, Germán Ramos Department of Communications & Department of Electronics Polytechnic University of Valencia Ctra Nazaret-Oliva s/n, 46730 GRAO DE GANDIA Spain
Abstract This article deals with the issues related to the deployment of wireless LAN (WLAN) of large extension. Specifically, the studies and works developed towards the set-up of the campus WLAN of the Polytechnic University of Valencia are presented. The paper includes the solutions used to solve difficulties and provides a structured method consisting of different phases which have been applied as a working strategy in this work and would be useful in future WLAN deployments. Color maps with radio coverage of different buildings are presented. In addition, indoor wall absorption and interference between channels are discussed. The minimization in the quantity of WLAN Access Points has been an important premise in this work, in order to minimize budget and interferences. Now, the university network is in the installation phase, according to the guidelines of this work.
Key Words WLAN, wall loss, radio coverage, 802.11
1. Introduction Since the market appearance of the wireless local area networks (WLAN) based on the 802.11b standard, [1] [2], a spectacular market growth has been experienced, due to the features they offer and the low costs of the transmission equipment of today. The installation of one of these networks in a little house or office environment is very easy, and is not technically complex. Nevertheless, when the requirements demanded from this network increase, for example, to cover a greater distance or more than one house or floor of a building, the user has to face several technical limitations that require a more in depth study of the installation. However, this complication could increase when to cover a vast area with several buildings and open areas inside is needed. One example of this situation is a university
campus where is very interesting to the students. It brings them the possibility of having a network connection wherever they are, and use their laptops or handheldcomputers furnished with wireless cards. Internationally, these wireless networks are widely developed with interesting projects, sometimes promoted by the city councils that want to offer coverage to its neighbors, or by groups of users that want to establish their own particular network [3]. There are many possibilities for using this technology and a license is not necessary to work with it.
2. Working strategies The deployment of a network of this dimension is faced with several problems. Some of them are easy to find a priori for, but others appear during the specific implantation study. To develop a big project like this successfully, it is always necessary to use a correct work strategy from the very beginning. These strategies we will call “Study Directives”, and will be applied to each building of the network. These directives are: • A visual study and inspection of the building through walking around them, and using the plans. • The carrying out of an initial set of measures to obtain the mean attenuation of the signal across the walls (this topic is developed at point 3). • The carrying out of calculations to obtain the coverage distance of a WLAN access point as a function of the walls that it needs to cross (point 3). • Establish the WLAN access point numbers needed by the floor, and design the theoretical coverage maps. • Locate the access points of the selected ones and check that the coverage adjusts to the theoretical design to validate its viability. • If the estimated coverage is not obtained, replace the access points or add some new ones.
3. Propagation losses in the walls The three main mechanisms of radio propagation are attributed to reflection, diffraction, and dispersion. These three effects cause distortions in the radio signal that suffers attenuation due to losses in its propagation [4]. Common effects on the buildings that do not appear in free field are losses through the walls, roofs, and floors. This effect, together with the multipath and diffraction caused by the corners, is very difficult to evaluate, and there are many publications about mathematical models of indoor radio propagation [5][6][7]. The propagation losses value is given in the next equation, where the effect of the losses due to multipath effect is added [8] [9]: L(dB) = Lo + 10n log(d) + kF + IW + Lms Lo = power losses (dB) at a distance of 1m (40 dB at 2.4 GHz frequency) n = attenuation variation index with the distance (n=2) d = distance between transmitter and receiver k = number of plants that the signal crosses F = losses through the floors I = number of walls that the signal crosses W = wall losses Lms = multipath effect losses Nevertheless, from a practical design point of view, we will use simple statistical models of the wall’s absorption in order to predict how many walls the WLAN signal will be able to cross whilst maintaining connectivity. The reception power (applied to a wireless network of these characteristics) is given by the following equation when the propagation of the signal crosses i walls and the transmitter is 1 meter from the first wall: Pr = Prx1m + Gtx + Grx – 20log d – 20 log (4π/λ) – Σ Lpi – Lms (1) Pr = Received power Prx1m = Received power at 1 meter of the transmitter Gtx = Transmitter gain Grx = Receiver gain d = Distance between transmitter and receiver 20 log (4π/λ) = 40 dB for 2.4 GHz ΣLpi = Propagation losses due to the walls Lms = Propagation losses due to multipath effect The value of Lms has been estimated by means of field measures, obtaining a value of between 12 dB and 20 dB. In order to assure coverage, the worse case scenario corresponding to 20 dB was taken in this work. Next, the received power at a distance of 1 meter from the wireless access point is calculated: Prx1m = Ptxap+Gtx+Grx-Lprop–Lms
(2)
Prxap = Transmitted power by the access point Gtx and Grx = Antenna gains (at the transmitting and receiving sides). Lprop = 20log(4π/λ) propagation loss at 1 meter in free field. Lms = Multipath loss. According to the equipment used (AP power rated at 16 dBm, and both antennas at 2 dBi), the power received at 1 meter from the AP is: Prx1m = -40 dBm
(3)
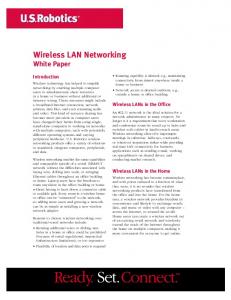
The method employed for estimating wall absorption consists of locating an area of consecutive walls (usually a corridor of office rooms) in the building.
Fig. 1. Consecutive walls used in the measurements for obtaining the mean loss through the walls of a building.
According to figure 1, the transmitter is located at a fixed position ‘0’, 1 meter apart from the wall and a series of measures are taken at points 1-3-5-…-13 using a wireless card connected to a laptop, and signal monitoring software. Using equation (1) and (3), it is possible to calculate the loss through the first wall. L0-1 = -40 – 20 log (d) – Pr1 Pr1 is the received power at point ‘1’ and d=2 in this case. In order to compute the loss at the second wall: L2-3 = -40 – 20 log (d) – Pr3 – L0-1 Where Pr2 is the received power at point ‘3’ and d=4.5 in this case (wall separation is 2.5 meters for all rooms). After measuring the losses through each wall, a mean value is computed. This mean value will be employed as a value of reference for all the walls of this building. The next table shows the values of attenuation obtained from a specific building. As can be seen, not all of the walls produce the same attenuation in spite of the fact that they are made from the same materials. This variation is produced by the multipath effect (which is unknown). Obtaining a mean value the error caused by multipath effect is reduced. Wall 0-1 2-3 4-5 6-7 8-9 10-11 12-13 Mean
Loss [dB] 7.98 6.04 7.16 2.34 0.03 2.36 4.62 4.36
Next, we are ready to estimate the number of walls the wireless signal can cross without loss of connection. Below is the deduced expression for threshold power:
Pu = Treshold power Lp = Loss per wall n = number of walls crossed The following expression can be used to obtain the number of walls that the signal can cross within a specific threshold power: Prx1 m − 20 log d − L p − Pu 10
And this other expression provides the maximum distance as a function of the number of crossed walls:
d = 10
Prx1 m − L p − Pu −10 log n 20
Applying last equation, a table that shows the maximum distance allowed as a function of number of walls crossed by the signal is shown below. The power threshold is fixed at -80 dBm, which is the typical sensitivity value for the majority of commercial wireless LAN cards (at a transmission speed of 11 Mbps). 1 wall 2 walls 3 walls 4 walls 5 walls Distance (m)
85
60
49
42
1 7
2 5.25
3 6.5
4 6
5 8.20
Afterwards, a check on resemblances between the models and the real measures taken in the buildings was carried out. The validity of these models was confirmed. The next table shows the results obtained in various buildings:
Pu =Prx1m – 20 log (d) – Lp – 10 log (n)
n = 10
Model Lp (dB)
38
It would be interesting to notice an irregular behavior in the signal attenuation when crossing a wall next to a toilet. Is this case, the loss caused by these walls is significantly greater than that caused by the common walls of the building. This loss can be as great as 20 dB. The pipes embedded in the walls of these pieces probably cause this behavior. Consequently, special treatment of these walls can be taken in the computation of coverage in the building. As a rule of thumb placement of access points in the proximities of toilets must be avoided, so a big area of poor coverage will be created on the other side of the toilet. It is understandable that different buildings built in different periods and with different building techniques will have different wall attenuation characteristics. Consequently, the study of wall loss would be made in each building of the campus. However, in order to save field measures in all the campus buildings, they have been classified according to the building techniques and material employed for construction. After some fieldwork, five different models have been established. All the buildings are matched with one on these models:
Building Sports DCAN EUITI I3 DOEFFC 5I 5D 5E 1B Architecture 1E Computer Sc. Faculty 1F DSIC 1G EUI ETSA Block 2 ETSIA Block 3 3A - 2E 3M Fine Arts Mean value
Mean 7 5.25 6.41 6.12 6.47 6.33 6.53 6.6 5.83 6.81 7.35 6.32 4.66 5.62 5.19 8.21 6.29
Model 1 2 3 4 3 3 3 3 4 1 1 3 2 4 2 5
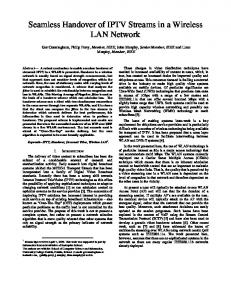
The mean value has also been obtained. It can be used in case of unknowing the model classification of the building. After obtaining the loss of signal power due to the wall, next step is to examine the building plane to be covered with access points. With the obtained data the wireless coverage can be designed from the far away points on the map. As shown in figure 4a, the intersection between the cover zones designed will be the zone where the access point would be installed. The propagation signal between adjoining floors in a building is quite low, due to metal wrought between that acts as a front. Although if you are exactly above the AP of the inferior plant or vice versa, it is possible to receive a slight signal, and the signal attenuates quickly as soon as you go away. A good sign is only achieved between plants if the building has crystal interior patios (crystal skylights) and the AP is located there. This option has been carried out with success in buildings that gathered these conditions, saving APs, but it is not possible to apply it to most of them. As an example of this, the building of the Higher Polytechnic School of Gandia (figure 4b), where advantage has been taken of the crystal skylights to minimize the number of access points. On the other hand, the residual propagation between plants can cause interferences between channels in some points, so an appropriate plan of frequencies is needed, and it is explained in the following point.
4. Interferences between channels The 802.11b standard (in ETSI countries) provides 13 channels inside the ISM band, which belong to 13 frequencies between 2412 MHz and 2472 MHz. However, the spectrum width used by each channel is overlapped by the adjacent channels, causing interferences. These interferences are higher in closer channels. The following table shows the level of interference classified in three levels. Adjacent 1 2 3 4 5 6 7 8 9 10 11 12 13 Ch 1 2 3 4 5 6 7 8 9 10 11 12 13 Interferences between channels Risk of interferences between channels Few or no interference between channels Concerning the previous table, in order to select the maximum number of simultaneous channels without any interference, the channels: 1 - 5 - 9 – 13 must be used. However, if a slight interference that does not degrade the system in the practice is tolerated the channels 1 - 4 - 7 10 – 13 can be used. This second option provides one usable channel more, 5 in total. To be able to reuse these channels, you would have to go far away enough to have no interference, from the horizontal and the vertical points of view. Figure 2 shows how to distribute 4 channels over a horizontal area, repeating channels to minimize interference. Each color represents one of the 4 channels without interferences between them. In figure 3 is demonstrated the same as before but taking into account the floors of the building.
5. Outdoor coverage study Outdoors, it should be considered that you could have different types of antennas (directional, omni-directional, etc.) to offer the highest coverage. Once the different radiation antenna diagrams have been studied, the position, the height, and the angle of inclination would be
Fig 2. An optimal 4-channel distribution over a horizontal area. Floor 4
Floor 1
Figure 3. Optimal 4-channel distribution in a building. chosen to install and cover the desired area. In this case the antennas were placed where it was necessary to have good coverage. To find the corresponding mathematical calculation, the following equation can be used: Perceived = Prx1m + Gtx + Grx – Lprop Prx1m = Power received at 1 meter from transmitter distance. Gtx = Transmitter gain. Grx = Receiver gain. Lprop = 20log(4πd/λ) propagation losses
6. Measurement results Despite there are available WLAN design software [10], we used our own strategic following the study's directive mentioned at point 2. All the buildings on the campus of the Polytechnic University of Valencia have been studied. There are more than 50 buildings with quite a lot of plants spread over two square kilometers. The first part of this work consisted on measure walls attenuation and the second one was the study of it in the planes of the buildings. During the study, it has been interesting to contrast the different wall attenuation values among buildings. The campus of the Polytechnic University of Valencia has been built over different time periods and the materials and the constructive techniques that have evolved along this period have affected decisively in the development of this work.
After these previous studies, and with the propagation parameters obtained, it is checked if only one AP can cover all the floor of the building. If it is not possible, it is tried using two AP. Afterwards, the covering, theoretically calculated, is tested in situ through a test of AP. It is possible the signal does not to arrive as far as expected, or otherwise, it is possible that it arrives at areas that initially and theoretically did not seem feasible. It is due to the multipath effect, and it is very difficult to evaluate theoretically. If there is a high disparity between design and in situ measures, you can add or remove one AP if it is needed. In the final report of each building, two results are presented regarding the number of AP used: the first one ensures 100% coverage of the whole area, and the second one economizes the number of access points assuring a 95% coverage and reducing the number of necessary AP to around 10%. In figure 4c and 4d measurements for the final coverage of two building using one and two AP are shown. It can be appreciated that in some extreme areas coverage has been sacrificed with the purpose of not increase the number of AP. Outdoor coverage studies have also been carried out. In these cases, calculations are easier due to the fact that obstacles are not presented. In figure 4e coverage of the central walk of the University campus is shown. In these cases, the integrated monopole of the AP is substituted by more external antennas. It has been solved using two sectorial antennas in particular, although in figure 4e the alternative of a single omni-directional antenna is also shown.
7. Conclusions In this work, a complete study of the coverage of a University campus has been developed. As a result of this study, the optimal locations for the wireless AP are obtained, and indoor and outdoor coverage maps for all the buildings of the campus are drawn.
Finally, a working method has been developed providing quite satisfactory results. It could be able to contribute positively in other similar studies in the future. At the moment, the wireless network in the campus of the Polytechnic University of Valencia is in the deployment phase following the guidelines of this work.
8. Acknowledges The authors want to thank the Computer Center of the Polytechnic University of Valencia and especially to Carlos Turró, for his collaboration maintained throughout this project.
References [1] M.S. Gast, "802.11 wireless networks: the definitive guide", Ed. O'Reilly, Sebastopol, 2002 [2] B. O'Hara, "The IEEE 802.11 handbook: a designer's companion", IEEE Press, New York, 1999 [3] http://www.valenciawireless.org [4] http://www.sss-mag.com/indoor.html [5] C.C. Chiu and S.W. Lin, "Coverage prediction in indoor wireless communications," IEICE Trans. Commun.,vol. E79-B,no.9,pp. 1346-1350,Sep. 1996 [6] W.C. Chang, C.H. Ko, Y.H. Lee, S.T. Sheu, Y.J. Zheng,"A Novel Prediction System for Wireless LAN Based on the Genetic Algorithm and Neural Network", Proc. IEEE 24th Conference on Local Computer Networks, Oct. 1999, Lowell, Ma, USA [7] R. A. Valenzuela, "A Ray Tracing Approach to Predicting Indoor Wireless Transmission", IEEE Vehicular Technology Conference, Secaucus NJ, May 18-20, 1993, 214 – 218 [8] http://www.sss-mag.com/pdf/1propagation.pdf [9] José Maria Hernando Rábanos “Transmisión por radio”, Editorial C.E. Ramón Areces S.A., 1997 [10] S.J. Fortune, D.M. Gay, B.W. Kernighan, O. Landron, R. A. Valenzuela, M.H. Wright, WISE Design of Indoor Wireless Systems, IEEE Computational Science and Engineering, 2, 1, pp. 5868 (Spring, 1995).
a) Access point place choice.
b) Higher Polytechnic School of Gandia lower and first floors of A building
c) Library. First floor
d) Higher Technical School of Telecommunications Engineering building. First floor
e) Outdoor coverage. Walkway and Agora with 2 directive antennas and with 1 omni-directional antenna. –30 > S > -50 dBm
–50 >S > -70 dBm
–70 >S > -80 dBm
Fig. 4. Covering results in different campus buildings
S < -80dBm