1088
IEEE TRANSACTIONS ON INTELLIGENT TRANSPORTATION SYSTEMS, VOL. 16, NO. 3, JUNE 2015
Wireless Sensor Networks for Condition Monitoring in the Railway Industry: A Survey Victoria J. Hodge, Simon O’Keefe, Michael Weeks, and Anthony Moulds
Abstract—In recent years, the range of sensing technologies has expanded rapidly, whereas sensor devices have become cheaper. This has led to a rapid expansion in condition monitoring of systems, structures, vehicles, and machinery using sensors. Key factors are the recent advances in networking technologies such as wireless communication and mobile ad hoc networking coupled with the technology to integrate devices. Wireless sensor networks (WSNs) can be used for monitoring the railway infrastructure such as bridges, rail tracks, track beds, and track equipment along with vehicle health monitoring such as chassis, bogies, wheels, and wagons. Condition monitoring reduces human inspection requirements through automated monitoring, reduces maintenance through detecting faults before they escalate, and improves safety and reliability. This is vital for the development, upgrading, and expansion of railway networks. This paper surveys these wireless sensors network technology for monitoring in the railway industry for analyzing systems, structures, vehicles, and machinery. This paper focuses on practical engineering solutions, principally, which sensor devices are used and what they are used for; and the identification of sensor configurations and network topologies. It identifies their respective motivations and distinguishes their advantages and disadvantages in a comparative review. Index Terms—Asset management, condition monitoring, decision support systems, event detection, maintenance engineering, preventive maintenance, railway engineering, wireless sensor networks (WSNs).
I. I NTRODUCTION
E
XPERTS estimate that the railway industry will receive US$300 billion worth of global investment for development, upgrading, and expansion over the five years from 2009 [43]. Ollier [98] noted that effective management of rail infrastructure will be vital to this development, upgrading, and expansion, particularly if coupled with a move to intelligent infrastructure [39]. A key part of the management will be condition monitoring. Condition monitoring detects and identifies deterioration in structures and infrastructure before the deterioration causes a failure or prevents rail operations. In simple condition monitoring, sensors monitor the condition of a structure or machinery. If the sensor readings reach a predetermined limit or fault condition, then an alarm is activated. However, this simManuscript received April 2, 2014; revised August 8, 2014; accepted October 17, 2014. Date of publication November 20, 2014; date of current version May 29, 2015. This work was supported by the U.K. Engineering and Physical Sciences Research Council under Grant EP/J012343/1. The Associate Editor for this paper was X. Cheng. The authors are with the Department of Computer Science, University of York, YO10 5GH York, U.K. (e-mail:
[email protected]; simon.
[email protected];
[email protected]; anthony.moulds@york. ac.uk). Color versions of one or more of the figures in this paper are available online at http://ieeexplore.ieee.org. Digital Object Identifier 10.1109/TITS.2014.2366512
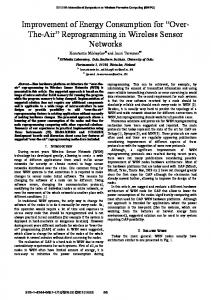
Fig. 1. Figure shows a typical WSN setup for railway condition monitoring. Sensor devices are mounted on boards attached to the object being monitored; examples include track, bridges, or train mechanics. One or more sensors are mounted on a sensor board (node) (see also Fig. 2). The sensor nodes communicate with the base station using a wireless transmission protocol; examples include Bluetooth and Wi-Fi. The base station collates data and transmits it to the control center server possibly through satellite or GPRS. There are variations on this setup. In some systems, the sensor nodes may communicate directly with the server rather than via the base station. In other systems, the user accesses the data directly via the base station.
plistic approach may lead to a large number of false alarms and missed failures [36]. It only provides local analysis but does not take advantage of the superior capabilities when the sensors are networked and their data processed collectively. Integrated data processing allows an overall picture of an asset’s condition to be achieved and overall condition trends to be determined [97]. In recent years, networking technologies such as wireless communication and mobile ad hoc networking coupled with the technology to integrate devices have rapidly developed. The new technologies allow vast numbers of distributed sensors to be networked [5], [6], [37], [45], [122] to constantly monitor machines, systems, and environments. Wireless sensor networks (WSNs) [5], [134] are wireless networks of spatially distributed and autonomous devices. They use sensors to cooperatively monitor infrastructure, structures, and machinery. A typical WSN for railway applications is shown in Fig. 1. Each sensor node generally has a radio transceiver, a small microcontroller, and an energy source, usually a battery (see Section II-C for more detail). WSNs and data analytics allow the railways to turn data into intelligence [43]. They provide decision support through continuous real-time data capture and analysis to identify faults [52]. The data from distributed systems such as sensor networks are constantly monitored using classification [56], [57], prediction [85], or anomaly detection [61] to determine the current and future status of the distributed network. Lopez-Higuera et al. [78] developed a staircase of structural health monitoring, where the higher the level, the
This work is licensed under a Creative Commons Attribution 3.0 License. For more information, see http://creativecommons.org/licenses/by/3.0/
HODGE et al.: WSNS FOR CONDITION MONITORING IN THE RAILWAY INDUSTRY: A SURVEY
higher the complexity and functionality. The simplest Level 1 systems detect the presence of damage without locating it, whereas Level 2 provides location information. A Level 3 system is able to grade the degree of damage and a Level 4 system can estimate the consequences of the damage and remaining service life. Finally, a Level 5 system will comprise complex hardware, custom algorithms and software to allow the diagnosis and/or the prognosis and even to recommend the solution to a problem. WSN monitoring provides continuous and near real-time data acquisition and autonomous data acquisition (no supervision is required); increased frequency of monitoring compared with manual inspection; improved data accessibility, data management, and data use compared with non-networked systems as all data can be collected and processed centrally; the ability to combine data from a wide variety of sensors; intelligent analysis of data to “predict and prevent” events using intelligent algorithms; the ability to turn data into information about the status of important structures, infrastructure and machinery; and, a global data view that allows trending information to be determined where degradation is happening slowly over a relatively long period of time. WSN monitoring can be used to: 1) 2) 3) 4) 5) 6)
maintain process tolerances; verify and protect machine, systems and process stability; detect maintenance requirements; minimize downtime; prevent failures and save businesses money and time; request maintenance based on the prediction of failure rather than maintenance running to a standard schedule or being requested following an actual failure.
There are a number of challenges with WSNs. They generate large amounts of data at rapid rates and often on an ad hoc basis. Data may be produced from multisources that have to be fused. The systems and structures monitored using sensors often exhibit complex behavior, which is difficult to understand and interpret [102]. Hence, the data must be carefully managed to provide a view of the system status. Sensor data are very noisy and sensors themselves can become defective wherever they are installed. Sensor data may contain errors, particularly where the sensors are subject to harsh conditions as this exacerbates sensor and communication failures. Sensor networks often have to be installed in challenging environments to be able to monitor structures and infrastructure. For example, Palo [99] noted that their system had to work in extreme conditions in Sweden, with a temperature range between +25◦ C and −40◦ C and with large quantities of snow. Grudén et al. [55] mounted sensors on the train’s bogies to monitor bogie temperatures and noted that train environments are very harsh environments for electronics with high accelerations and large shocks. The sensors need to be carefully located to ensure their measurements are useful and do not replicate the measurements of other sensors, which can skew the distribution of the collected data. The type of sensor used needs to be carefully considered to ensure the maximum value and the best quality data. WSNs can use a set of homogeneous or heterogeneous sensors. Sensors are often located away from energy supplies, thus require either batteries or some form
1089
of local energy generation to power them. If there are errors in transmission across the WSN, then data may be missing. These last two points form a paradox, WSNs need to minimize energy usage yet communication needs to be maximally efficient and communication requires energy. This survey paper describes WSNs for railway condition monitoring focusing on systems described in the academic literature. In this survey, “sensor” refers to an individual device such as an accelerometer or strain gauge. “Node” refers to a whole sensor unit that comprises the sensor, a power supply, a data transmitter/receiver, and a microcontroller. Section II of the survey discusses the design and range of sensor devices, Section III analyzes the network topology and transmission techniques, and Section IV reviews the sensors used in the literature to monitor railway equipment and structures. Section V draws conclusions, and Section VI examines future work in the area of railway monitoring. II. S ENSOR D ESIGN There are a multitude of sensors types used in railway condition monitoring for analyzing different aspects of structures, infrastructure, and machinery (see Table I in the Appendix). The devices in Table I are transducers. Transducers convert energy from one form to another. In the case of sensors, the device typically converts a measured mechanical signal into an electrical signal. Most railway sensors fall under the umbrella type microelectromechanical systems (MEMS). MEMS are small, integrated devices, or systems that combine electrical and mechanical components. They are cheap and efficient [70]. Sensor design requires a tradeoff between functionality and power consumption, with functionality often coming at the cost of power. Condition monitoring systems for railways are often deployed in remote or inaccessible locations, where there is no wired power supply available. Hence, the sensors must receive power from either batteries or local energy generation. MEMS sensors have the advantage that they can be produced to consume ultralow power [19]. A. Measurement Sensors Table I provides an overview of the sensor types used in railway condition monitoring and the measurements produced. Sensor devices may also return additional ambient measurements such as temperature and humidity, and sensor data can be combined with the measurements from other systems. Rabatel et al. [103] noted that the behavior of assets is often affected by external factors. These external factors are encapsulated by contextual data, which describe the ambient running conditions. It is important to take them into account and build models for condition monitoring that consider these ambient conditions. Hence, Elia et al. [44], Rabatel et al. [103], and others incorporated wider ranging contextual data with the sensor data. Elia et al. [44] included train speed, position along the line (longitude and latitude from GPS system), and wind speed and direction when analyzing bogie vibrations, whereas Rabatel et al. [103] included structural criteria (route) and environmental criteria (weather, travel characteristics, travel duration) when analyzing bogie temperatures.
1090
IEEE TRANSACTIONS ON INTELLIGENT TRANSPORTATION SYSTEMS, VOL. 16, NO. 3, JUNE 2015
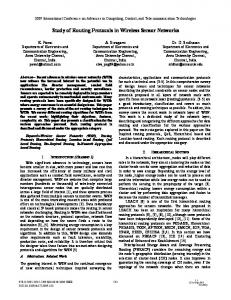
Fig. 2. Diagram of the composition of a typical sensor node. Multiple sensors may be mounted on the node. The microcontrollers used in sensor nodes are ultralow-power microcontrollers to conserve energy.
B. Sensor Nodes Sensor devices are mounted on boards. The boards form a platform combining mobile computing and wireless communication (media access control (MAC), routing and error detection) with sensor devices as shown in Fig. 2. Many sensor nodes are moving toward enabling data interrogation and autonomous data processing to identify anomalies in situ. Hence, many data processing algorithms have also been embedded in wireless sensor nodes for autonomous execution [80]. The boards generally comprise one or more wireless sensors, a microcontroller, transceiver, data storage (memory), and a power source. If the data sampling rate is low, for example, when monitoring the growth of a crack over a period of time, then the microcontroller, memory, and transceiver power can all be low. However, for frequent sampling such as monitoring the temperature of a mechanical bearing every second, then the microcontroller, memory, and transceiver must be more powerful. Lynch and Loh [80] provided a thorough overview of sensor boards for WSNs. C. Sensor Power Sensor nodes often use batteries as their energy source. Batteries have a finite life. The batteries in an accelerometer monitoring a train pantograph only lasted 20 days [97]. Chebrolu et al. [32] were able to extend battery life to 1.5 years for 4 AA batteries by only waking their sensors when required and sleeping otherwise. However, even with extended life, fitting and replacing batteries is not always possible in remote and inaccessible railway locations. The nodes may also be embedded in the monitored structure or mechanics of a train, where no access to batteries or wired connection is possible. Hence, authors have considered alternative energy sources for nodes. These need to be reliable to allow the WSN to function for long periods of time with no human involvement and able to generate sufficient power. Nagode et al. [89], Nelson et al. [92], Nuffer and Bein [96], Pourghodrat [101], Tan et al. [120], and Wischke et al. [130] investigated ambient energy harvesting technology for powering WSNs. Piezoelectric materials can produce electricity as a response to mechanical strain such as the strain exerted on the track or sleepers by a passing train. Piezoelectric materials are robust, able to withstand harsh environmental conditions,
and can deliver a large amount of energy [55]. Nelson et al. [92], Nuffer and Bein [96], Pourghodrat [101], Tan et al. [120], and Wischke et al. [130] investigated piezoelectric vibration harvesters that derive energy from the vertical displacement or vibration of tracks, ties, and sleepers. Wischke et al. [130] were able to demonstrate that sufficient energy could be harvested to supply a microcontroller with a radio-frequency (RF) interface. Tan et al. [120] noted that their rate of energy harvesting (≈1 mW) was lower than the typical rate of energy consumption of sensor systems (≈10–100 mW). Hence, they stored the harvested energy using supercapacitors and the sensors only drew energy when sufficient stored energy was available. Nagode et al. [89], Nelson et al. [92], and Tan et al. [120] all used inductive coils for harvesting. Electromagnetic harvesters such as induction coils have a higher power density than piezoelectric [69]. Nelson et al. and Tan et al. used the vertical movement of the track to generate energy. Nagode et al. designed and built two prototypes of a vibration-based electromagnetic (inductive coil) system. They both harvested mechanical energy from the movement of a rail wagon’s suspension springs to power sensors mounted on the wagons. The first prototype used the movement of the springs to generate linear motion in magnets to produce a voltage. The second prototype converted the linear motion of the wagon’s suspension coils into rotary motion then magnified and rectified the motion to turn a generator. Pourghodrat [101] developed a hydraulic energy harvester, which generated energy from compression and relaxation of fluid driving a hydraulic motor. It used the vertical displacement of the track for energy generation. Hydraulic harvesters can generate energy from smaller track deflections compared with electromagnetic, but the devices are still in development [101]. A number of authors have investigated using solar energy harvesting to power sensors. Bischoff et al. [19] investigated a solar energy rechargeable battery-powered base station. Sekula and Kolakowski [111] powered their piezoelectric strain sensors using accumulators permanently charged by photovoltaic modules. Solar power is a proven way to generate energy. However, it has a number of practical drawbacks for WSNs. Solar panels used to generate energy need frequent cleaning for optimal performance [55]. Sunlight varies on a daily basis, and sunlight is very limited in winter months in many global regions and power generation is adversely affected by bad weather. Hence, Wolfs et al. [131] powered accelerometers and gyroscopes using solar power with battery backup and Waki [125] powered a temperature sensor by a solar cell with a double-layer capacitor power supply for back up. These double layer capacitors have a longer life than a battery. If the sensor nodes can be put into “sleep” mode and only woken when they are required, then their energy usage can be minimized. A number of bridge monitoring systems use this wake-on-event two-layer event detection. It requires two types of sensors: one set have lower power consumption to perform event detection and wake the second set of sensors using interrupts, [19], [32], [46], [70], [73] and [107]. Bischoff et al. [19], Feltrin [46] and Kruger et al. [70] detected approaching trains using ultralow-power MEMS acceleration sensors. These measured the vibrations of the bridge and detected the increased vibrations when a train approached. Similarly, Ledeczi et al. [73]
HODGE et al.: WSNS FOR CONDITION MONITORING IN THE RAILWAY INDUSTRY: A SURVEY
used standard strain gauges to sense the approaching train and woke the system by detecting changes in stress on the bridge. Sala et al. [107] used activation sensors type not specified) to wake their system for monitoring steel truss bridges. In contrast, Townsend and Arms [123] used a similar technique but with only one set of track-mounted strain gauges, which varied their sampling rate depending whether a train is present. They operated in low sampling mode of approximately 6 Hz to detect the increase in strain when a train approached. Once detected, the sensors increased their sampling rate and generated a strain waveform for data analysis. The authors stated that this reduced the power from 30 mA for continuous mode to less than 1 mA for event detection. Chen et al. [35] introduced a prototype system that developed this further by detecting approaching trains, waking the measuring sensors on the bridge trusses and then downloading the measured data onto the passing train, which acts as a data mule. Another data muling approach is the BriMon system [32], where trains were fitted with a beacon. A bridge-mounted high-gain antenna detected the train’s beacon 30+ seconds before the train approached and woke the batteryoperated accelerometers on the bridge. The accelerometers measured the vibrations of the passing train on the bridge and uploaded their data to the passing train. This data muling only requires local data transmission, which reduces the power usage further. III. N ETWORK D ESIGN WSNs enable continuous real-time capture of data. However, WSNs need to be able to handle the harshness of outdoor longterm condition monitoring; often in hostile environments and must minimize energy usage as the nodes are not attached to a wired power supply. They typically use low-power sensors powered by batteries although authors are investigating alternative power supplies such as local energy generation. Hence, the network to enable data capture has to be carefully designed to overcome these factors and prevent transmission errors, latency, network outages, missing data, or corrupted data. A. Base Station The base station controls the sensor nodes and acts as a gateway for data transmission to a remote server. The sensor nodes use short-range communication such as Wi-Fi or Bluetooth to transmit data to the base station. The base station uses longrange communication such as GPRS or satellite to transmit collated data back to a server at a control center. It has a more powerful processor and more memory than the sensor nodes to allow it to collate data from multiple sensors. Hence, the base station requires more power. For example, train monitoring systems have battery-powered sensor nodes in the carriages but place the base station in the locomotive, where more power is available from the train engine. B. Relay Nodes Sensor nodes are energy-constrained, thus only having a short transmission range. If they cannot reach the base station,
1091
then higher capability relay nodes may be used. This is a particular issue in restricted environments such as railway tunnels, along the length of trains or along railway tracks. Relays ensure connectivity by relaying the data signal from the sensor node to the base station via one or more relay nodes using wireless multihop paths. Network nodes can be multifunctional. Hoult et al. [62] and Shafiullah et al. [112] both used sensor nodes that also function as relay nodes to transmit data. C. Network Model WSNs for railway applications follow the open systems interconnection model [137]. A typical WSN has five layers in a protocol stack with three planes [5], [6] to transmit data from the sensor nodes to the base station. The five layers from lowest to highest are the physical layer defines how the sensors transmit their data to the network. The data link layer specifies the network topology and connects nodes to each other. It uses MAC to control data access and permissions and a logical link control to control error checking and data packet synchronization. This is a key layer in railway monitoring WSNs as they may be monitoring difficult environments such as tunnels or monitoring moving trains. The topology must be carefully designed. The network layer routes the data through the network as packets. Railway WSNs are energy constrained; thus, routing has to be carefully designed to work within the available energy supply. The transport layer controls the sending and receiving of data. Finally, the application layer allows application software to access the data. The size of the transmission varies from bits in the lowest (physical) layer, bytes, and frames in the data link layer, packets in the network layer, segments in the transport layer, and data in the highest (application) layer. The power management plane manages the power consumption of sensor nodes. The mobility management plane identifies and records the movement of sensor nodes to ensure that data can be routed from the node to the control center and so that sensor nodes are aware of their neighbors for communication. This is important for WSNs monitoring moving trains. The task management plane balances and coordinates network regions (groups of nodes) and ensures that they generate data according to their power level. D. Sensor Network Topology (Data Linkage) The topology is constrained by the requirements of the monitoring and by the physical environment. Sensor nodes can be arranged in either an ad hoc or a preplanned configuration [134]. In ad hoc arrangement, sensor nodes are randomly placed in the monitored area. In preplanned arrangement, sensor nodes are arranged in either a grid, optimal placement [100] (described next), 2-D or 3-D placement [134]. Determining the optimum node placement is a complex task and often requires a tradeoff. The network configuration can be optimized against a number of different constraints. A network may minimize relay nodes, may need to ensure a minimum level of service (include a certain level of redundancy), minimize energy usage to preserve battery life, or may
1092
IEEE TRANSACTIONS ON INTELLIGENT TRANSPORTATION SYSTEMS, VOL. 16, NO. 3, JUNE 2015
Fig. 3. Diagram of a star, tree, and mesh network topology (from left to right) where the circles represent sensor nodes and the boxes are base stations.
signal attenuation and loss, and it is not robust due to its dependence on a single base station to manage the network. A tree topology is a hierarchy of nodes, with the root node serving client nodes that, in turn, serve other lower level nodes. In a tree, the nodes can be grouped at each level. The network is scalable. Messages pass from the sensor nodes through the tree branches to the root. Sensor nodes can communicate with their parent or with other nodes in a group within transmission range. In contrast, in a mesh topology, any node in the network can communicate with any other node in the network that is within transmission range. This enables relaying of messages (multihop communication) keeping the transmission power low, saving energy compared with transmitting directly from sensor nodes to base station in a single hop, and allowing nodes to communicate indirectly with nodes outside their transmission range. The network can be easily extended by adding new nodes and also incorporates fault tolerance as failed nodes can be bypassed using alternative routes. E. Communications Medium
Fig. 4. In a typical WSN, the sensor nodes are arranged in a star, tree, or mesh topology and transmit data to the base station, which relays the data to the control center via longer range communications.
need to ensure accessibility of the nodes [116]. For example, Pascale et al. [100] optimized a WSN for signaling and control in railway stations to calculate the minimum number of nodes required. The authors had to optimize the tradeoff between reliability versus communication delay. Determining the best settings proved difficult as it required iterative graph optimization, which is computationally complex. They split the optimization into two tasks: deployment optimization to minimize the number of nodes while maintaining a minimum level of reliability, and scheduling optimization which allocates nodes while maintaining a maximum level of delay. The authors concede that the reliability versus communication delay tradeoff cannot be solved for all situations. The railway environment can also place constraints on the network topology. Signal propagation within a rail tunnel is different from propagation outside [77], [88], [116]. The complex geometry and rough surfaces of rail tunnels degrade RF signals. Conversely, the regular, tube-like shape can act as an “oversized waveguide” [88]. Therefore, Stajano et al. [116] and Liu et al. [77] developed models to predict the signal strength at each node in a tunnel. Node placement can then be optimized using an algorithm based on parameters such as transmission strength, battery life, and redundancy between the sensor nodes and the base station. The natural topology choices available for WSNs in rail applications are star, tree, and mesh topologies (see Figs. 3 and 4). In a star topology (single point-to-multipoint), there is a single base station that can send and/or receive messages to/from a number of remote sensor nodes. The remote nodes can only communicate directly with the base station but not with each other. This topology is simple; the point-to-point connection will result in fewer transmissions and fewer collisions; and, it has low communication latency. The disadvantages are the base station must be within transmission range of all nodes, remote nodes must increase their transmission power to overcome
There are many communication techniques used in WSNs in railways [3], [108]. Intersensor communications and sensor to base station transmission are usually short range. The base station transmits gathered data back to the control center, and this requires long-range communication. WSNs can use technologies based on standard mobile telephony (Bluetooth, GSM, GPRS, and UMTS) or broadband techniques such as Wi-Fi (IEEE 802.11, 2007), wireless personal area networks (WPANs) (IEEE 802.15.4 and ZigBee [11]) or WiMax [2] (IEEE 802.16.2, 2004). ZigBee enhances IEEE 802.15.4 by including authentication, data encryption for security, and data routing and forwarding. Mobile telephony and WiFi are peerto-peer only, whereas WPANs and WiMax can connect many devices in a mesh topology, where any node can communicate with any other node. In addition, Wi-Fi, WPANs and WiMax allow communication at much higher speeds and bandwidths than mobile telephony and are cheaper to set up. However, mobile telephony has better coverage and range than Wi-Fi and WPANs. WiMax can operate over long distances. However, there is a tradeoff: either high bitrates or long distances but not both. An important recent communication advance has been GSM-R (Global System for Mobile CommunicationsRailway), which is an adaptation of GSM telephony for railway applications. It is designed for information exchange between trains and control centers. Its main advantages are its low cost and worldwide availability. Another common technique for railways is the radio system Terrestrial Trunked Radio, which is a standard for data communication for closed user groups [108]. It is a private mobile telephone system and is easily deployed using a series of antennas at stations or control centers along the railway routes. F. Transmission and Routing Sensor nodes use the greatest amount of energy during data communication. The transceiver in the sensor node contains frequency synthesizers, mixers, voltage control oscillators,
HODGE et al.: WSNS FOR CONDITION MONITORING IN THE RAILWAY INDUSTRY: A SURVEY
phase-locked loops, and power amplifiers [6]. These all consume power. Thus, data transmission and routing has to be carefully designed to minimize the energy usage. When messages are transmitted through tree or mesh networks, they have to be routed to ensure they pass from source to destination (sensor node to base station). Message latency increases as the number of hops required to transmit the message increases; thus, the routing protocol must be carefully designed for the particular WSN topology. A number of routing protocols have been proposed recently (see [4]). If the base station fails in any topology, then the routing also fails. Thus, when Mahlknecht and Madani [81] used a daisy chain (tree) topology, they ensured that the nodes in the chain could also directly communicate with the global communication network if no base station was accessible. Another important consideration of multihop communication is interference prevention. For train-mounted WSNs, if two trains, Train A and Train B, are within radio communications range of each other, then data from sensors on Train A must never be transmitted to Train B and vice versa [104]. Reason et al. [104] used identifiers to bind the sensors to the individual train’s network. The sensor nodes need to transmit data reliably via the network despite having only a limited power supply available. Hence, energy efficiency and reliability are both vital for WSNs. One important disadvantage of multihop (tree or mesh), in general, is that the power consumption of the nodes near the base station is much higher as they are used in data transmission to the base station and hence suffer energy drain. A possible solution to minimize energy usage and maximize fault tolerance is to use multihoming. This is used in the Internet and provides multiple connections (multiple routes) between points thus introducing a degree of fault tolerance and ensuring that no extra energy is required to transmit data. Aboelela et al. [1] mapped every node in the network to two clusters. One set of nodes operated as guardians of the clusters and cluster nodes transmitted via two designated cluster guardians. Each cluster guardian thus acted as a relay node and forwarded data from one cluster to the other or to the base station for processing. Another issue with the ad hoc nature of WSNs is transmission interference. The MAC protocol must minimize both power usage and data broadcasting collisions. WSNs use IEEE 802.15.4, which uses carrier sense multiple access with collision avoidance multiplexing. This allows multiple nodes to access the same channel at different times without interference. However, the 2.4-GHz ISM band used by IEEE 802.15.4 is crowded causing variable and unpredictable transmission. Therefore, Liu et al. [76] investigated frequency diversity (FD) using modified sensors to monitor an underground railway tunnel where the confined environment made data transmission difficult. In FD, the data are transmitted using several frequency channels. Liu et al. [76] found that applying FD improved transmission for WSNs in confined environments such as tunnels. Shafiullah et al. combined energy efficient MAC protocols [114] with multifunctional nodes [112]. They developed energy-efficient protocols for IEEE 802.15.4/ZigBee multihop (daisy chain) networks mounted in train carriages. The nodes acted as both sensors and routers to both take measurements
1093
and forward data to a base station in the train locomotive. One MAC protocol (E-BMA) is optimal for low-medium traffic and the second (EA-TDMA) is optimal for medium-high traffic. In E-BMA, sensor nodes use piggybacking to reserve transmission slots rather than sending control messages to reduce transmission and, thus, reduce energy usage. E-BMA also waits for one extra time step to determine if there are multiple packets to transmit and sends them together. EA-TDMA divides the transmission channel into time slots and allocates slots to sensor nodes to avoid collisions. The nodes wake up in their slot, transmit if they have data or switch off immediately if they have no data, and sleep during the remaining time slots to conserve energy. Salaberria et al. [108] developed an alternative multitransmissiontechnique using GPRS. They used two phonecards belonging to different telephone providers on board eachtrain to increase the network coverage. The hardware can then switch between networks depending on network availability. IV. M ONITORING S YSTEM The data from sensors is treated as either a time series, where data are produced continuously or periodically, or a sequence of readings where data is generated ad hoc, for example, generated every time a train passes. The data can be monitored by searching for thresholds (triggers), known problem signatures (classification), identifying unknown events (short-term analysis using outlier detection), or identifying drift over a longer period of time (long-term outlier detection). Condition monitoring can be performed continuously or periodically. Continuous monitoring should detect a problem straight away but it is often expensive; energy hungry, which is a problem for WSNs where the network components need power; and the sensor data are very noisy, which requires careful preprocessing to ensure accurate diagnostics. Periodic monitoring is cheaper, uses less energy, and allows time for data cleaning and filtering but a problem will only be diagnosed at the next processing run. This may be acceptable for some situations that change slowly such as cracks developing in bridges but for time critical scenarios, then continuous monitoring is necessary. In basic condition monitoring, the system is only able to distinguish between normal and abnormal conditions (no fault or fault). Beyond this, systems exhibit increasing levels of monitoring sophistication as outlined by the staircase of structural health monitoring of Lopez-Higuera et al. [78] described in Section I. A Level 5 system will comprise complex hardware, custom algorithms, and software to allow the diagnosis and/or the prognosis and even the solutions. The topology of WSNs often varies over time. One very important factor in this topological variation is the mobility of the sensor nodes. Lorestani et al. [79] subdivided the communications network for their WSN into two: the fixed network relates to sensor nodes in fixed locations such as bridges, tunnels, and special points, whereas the movable network relates to sensor nodes attached to locomotives or rail wagons. The data for the movable network are logged with accompanying GPS coordinates. Movable (on-board) sensors can monitor the whole track length travelled by the train but only monitor the
1094
IEEE TRANSACTIONS ON INTELLIGENT TRANSPORTATION SYSTEMS, VOL. 16, NO. 3, JUNE 2015
sections of the train where the sensor nodes are attached [84]. In contrast, track-mounted (fixed) sensor nodes can measure the whole train as it passes but only at specific points where the nodes are mounted on the track. This tradeoff needs to be considered when designing the node placements. The following sections analyze existing WSNs for condition monitoring on the railways and conducts analyzes from the perspective of fixed (static) and movable (dynamic) monitoring [122]. In each category, the systems are grouped according to the object(s) being monitored. A. Fixed Monitoring Many authors have investigated health monitoring of infrastructure, including rail bridges, tunnels, rail tracks and track beds, and other track infrastructure. Krüger et al. [70] noted that structural health monitoring is becoming ever more important as both train speeds and the axle loads exerted by trains increase. Until recently, inspection has been performed visually [70], but this only examined the structure superficially and intermittently. Additionally, the visual analysis needs to be interpreted by an expert, which can be subjective. Sensors are objective and can provide data from all of the structure (including internally) to allow the whole structure’s health to be assessed and to analyze its durability and remaining life time. Wired sensors can be used for monitoring. However, wired systems are expensive, inflexible, time consuming to install, and the trains have to be stopped during installation [70]. The early fixed WSNs were simple such as attaching sensor nodes to the rails to monitor the rail temperature or low-voltage warning sensors that monitor the power supply to motors at points [15]. These systems simply generated a binary output (high or low). For the temperature sensor, a rail expert with knowledge of the ambient (stress free) rail temperatures set the alarm levels for “amber” and “red” warnings. If an alarm level was reached, then the system sent an SMS alert. Modern WSNs provide semiautomatic or automatic analysis of the sensor data to examine structural changes and to improve the durability of structures. Hence, WSN monitoring should reduce the overall maintenance costs. An overview of fixed monitoring systems is given in Table II in the Appendix. 1) Bridges: Bridges suffer structural defects exacerbated by the constant strains and vibrations of passing trains. Human inspection of bridges is difficult and much of the structure may be inaccessible. WSNs enable constant monitoring of the whole structure, including the internal structure of the bridge. The monitoring systems often comprise two units, as detailed in Section II-C. The first unit is low power. It detects the approach of a train and wakes the second unit. This second unit generates the measurements, whereas the bridge is under load (a train is crossing) to assess the bridge’s health. For an overall assessment, Krüger et al. [70] used a variety of MEMS to monitor structural changes in concrete including: piezo-based acoustic emission (AE) sensors for crack and fatigue detection, strain gauges to analyze static loads and stresses, accelerometers to analyze dynamic loads as trains pass, and temperature/humidity sensors to determine the ambient conditions. Grosse et al. [53], [54], Hay et al. [58], Hay [59], Ledeczi et al. [73], and Nair and Cai [90] used AE testing
to detect fatigue cracks and other internal structural damage in bridges. The rate and intensity of AE from cracks defines the crack growth rate, which Hay et al. [58] categorized as inactive, active, or critically active. Ledeczi et al. [73] combined AE sensors to detect crack growth with strain gauges to identify changes in the forces exerted by trains both of which indicate structural problems. Bischoff et al. [19] and Feltrin [46] also analyzed force changes using resistance strain gauges to detect structural damage. Similarly, Sala et al. [106] and Sekula and Kolakowski [109] analyzed force changes using piezoelectric strain sensors mounted on the bridge trusses. Kolakowski et al. [67] used ultrasonic strain gauges to record elastic waves in bridge trusses due to vibrations caused by passing trains. Changes in vibrations can indicate structural problems similar to changes in forces. Chebrolu et al. [32] detected these changes in vibration using accelerometers. During monitoring, Kolakowski et al. [67], Sala et al. [107] and Sekula and Kolakowski [111] used an extra module: piezoelectric strain (“weigh in motion”) sensors mounted on the track approaching the bridge, which weigh the train; thus, the train’s weight can be factored into the structural assessment. Kerrouche et al. [65] incorporated optical sensors into the fabric of bridges during bridge repairs to allow structural analysis. They used fiber Bragg grating (FBG) strain sensors with grooves cut in the bridge fabric to house the optical fibers carrying the FBG sensors. The authors concluded that the FBG monitoring needs more thorough evaluation as it was difficult to distinguish the actual strain from the noise. 2) Tunnels: Tunnels can be damp leading to rapid corrosion damage and other defects; thus, monitoring is essential. Monitoring of tunnels has many similarities to bridge monitoring. However, rail tunnels are often difficult to access and inspect. An added complication of tunnel monitoring compared with bridge monitoring is data transmission in a confined environment [88]. Data generated by sensors inside the tunnel have to be transmitted using a suitable relay mechanism (often multiple hop using relay nodes) from the various sensor nodes to the outside. Bennett et al. [17], Cheekiralla [33], Hoult et al. [62], and Stajano et al. [116] described WSNs deployed in the London Underground tunnels. Bennett et al. [17], Hoult et al. [62], and Stajano et al. [116] detected distortion using inclinometers and measured movement using linear potentiometric displacement transducers. They coupled the sensors with four relay nodes in a mesh topology to transmit the sensor data to a receiver unit in the tunnel. There is no GPRS signal near the London Underground tunnels. The authors used repeater units placed along the tunnel to transmit the data from the gateway to a computer located outside the tunnel at the top of a ventilation shaft. This transmission computer logged the data and transmitted them to the offsite compute server using a mobile-phone signal. Bennett et al. also analyzed tunnels in the Prague metro using the same sensor network. Here, a GPRS signal is available at the tunnel mouth; thus, they connected the gateway node to the transmission computer directly using an Ethernet cable with no requirement for repeater units, thus, reducing the chances of data loss. Cheekiralla [33] monitored deformation in the tunnel when construction work was happening nearby using off-the-shelf battery-powered pressure transducers to measure
HODGE et al.: WSNS FOR CONDITION MONITORING IN THE RAILWAY INDUSTRY: A SURVEY
vertical displacements and the transverse deformation along the most vulnerable zone of the tunnel. Cheekiralla coupled each pressure transducer with a microcontroller, RF transmitter, analog-to-digital converter, and power conditioning hardware. The base station was located near the tunnel with a RF receiver unit connected to a laptop. The laptop had a wireless modem to periodically send data to a server. 3) Rail Tracks: Track monitoring systems also play a vital role in maintaining the safety of the railways. Monitoring bridges and tunnels (discussed in the previous paragraphs) uses sensors to identify and analyze defects (cracking and displacement) in large structures. In contrast, track monitoring involves identifying and analyzing defects in long narrow metal rails. Tracks can crack and displace like bridges but also twist and tilt (incline). Hence, track monitoring can vary from detecting settlement and twist such as that caused by nearby tunneling or excavation [112]; to measuring the forces exerted by train wheels on the tracks; to monitoring the development of cracks and structural flaws as trains pass and over the longer term. Durham Geo Slope Indicator Company (DGSIC) [112] and Aboelela et al. [1] analyzed the track movements (shift) over time particularly where nearby construction work may affect the track or where track passes through vulnerable areas such as regions prone to landslides. Aboelela et al. [1] mounted inclinometers parallel with the tracks directly on the sleepers or in the ballast with continuous tensioned rails to monitor tilt. Likewise, DGSIC [112] mounted inclinometers parallel with the tracks to measure settlement. They also mounted inclinometers perpendicular to the track (on the ties) to monitor twist. Aboelela et al. [1] also plan to use inclinometers to monitor ties to detect broken ties or sabotage. Other systems analyzed the effects of trains passing along the tracks using track-mounted strain gauges [10], [71], [94], [99], piezoelectric strain sensors [112], FBG strain sensors [41], [72], [118], [119], [127], AE sensors [7], [22], [121], [128], [135], and accelerometers [10], [18], [71]. Current sensors readings can be compared with historical sensor measurements and unusual readings or readings that match known problem signatures can be detected [7], [22], [41], [72], [118], [121], [127]. Strain gauges monitor the forces exerted by trains (“weigh in motion”), and accelerometers measure vibrations (motion of the track [9]), whereas AE sensors detect and analyze cracks. Tam et al. [119] installed FBG strain sensors on each side of a track to detect imbalances on the two sides of train wheels. If there is a large variation between the left and right axle loading then there is the danger of train derailment. Monitoring the impact of passing trains is important for two reasons: it can detect track damage, but it can also detect damaged trains. Brickle et al. [23] detailed state-of-theart automated systems using track-mounted sensors for wheel condition monitoring. Excessive forces, particularly where the train has a defect such as out-of-round wheels, flat wheels, or unbalanced axle loading, can crack sleepers, damage the rail head, and cause failure of rail by either growth of fractures, or fatigue and fracture of in-track welds [10]. Filograno et al. [47] used FBG sensors for train identification, axle counting, speed and acceleration detection, wheel imperfection monitoring, and dynamic load calculation by placing them in different positions
1095
on the track. Monitoring the forces exerted using strain sensors can identify defective axles and wheels [118] or incorrectly loaded trains [41]. Analyzing the track vibration data produced by accelerometers [16] and the AE signal transferred through the rail [7], [22], [121] from AE sensors can also detect out of round wheels as trains pass. Belotti et al. [16] incorporated an inductive axle-counter block into their system for assessing the train speed. The speed affects the expected vibrations; thus, the speed can be built into the wheel analysis model. Detecting wheel faults can also pinpoint trains that are at risk of causing a derailment. In [10], [71], the risk of derailment is represented by the ratio between the lateral and the vertical force (L/V ratio), which quantifies the relationship between the applied load and the deflection of the track [10]. Condition monitoring protects both the trains and the track, increases the track and train reliability and allows repair to be scheduled. If the track has been marked as defective and awaiting repair but is still usable, AE sensors can be attached to monitor the defects and ensure that they are not getting worse [135]. Track awaiting repair usually has a speed restriction enforced so, if it is monitored, this may not be required. 4) Rail Track Beds: As well as monitoring the track, it is important to analyze the rail bed [8]. The pore-pressure of water in the subsoil of rail beds increases as trains pass. Repeated pressuring can reduce the shear strength of the soil and increase the potential for bed failure. Wong et al. [132] used vibrating wire piezometers to measure this pore pressure. Vibrating wire piezometers are accurate and reliable. However, they have a limited reading frequency due to the vibrating wire. Wong et al. [132] generated data at a rate of 0.1 Hz and Hendry [60] notes that this low rate of data acquisition may miss the peak pore pressures under axle loads which occur at frequencies of >1 Hz. Konrad et al. [68] measured pore pressure using piezometers and wire potentiometers which generate data at >100 Hz. This higher frequency allows the analysis of pore pressure during the passage of individual trains. Other systems use a variety of sensors for monitoring. Aw [8] analyzed a railway site experiencing mud pumping problems that requires frequent (bimonthly) track maintenance. Aw used accelerometers to monitor the track vibrations, settlement probes to monitor track settlement, piezometers to measure ground water pressure, and temperature sensors. Hendry [60] used piezometers to measure the pore pressure and detect changes; extensometers to measure the relative vertical motion at various depths; and, an arm comprising jointed segments with accelerometers attached. The movement of the segments and overall shape of this arm is used to analyze the horizontal deformation of the foundation material during the passage of a train. Baum et al. [14] developed a WSN early warning system for rail landslides. It combined data from rain gauges to determine the rainfall level and likely saturation, tensiometers to measure the pore pressure and reflectometers to measure the soil water content. Tensiometers are able to detect changes in pore pressure rapidly to warn of slope instability, whereas reflectometers detect water content changes over time to warn of wet soil slippages. 5) Other Track Infrastructure: A variety of infrastructure is used to operate the tracks. Monitoring the condition of this infrastructure is an important part of railway condition
1096
IEEE TRANSACTIONS ON INTELLIGENT TRANSPORTATION SYSTEMS, VOL. 16, NO. 3, JUNE 2015
monitoring. Fishplates are metal plates attached to the end of track sections to join and align them [51]. Fishplates can be tampered with, incorrectly maintained or the nuts and bolts may work loose. This may cause track sections to become misaligned potentially resulting in a derailment. Buggy et al. [27] and Ghosh et al. [51] proposed WSNs to monitor fishplates using FBG stain sensors [27] and piezo-resistive pressure sensors [51], respectively. If the nuts and bolts of a fishplate are loosened, then the strain and pressure on them change. The WSN can send an alert to the nearest control room. The railways use track circuits which detect approaching trains and ensure correct train and signal operation [36], [49], [133]. Track circuits transmit a signal to a receiver via the two running rails of a track section [36]. If the signal reaches a receiver at the far end of the track section, then no trains are present. If a train is present on the section, then the signal is short circuited by the wheels, the signal does not reach the receiver and the track relay is not energized. Fukuta [49] noted that this receiver can be a wireless MEMS. Detecting current flows along the track can also pinpoint broken rails or disconnected wires. Railway points switch (move) the track between two alternative routes to ensure the train takes the correct route [63], [83], [86], [136]. The points work in conjunction with track circuits to detect and route trains. Hence, both the track circuits and the points must be fully functioning to accurately detect and route trains to ensure safe and reliable operation. Points monitoring systems often use a variety of sensors as they require multifaceted monitoring. Zhou et al. [136] monitored: distance, motor driving force, driving current and voltage, electrical noise, temperature and state changes, whereas Marquez et al. [83] measured a similar set of variables: voltage, current drawn by the electric motor, current drawn by the system as a whole, and the force in the drive bar measured with a load pin. Igarashi and Siomi [63] used magnetic lock-warp sensors to detect maladjusted switches and points irregularities by measuring displacement through temperature variations. B. Movable Monitoring WSNs are able to monitor the condition of a range of mechanics, systems, and environments using on-board sensors to measure parameters such as temperature, shocks, tilts, and humidity [138]. Thus, WSNs demonstrate a promising platform for real-time movable condition monitoring of transport systems, allowing the early detection and diagnosis of problems. Bruni et al. [24], Ngigi et al. [95] and Ward et al. [126] provided overviews of the opportunities available for on-board vehicle monitoring systems, which analyzed the mechanics. Measurements can all be taken during normal train service that allows in-service condition monitoring of the train chassis and mechanics and the rail track that the train is running on. The sensor nodes used for movable monitoring are often mounted on the train bogies or carriages. These locations are susceptible to high levels of vibration; thus, the sensor nodes have to be rugged or protected. Authors use strong adhesives to bond the nodes to the object being monitored and sealed protective cases to shield the sensor nodes. For example, Grudén et al. [55] used sensors to monitor train bogies. They used shock absorbing
material around circuit boards to protect them, separated the battery from the circuit board, mounted the antenna separately from the circuit board, and used flexible cables. One of the key issues with movable sensor monitoring is communication, due to the mobility of the sensors. Movable rail monitoring can transmit the data from the movable nodes to a static node when the static node is in range. Transferring data from the movable nodes to a static node often happens when a train stops in a station. Alternatively, the movable nodes can form a network with a base station within the network. If the nodes form a network on the train, then the base station is often mounted on the locomotive, where power is available to power the data transmission. This transmits the data over a suitable mechanism, such as satellite or GSM. Despite the issues with movable monitoring, mobile sensor nodes can achieve a higher degree of coverage and connectivity compared with static sensor nodes. As they move to a range of locations. Object mobility (such as the movement of sensors) can be classified into uncontrolled and controlled mobility [13]. With uncontrolled mobility, a sensor node can move randomly and freely. In contrast, a node only moves along a predetermined route with controlled mobility. Vehicles on the railways can only move in limited trajectories, each train follows a planned route along tracks, which are set by points and signals and the movements are dictated by the rail timetable. Establishing WSNs for controlled mobility is easier compared with WSNs for uncontrolled mobility. If the routes are known and fixed, then the nodes and receivers can be arranged for maximum efficiency as wireless sensor nodes have limited transmission ranges. However, Chen et al. [34] noted that even with controlled mobility, trains can be over a mile long. If these trains are fitted with sensor nodes, then the off-train receivers have to be carefully designed and positioned to cope. An overview of movable monitoring systems is given in Table III in the Appendix. 1) Train Engines, Passenger Carriages, and Freight Wagons: Wagon or container failure could lead to damage of the rail infrastructure or the environment and could even result in loss of life; thus, it is important that the wagons, containers, and their respective contents are also monitored. Additionally, freight trains use unpowered and unwired railroad wagons, thus an on-board WSN can analyze the condition of the freight wagons [104] without power from the train. A number of authors have developed systems for analyzing train carriages, wagons, and engines. This can involve analyzing the mechanics of the vehicles or analyzing the contents where safety-critical material is being transported. Many of these systems form a mobile network in a daisy chain topology between adjacent carriages and with the engine acting as the base station [50], [81], [104], [112], [131]. The sensor data can also classify the rail wagon’s response to the track and even detect potential derailments. Ward et al. [126] noted that on-board sensors can identify track defects including small vertical irregularities (dipped joints or voids), small lateral irregularities (kinks), larger vertical irregularities, larger lateral irregularities (misalignment), and track twist. A number of authors analyzed the mechanics of carriages and engines using parameters such as the temperatures, strains,
HODGE et al.: WSNS FOR CONDITION MONITORING IN THE RAILWAY INDUSTRY: A SURVEY
and forces at critical locations on the rail wagon shell and mechanics. Gao et al. [50], Nejikovsky, and Keller [93] and Tam et al. [119] used WSNs to monitor the dynamics and structural condition of both locomotives and passenger carriages, whereas Shafiullah et al. [112] and Wolfs et al. [131] monitored carriages. In [93], engine sensors analyzed the health of locomotive engines by measuring parameters, including water temperature, oil temperature, engine temperature, switch statuses, fans statuses, throttle positions, rotations per minute, and traction motor currents. Similarly, Tam et al. [117] used FBGs to analyze the strain and temperature of train body shells in critical locations, which include the welding joints, cross beams, and sole bars. Accelerometers can analyze different properties of the wagons depending where they are mounted [50], [93], [131]. Wolfs et al. [131] placed them at the edges of rail carriages; Gao et al. [50] placed them on the floor of the locomotive and the chassis of carriages; and Nejikovsky and Keller [93] mounted them on the body of passenger carriages of tilting trains to monitor rail wagon body motions. These trainmounted accelerometers can measure vertical and horizontal vibrations [50], [131]. They can also monitor the lateral accelerations when travelling around curves to ensure the lateral forces do not exceed government safety levels [93]. Gyroscopes [131] can measure the longitudinal accelerations, as well as pitch, roll, and yaw of carriages to analyze motion. Casola et al. [31], Flammini et al. [48] and Maly et al. [82] proposed to integrate data from a range of heterogeneous sensors for more holistic condition monitoring. Maly et al. [82] performed hot box detection, flat wheel detection, dynamic scaling, and loading gauge detection using commercially available sensors, whereas Casola et al. [31] analyzed temperature, humidity, and vibrations among others (the specific sensor types are not stated). The sensors are grouped into units, which operate independently. If a unit detects a faulty train, then it alerts the control center and provides detailed information about the detected irregularity. Wagons containing freight are susceptible to tampering and intrusion. Authors have combined accelerometer data with light, shock, humidity, and temperature readings to provide security monitoring [81], [104], [112]. Mahlknecht and Masani [81] used vibration shock sensors; Mahlknecht and Masani [81] and Shafiullah et al. [112] monitored the humidity to detect changes; Mahlknecht and Masani [81] and Reason et al. [104] used light sensors to detect wagons that are open, and Mahlknecht and Masani [81] used motion detectors for analyzing movement and detecting irregularities. 2) Train Bogies: The train bogies perform a number of tasks, mainly to guide the train on both straight and curved tracks, to safeguard the train’s dynamic stability, and to provide a comfortable ride for the passengers [126]. Most commercial condition monitoring systems for rail vehicles analyze the bogie system. Ngigi et al. [95] noted that this is because the bogie’s important components undergo rapid changes during journeys and can pose safety related issues. Train axles and bogies run hot during train journeys. However, excess heat is generated as the axles and bogies wear. It is imperative to detect this excess heat to allow early detection of wear and deterioration, schedule maintenance and thus prevent vehicle failures and
1097
derailments. Hot axle bearing detectors (HABDs) have been in use for a number of years [98]. The early HABDs could detect defects but were only capable of generating an alarm once a certain threshold was reached [98]. In contrast, new systems generate a significant amount of data, both as alarms and as time-series graphs of the bearing temperatures. Different heat types have different time-series signatures [98]. Hence, it is possible to identify faults such as hot wheels caused by brake drag or extraneous heat sources such as leaking engine exhaust fumes. Previously, when only a simple threshold was used, alarms caused by these other sources of heat may have been misinterpreted as false positives, due to the lack of detailed information [98]. Rabatel et al. [102], [103] and Carrascal et al. [30] used MEMS temperature sensors; Kim et al. [66] used surface acoustic wave (SAW) sensors mounted on the train’s bogies to detect overheated wheel bearings and Grudén et al. [55] used temperature sensors to analyze wheel performance. Grudén et al. [55] used three sensors to measure bogie temperatures and a fourth sensor to measure the air temperature to establish the ambient conditions. The ambient conditions affect the train mechanics, thus the need to be incorporated into the condition monitoring to prevent false positives and false negatives. Bogies can also be analyzed for vibrations. Elia et al. [44], Mei and Li [87] and Tsunashima et al. [124] proposed systems for the measurement of bogie vibrations. Elia et al. and Tsunashima et al. mounted accelerometers on the bogies and Elia et al. also placed them on axle boxes of train carriages to measure the lateral acceleration. Mei and Li used robust inertia sensors mounted onto the bogie frame to monitor vibrations and ground speed. The papers also demonstrated that rail/wheel conicity caused by incorrect track gauge or inclination [44] and track irregularities [87], [124] can be identified from the respective bogie-based sensors. Tsunashima et al. [124] were able to analyze the sensor data onboard the train at source to provide real-time track analysis. 3) Train Axles: As well as generating excess heat, excess strains (such as torsional and bending stress) may be exerted on axles causing deterioration. The degree of torsional stress is affected by the train’s traction control system, mechanical brake characteristics, the wheel–rail interface and the track adhesion conditions. This number of factors affecting the stress means that establishing a baseline to create a model necessitates measuring the torsional axle stress levels over a long term, ideally over the four seasons of a year [42]. Similarly, the axle bending stress levels vary due to the track quality, vehicle loading, braking and traction effects and curving speeds. Deuce and Rosinski [42] also observed strong electromagnetic interference (EMI) when measuring strains on powered axles. This required the development of bespoke instruments, including strain gauge amplifiers, telemetry systems, solid state data loggers, and signal processing units equipped with wireless data communication [42]. 4) Train Wheels: A number of the systems already discussed for track and train vehicle monitoring are able to detect wheel irregularities. Train wheels wear over time and can also suffer flat wheels and out-of-round wheels. The previous section (Section IV-A fixed monitoring) discussed how WSNs
1098
IEEE TRANSACTIONS ON INTELLIGENT TRANSPORTATION SYSTEMS, VOL. 16, NO. 3, JUNE 2015
attached to the track detected faulty wheels by analyzing vibrations and stresses exerted by the wheels on the tracks. Wheel problems can also be detected by sensors on board the train analyzing the wheel surfaces or analyzing forces on the train bogies and wheels. The wheel-sets and bogie each have two degrees of freedom (lateral and yaw) [75]. Wired sensors could be used for analysis but require holes in the train axle for the power leads, which weaken the axle, whereas wireless sensors are not very durable in the harsh conditions [84]; thus, this lack of durability has to be considered. Nuffer and Bein [96] introduced a wear detection system for train wheels. It detected changes in the vibration behavior of the entire wheel caused by surface changes on the rolling contact area. The system positioned piezoelectric sensors on distinct areas of the wheel. The sensors represented the surface as an electrical signal. Changes in the surface can then be detected by changes in the electrical signal. However, it proved difficult to adequately define the correlation between the behavior of the wheel and the measured signals; thus, the system was sensitive to small changes in model parameters. Li et al. [75] noted that the behavior models for rail monitoring are very complex with strong interdependencies between the measured variables and between different degrees of freedom. Thus, a number of variables need to be measured. They mounted sensor nodes on the bogie frame to monitor the dynamic behavior of wheel profile (conicity) and dampers. Two accelerometers mounted on the front and rear wheel set measure the lateral accelerations of the wheel set. An accelerometer and a gyromounted on the bogie measured the lateral acceleration and yaw velocity of the bogie. Finally, a vehicle body accelerometer measured the lateral acceleration of the vehicle body. It is also important to monitor the wheel/rail contact to detect skidding and wear. Matsumoto et al. [84] applied a multifaceted approach. They fitted noncontact gap sensors on nonrotating parts of a bogie to measure the bending deflection (distortion) of the wheel by the lateral contact force. They also used magnetostrictive displacement sensors to measure the deflection of the primary suspension by the vertical contact force. These two measurement combined give the wheel/rail contact forces. Matsumoto et al. [84] used the same derailment coefficient as [10] and [71] (discussed in the fixed monitoring section): the ratio between the lateral and the vertical force (L/V ratio). Balas and Jain [9] fused data from speed sensors and piezoelectric accelerometers attached to train wheels. Using data modeling, they were able to detect skidding if the integral of the acceleration (speed of the wheel) measured by the accelerometer differed from the speed of the carriage. They also calculated the wheel adherence as a function of the carriage weight, carriage velocity, brake cylinder pressure, and the skid amount from the skid model. 5) Train Brakes: Heavy haul transportation involves carrying heavyweight railway freight. The trains have multiple locomotives, which must coordinate their braking. Song et al. [115] developed a WSN for brake coordination and monitoring to reduce the maintenance and inspection requirements. They attached air pressure sensors to the locomotives and train rear, installed relay nodes on the carriage roofs, and placed accelerometers and ultrasonic sensors along the track along with
railway relay nodes. When the front locomotive brakes, the sensors in it detect the change of air pressure, and the relay node on the locomotive transmits a message to the other locomotives via the relay nodes on either the train or the track using a wireless radio link. The other locomotives can then apply their brakes according to the message from the lead locomotive. The track relay nodes are used where transmission via train carriages is weak such as bends and tunnels. The data regarding the railway infrastructure from the accelerometers and ultrasonic sensors along the track can be collected and analyzed for condition monitoring. 6) Train Pantographs: In electrified railways, the overhead power lines and the pantographs on the trains require monitoring. The pantograph ensures that the train contacts the overhead power line to collect current and power the train. Ensuring the integrity of the pantograph, the pantograph/overhead line interface and the overhead power lines is important to ensure the power supply to the train, prevent breakdowns and identify sections of power line requiring maintenance. Thus, monitoring the force exerted between the contact and the wire is essential to detect and prevent problems. Boffi et al. [21], Bruno et al. [25], Elia et al. [44], Waki [125], and Willsch et al. [129] all performed condition monitoring of the pantograph itself. Elia et al. also monitored the overhead power lines for irregularities and loss of tension. Optical sensors are immune to EMI making them ideal to use near power lines where EMI is high. Thus, Boffi et al. and Willsch et al. measured the strain exerted between the pantograph’s current collector and the overhead wire using interferometric fiber [21] and FBG [129] sensors. Elia et al. and Waki used a variety of sensors to analyze different aspects of the pantograph. Both used accelerometers that can detect impact accelerations that occur when passing a contact failure and both integrated sensors in the current collector. Elia et al. used load cells to measure the reaction forces and displacement transducers to measure the motion of the current collector and articulated frame. Waki along with Bruno et al. attached ultraviolet (UV) sensors to the current collector to detect arcing. Arcing occurs when the contact between the pantograph and the overhead wire is lost and causes power transmission loss and overheating. To detect overheating further, Waki measured the pantograph’s temperature using a standard temperature sensor. Waki used a video camera to record overhead line conditions and pantograph movement. Leung et al. [74] used passive magnetoelectric current sensors to analyze the current in the transmission cable running from the pantograph to the train’s power unit. Changes in the current flow can indicate power transmission loss and need to be detected. V. C ONCLUSION This paper has reviewed the range of WSNs used for condition monitoring in the railway industry. The emphasis is on the practical engineering solutions, principally which sensors devices are used and what they are used for; and, identification of sensor node configurations and network topologies. Until recently, railway inspection has been visually performed [70], but this only examines objects superficially and
HODGE et al.: WSNS FOR CONDITION MONITORING IN THE RAILWAY INDUSTRY: A SURVEY
intermittently, and the analysis needs to be interpreted by an expert, who can be subjective. Sensors are objective and can provide data from the entire object (including internally) to allow the whole object’s health to be fully assessed and to analyze its durability and remaining life time. A broad range of sensors are used in railway monitoring to provide an extensive range of data and allow monitoring of different structures, vehicles and machinery. The main challenge for WSNs in railway applications is determining the best measurement technologies to use. The WSN must be reliable and accurate to enable effective condition monitoring in harsh and inaccessible environments but must also be cost effective. It must be possible to translate the sensor data from the WSN into relevant and clear information to enable decision support in the railway infrastructure maintenance lifecycle. The paper divides railway condition monitoring into fixed monitoring for immobile infrastructures such as bridges, tunnels, tracks and associated equipment, and movable monitoring for vehicles and their mechanics. Fixed monitoring uses sensors to monitor vibrations, stresses and sound waves passed through structures (acoustics) caused by passing trains (shortterm monitoring) and also changes in stresses, pressures and sound waves passed through structures over the longer term (long-term monitoring). One of the key issues for fixed monitoring is network topology. The topology is constrained by the requirements of the monitoring and by the physical environment. Sensor nodes can be arranged in either an ad hoc or a preplanned configuration [134]. Determining the optimum node placement is a complex task and often requires a tradeoff. The network configuration can be optimized against a number of different constraints. A network may minimize relay nodes, may need to ensure a minimum level of service (include a certain level of redundancy), minimize energy usage to preserve battery life, or may need to ensure accessibility of the nodes [116]. The communication mechanisms, for example, Bluetooth, Wi-Fi, GSM, or satellite also need to be evaluated to ensure coverage and reliability and the routing protocol to ensure data is successfully transmitted from sensor node to base station to control center. Another issue is powering the sensors as fixed monitoring often requires placing sensor nodes in inaccessible locations, for example, in tunnels, on bridge trusses, or in rail track beds. Many sensors use batteries but replacing batteries in inaccessible locations may not be possible. Authors have considered ambient energy harvesting such as converting vibrations caused by passing trains into energy or using solar power. These energy harvesters may be accompanied with energy storage such as capacitors. Authors have also reduced sensor energy usage using event detection where a single cheap sensor detects approaching trains and wakes a larger sensor network to commence taking measurements of a bridge structure. Movable monitoring uses sensors to monitor temperatures, vibrations, stresses, forces, currents, and sound waves in vehicles and their mechanics particularly bogies and chassis. These locations are susceptible to high levels of vibration and EMI; thus, the sensors have to be rugged or protected. One of the key issues with movable sensor monitoring is communication due to the mobility of the sensors. Movable rail monitoring either
1099
transmits the data from the movable nodes to a static node when the static node is in range, or the movable nodes form a network with a base station within the network which transmits the data over a suitable mechanism, such as satellite or GSM. This paper focuses on the sensor technology used to generate condition monitoring data to enable practical condition monitoring systems. These data must be managed and turned into useful information to generate useful information. Condition monitoring systems must store large quantities of data to build models for analysis. The data must be validated first to ensure that they are correct and error-free (sensor faults, noise, null values, communication errors, etc.). This process may even be performed in the sensor node’s microcontroller; thus, only valid data are transmitted thus minimizing the transmission load. These data can then be processed in a number of different ways to generate information. Once data are collated, they can be analyzed using robust algorithms to identify faults in near realtime. Algorithms need to be robust as WSN data is noisy, can be intermittent, may contain errors, has many interdependencies and the data volume is very high. The WSN data can also be stored and analyzed over longer time periods to identify longterm progressive faults such as a slowly developing crack. Some systems incorporate contextual data that describe the ambient conditions, which will affect the object monitored. These contextual data can be built into models to improve the coverage and accuracy of the model and to help provide explanation of condition monitoring decisions. Elia et al. [44] included: train speed, position along the line (longitude and latitude from GPS system) and wind speed and direction when analyzing bogie vibrations, whereas Rabatel et al. [102], [103] included structural criteria (route) and environmental criteria (weather, travel characteristics, travel duration) when analyzing bogie temperatures. VI. F UTURE R ESEARCH There are a number of promising directions for further research in condition monitoring in the railways. One future direction is a move toward holistic integrated systems [31], [48], [82] which provide near real-time information and alerts. These approaches will integrate data from different sensor systems using sophisticated modeling techniques. They will also incorporate more contextual data into the modeling, including the ambient conditions, the route, the journey time, the weight of the train, and more. The models will use multistage data fusion. This fuses measurements from a variety of sources (sensors and contextual data) and over a range of time epochs to generate a consolidated state history of the object being monitored [38]. The models will also mitigate data dependencies (physical dependencies) across the physical objects being monitored. An integrated multifaceted approach should improve prediction quality. For example, train monitoring data can be combined with route data and GPS data. If multiple trains detect a vibration fault at exactly the same GPS location, then the fault is more than likely in the rail infrastructure such as uneven track. However, if only one train identifies a vibration anomaly at a particular GPS location, then the fault is more likely to be in the rolling stock [64].
1100
IEEE TRANSACTIONS ON INTELLIGENT TRANSPORTATION SYSTEMS, VOL. 16, NO. 3, JUNE 2015
TABLE I TABLE D ETAILING THE S ENSOR D EVICES U SED IN R AILWAY C ONDITION M ONITORING W ITH WSN S
As sensors become cheaper and easier to fabricate, then their availability and use will increase. Bukova and Svecova [28] proposed a WSN comprising many tiny wireless MEMS
(smart dust), which are able to collect, process, and transmit data from light to vibrations. Vast numbers of these sensors can be placed inside a wagon, for example, where they can
HODGE et al.: WSNS FOR CONDITION MONITORING IN THE RAILWAY INDUSTRY: A SURVEY
1101
TABLE II TABLE L ISTING THE F IXED O BJECTS M ONITORED , THE M EASUREMENTS U SED FOR E ACH O BJECT, THE S ENSOR D EVICES U SED TO M ONITOR IT AND A L IST OF C ITATIONS TO S YSTEMS M ONITORING T HAT O BJECT
measure temperature, humidity, or vibrations. Bukova and Svecova posited that recent developments in sensor fabrication techniques will produce MEMS that are the size of a grain of sand yet contain computing circuits, bidirectional wireless communications technology and a power supply. The number of sensors will increase in the future, and the number and distribution of monitored objects will expand. This will require further development of energy efficient routing and transmission mechanisms to ensure reliable and consistent communication. Condition monitoring will also tend to parallel and distributed processing across multiple nodes to speed execution. This could be processing the data in parallel at the same geographical location using a single machine with multiple processing cores or at the same geographical location using multiple compute nodes or even distributed processing, where the data are processed at multiple geographical locations, and the results are assimilated at a central location. As WSNs expand and become more pervasive, security against intrusion, eavesdropping, data tampering and unauthorized control will be ever more important [116]. WSNs pose unique problems for security. WSNs broadcast data between nodes making them vulnerable. The sensors are energy constrained with limited processing capability; thus, any security software needs to be carefully designed. Network administrators will have to identify which WSNs need to be secured, how
they need to be secure, and what level of security is required [117]. The type of security is important. Does the WSN need to be secured for access? How often and to what level should the WSN be monitored for intrusion detection? Does the data need protecting from data tampering? The level of security will be dictated by the value of the asset, the type of asset and the consequences of a failure. WSNs will become more interlinked; thus, it is imperative that WSN security cannot be compromised through access from other networks. In the future, ever more data will be collected from railway infrastructure and vehicles. This inevitably leads to a requirement for the railway industry to develop standards for data collection [126] and processing. West et al. [110] proposed developing Web Ontology Language standardized ontologies to encapsulate railway data and ensure consistency for transmission and processing. Different systems and different companies can then share data using a consistent interface. As more and varied condition monitoring systems are developed, then there is a further requirement of standardization of presentation of decisions and information across these systems for consistency and to allow integration of multiple systems. Equally, many condition monitoring algorithms are “black boxes” providing little or no explanation of decisions [110]. In the staircase of structural health monitoring of Lopez-Higuera et al. [78], a Level 4 system can estimate
1102
IEEE TRANSACTIONS ON INTELLIGENT TRANSPORTATION SYSTEMS, VOL. 16, NO. 3, JUNE 2015
TABLE III TABLE L ISTING THE M OVABLE O BJECTS M ONITORED , THE M EASUREMENTS U SED , THE S ENSOR D EVICES U SED AND A L IST OF C ITATIONS TO S YSTEMS M ONITORING T HAT O BJECT
the consequences of the damage and remaining service life. However, only a Level 5 system will allow the diagnosis and/or the prognosis and recommendation of a solution to the problem. Future systems will need to provide clearer and more detailed explanation of their recommendations to increase usability. In the future, condition monitoring will be able to exploit cheaper, more robust and more pervasive hardware. New data processing techniques will generate more accurate, robust, and reliable models from existing and new sensor data. Data and processing will be standardized. Systems will be secure and provide clear and detailed decisions and recommendations. A PPENDIX See Tables I–III. ACKNOWLEDGMENT The authors would like to thank the reviewers for their helpful suggestions, which improved the quality of this review.
R EFERENCES [1] E. Aboelela, W. Edberg, C. Papakonstantinou, and V. Vokkarane, “Wireless sensor network based model for secure railway operations,” in Proc. 25th IEEE Int. Perform., Comput. Commun. Conf., Phoenix, AZ, USA, 2006, pp. 1–6. [2] M. Aguado et al., “WiMax on rails: A broadband communication architecture for CBTC systems,” IEEE Veh. Technol. Mag., vol. 3, no. 3, pp. 47–56, Sep. 2008. [3] B. Ai et al., “Challenges toward wireless communications for high-speed railway,” IEEE Trans Intell. Transp. Syst., vol. 15, no. 5, pp. 2143–2158, Oct. 2014. [4] K. Akkaya and M. Younis, “A survey on routing protocols for wireless sensor networks,” Ad Hoc Netw., vol. 3, no. 3, pp. 325–349, Dec. 2005. [5] I. Akyildiz, W. Su, Y. Sankarasubramaniam, and E. Cayirci, “Wireless sensor networks: A survey,” Comput. Netw., vol. 38, no. 4, pp. 393–422, Mar. 2002. [6] I. Akyildiz, W. Su, Y. Sankarasubramaniam, and E. Cayirci, “A survey on sensor networks,” IEEE Commun. Mag., vol. 40, no. 8, pp. 102–114, Aug. 2002. [7] A. Anastasopoulos, K. Bollas, D. Papasalouros, and D. Kourousis, “Acoustic emission on-line inspection of rail wheels,” in Proc. 29th Eur. Conf. Acoust. Emission Testing, Wien, Austria, 2010, pp. 1–8. [8] E. Aw, “Low cost monitoring system to diagnose problematic rail bed: case study of mud pumping site,” Ph.D. dissertation, Massachusetts Inst. Technol., Cambridge, MA, USA, 2007.
HODGE et al.: WSNS FOR CONDITION MONITORING IN THE RAILWAY INDUSTRY: A SURVEY
[9] V. Balas and L. Jain, “World knowledge for sensors and estimators by models and internal models,” J. Intell. Fuzzy Syst., vol. 21, no. 1, pp. 79– 88, Apr. 2010. [10] D. Barke and W. Chiu, “Structural health monitoring in the railway industry: A review,” Struct. Health Monitoring, vol. 4, no. 1, pp. 81–93, Mar. 2005. [11] P. Baronti et al., “Wireless sensor networks: A survey on the state of the art and the 802.15. 4 and ZigBee standards,” Comput. Commun., vol. 30, no. 7, pp. 1655–1695, May 2007. [12] G. Barrenetxea, F. Ingelrest, G. Schaefer, and M. Vetterli, “The hitchhiker’s guide to successful wireless sensor network deployments,” in Proc. 6th ACM Conf. Embedded Netw. Sens. Syst., Raleigh, NC, USA, 2008, pp. 43–56. [13] S. Basagni, A. Carosi, and C. Petrioli, “Controlled vs. uncontrolled mobility in wireless sensor networks: Some performance insights,” in Proc. IEEE 66th Veh. Technol. Conf., Baltimore, MD, USA, 2007, pp. 269–273. [14] R. Baum et al., “Early warning of landslides for rail traffic between Seattle and Everett,” in Proc. Landslide Risk Manage., Washington, USA, 2005, pp. 731–740. [15] C. Bell, “Event monitoring comes of age: ‘predict and prevent’ as well as ‘find and fix’,” in Proc. IET Int. Conf. Railway Condition Monitor., Birmingham, U.K., 2006, pp. 44–47. [16] V. Belotti, F. Crenna, R. Michelini, and G. Rossi, “Wheel-flat diagnostic tool via wavelet transform,” Mech. Syst. Signal Process., vol. 20, no. 8, pp. 1953–1966, Nov. 2006. [17] P. Bennett et al., “Wireless sensor networks for underground railway applications: Case studies in Prague and London,” Smart Struct. Syst., vol. 6, no. 5/6, pp. 619–639, 2010. [18] E. Berlin and K. van Laerhoven, “Sensor networks for railway monitoring: Detecting trains from their distributed vibration footprints,” in IEEE Int. Conf. Distrib. Comput. Sens. Syst., Cambridge, MA, USA, 2013, pp. 80–87. [19] R. Bischoff, J. Meyer, O. Enochsson, G. Feltrin, and L. Elfgren, “Eventbased strain monitoring on a railway bridge with a wireless sensor network,” in Proc. 4th Int. Conf. Struct. Health Monitor. Intell. Infrastructure, Zurich, Switzerland, 2009, pp. 1–8. [20] M. Bocciolone, G. Bucca, A. Cigada, A. Collina, and L. Comolli, “An application of FBG accelerometers for monitoring pantographs of underground trains,” in Proc. SPIE 4th Eur. Workshop Opt. Fibre Sens., Porto, Portugal, 2010, pp. 765341-1–765341-4. [21] P. Boffi et al., “Optical fiber sensors to measure collector performance in the pantograph-catenary interaction,” IEEE Sens. J., vol. 9, no. 6, pp. 635–640, Jun. 2009. [22] K. Bollas, P. Dimitrios, K. Dimitrios, and A. Athanasios, “Acoustic emission inspection of rail wheels,” J. Acoust. Emission, vol. 28, pp. 215–228, Jan. 2010. [23] B. Brickle et al., “Identification of Existing and New Technologies for Wheelset Condition Monitoring,” TTCI Ltd., London, U.K., RSSB Rep. Task T607, 2008. [24] S. Bruni, R. Goodall, T. Mei, and H. Tsunashima, “Control and monitoring for railway vehicle dynamics,” Veh. Syst. Dyn., vol. 45, no. 7/8, pp. 743–779, 2007. [25] O. Bruno, A. Landi, M. Papi, and L. Sani, “Phototube sensor for monitoring the quality of current collection on overhead electrified railways,” Proc. Inst. Mech. Eng. Part F: J. Rail Rapid Transit, vol. 215, no. 3, pp. 231–241, Sep. 2001. [26] K. Bruzelius, “An initial investigation on the potential applicability of Acoustic Emission to rail track fault detection,” NDT E Int., vol. 37, no. 7, pp. 507–516, Oct. 2004. [27] S. Buggy et al., “Intelligent infrastructure for rail and tramways using optical fibre sensors,” IET Railway Young Professionals’ Best Paper Competition, 2011. [28] B. Bukova and Z. Švecovà, “Smart dust in transport services,” Railway Transp. Logist., vol. 3, no. 2, pp. 39–43, 2007. [29] A. Cardenas et al., “Attacks against process control systems: Risk assessment, detection, response,” in Proc. 6th ACM Symp. Inf., Comput. Commun. Security, Hong Kong, 2011, pp. 355–366. [30] A. Carrascal, A. Diez, and A. Azpeitia, “Unsupervised methods for anomalies detection through intelligent monitoring systems,” in Proc. 4th Int. Conf. Hybrid Artif. Intell. Syst., Salamanca, Spain, 2009, pp. 137–144. [31] V. Casola et al., “Freight train monitoring: A case-study for the pSHIELD project,” in Proc. 6th Int. Conf. Innov. Mobile Internet Serv. Ubiquitous Comput., Palermo, Italy, 2012, pp. 597–602. [32] K. Chebrolu, B. Raman, N. Mishra, P. Valiveti, and R. Kumar, “Brimon: A sensor network system for railway bridge monitoring,” in Proc. 6th Int. Conf. Mobile Syst., Appl. Serv., Breckenridge, CO, USA, 2008, pp. 2–14.
1103
[33] S. Cheekiralla, “Wireless sensor network-based tunnel monitoring,” in Proc. 1st Workshop Real-World WSN Poster Session, 2005. [34] H. Chen et al., “Towards scalable deployment of sensors and actuators for industrial applications,” in IEEE Int. Conf. Sens. Netw., Ubiquitous Trustworthy Comput., Taichung, Taiwan, 2008, pp. 285–290. [35] J. Chen et al., “RAISE: RAIlway infrastructure health monitoring using wireless sensor networks,” Sens. Syst. Softw., vol. 122, pp. 143–157, 2013. [36] J. Chen and C. Roberts, “Effective condition monitoring of line side assets,” in IET Int. Conf. Railway Condition Monitoring, Birmingham, U.K., 2006, pp. 78–83. [37] C.-Y. Chong and S. Kumar, “Sensor networks: Evolution, opportunities, challenges,” Proc. IEEE, vol. 91, no. 8, pp. 1247–1256, Aug. 2003. [38] S. Coraluppi and C. Carthel, “Multi-stage data fusion and the MSTWG TNO datasets,” in Proc. 12th Int. Conf. Inf. Fusion, Seattle, WA, USA, 2009, pp. 1552–1559. [39] R. da Costa Marques Pimentel et al., “Hybrid fiber-optic/electrical measurement system for characterization of railway traffic and its effects on a short span bridge,” IEEE Sens. J., vol. 8, no. 7, pp. 1243–1249, Jul. 2008. [40] N. Dadashi. et al., “A framework of data processing for decision making in railway intelligent infrastructure,” in Proc. IEEE 1st Int. MultiDisciplinary Conf. Cognitive Methods Situation Awareness Decision Support, Miami Beach, FL, USA, 2011, pp. 276–283. [41] G. den Buurman and A. Zoeteman, “Quo Vadis: Review of the contribution of a weigh-in-motion system to optimising railway performance,” in Proc. 7th World Congr. Railway Res., Montréal, QC, Canada, 2006, pp. 1–10, [CD-ROM]. [42] R. Deuce and J. Rosinski, “Ultra miniature data loggers for testing and in-service monitoring of railway axles and other rail vehicle components,” in Proc. IET Int. Conf. Railway Condition Monitor., Birmingham, U.K., 2006, pp. 57–60. [43] K. Dierkx, “The Smarter Railroad. Transport R&D for Innovation Project Report,” IBM Global Business Services, Armonk, NY, USA, 2009. [44] M. Elia et al., “Condition monitoring of the railway line and overhead equipment through onboard train measurement-an Italian experience,” in Proc. IET Int. Conf. Railway Condition Monitor., Birmingham, U.K., 2006, pp. 102–107. [45] D. Estrin et al., “Connecting the physical world with pervasive networks,” IEEE Pervasive Comput., vol. 1, no. 1, pp. 59–69, Mar. 2002. [46] G. Feltrin, “Wireless sensor networks: A monitoring tool for improving remaining lifetime estimation,” in Civil Struct. Health Monitoring Workshop, Berlin, Germany, 2012, pp. 1–8. [47] M. Filograno et al., “Real-time monitoring of railway traffic using fiber Bragg grating sensors,” IEEE Sens. J., vol. 12, no. 1, pp. 85–92, Jan. 2012. [48] F. Flammini et al., “Towards wireless sensor networks for railway infrastructure monitoring,” in Proc. Electr. Syst. Aircraft, Railway Ship Propulsion, Bologna, Italy, 2010, pp. 1–6. [49] Y. Fukuta, “Possibility of sensor network applying for railway signal system,” in Proc. 5th Int. Conf. Netw. Sens. Syst., Kanazawa, Japan, 2008, pp. 170–172. [50] C. Gao et al., “Design of train ride quality testing system based on wireless sensor network,” in Proc. Int. Conf. Electron. Mech. Eng. Inf. Technol., Harbin, China, 2011, pp. 2636–2639. [51] K. Ghosh et al., “Development of fishplate tampering detection system for railway security based on wireless sensor network,” Int. J. Comput. Appl., vol. 2, pp. 29–34, 2011. [52] R. Goodall and C. Roberts, “Concepts and techniques for railway condition monitoring,” in IET Int. Conf. Railway Condition Monitoring, Birmingham, UK, 2006, pp. 90–95. [53] C. Grosse et al., “Wireless acoustic emission sensor networks for structural health monitoring in civil engineering,” in Proc. Eur. Conf. NonDestructive Testing, Berlin, Germany, 2006, pp. 1–8. [54] C. Grosse, S. Glaser, and M. Kruger, “Initial development of wireless acoustic emission sensor Motes for civil infrastructure state monitoring,” Smart Struct. Syst., vol. 6, no. 3, pp. 197–209, 2010. [55] M. Grudén, A. Westman, J. Platbardis, P. Hallbjorner, and A. Rydberg, “Reliability experiments for wireless sensor networks in train environment,” in Proc. Eur. Wireless Technol. Conf., 2009, pp. 37–40. [56] D. Hall and J. Llinas, “An introduction to multisensor data fusion,” Proc. IEEE, vol. 85, no. 1, pp. 6–23, Jan. 1997. [57] J. Han and M. Kamber, “Data mining: Concepts and techniques,” in Morgan Kaufmann Series in Data Management Systems. Amsterdam, The Netherlands: Elsevier, 2006.
1104
IEEE TRANSACTIONS ON INTELLIGENT TRANSPORTATION SYSTEMS, VOL. 16, NO. 3, JUNE 2015
[58] T. Hay et al., “Transforming bridge monitoring from time-based to predictive maintenance using acoustic emission MEMS sensors and artificial intelligence,” in Proc. 7th World Congr. Railway Res., Montreal, Canada, 2006, CD-ROM. [59] T. Hay, “Wireless Remote Structural Integrity Monitoring for Railway Bridges,” Transportation Research Board, Washington, DC, DC, USA, Tech. Rep. no. HSR-IDEA Project 54, 2007. [60] M. Hendry, “The geomechanical behaviour of peat foundations below rail-track structures,” Ph.D. dissertation, Univ. of Saskatchewan, Saskatoon, SK, Canada, 2012. [61] V. Hodge, Outlier and Anomaly Detection: A Survey of Outlier and Anomaly Detection Methods. Saarbrucken, Germany: Academic, 2011. [62] N. Hoult et al., “Wireless sensor networks: Creating ‘smart infrastructure’,” Proc. ICE-Civil Eng., vol. 162, no. 3, pp. 136–143, Aug. 2009. [63] Y. Igarashi and S. Siomi, “Development of monitoring system for electric switch machine,” Quarterly Rep. Railway Tech. Res. Inst., vol. 47, no. 2, pp. 78–82, 2006, (Japan). [64] K. Ishida, H. Kitabayashi, M. Nagasu, and K. Bekki, “New train control and information services utilizing broadband networks,” Hitachi Rev., vol. 53, no. 1, pp. 21–24, 2004. [65] A. Kerrouche et al., “Field tests of fibre Bragg grating sensors incorporated into CFRP for railway bridge strengthening condition monitoring,” Sens. Actuators A, Phys., vol. 148, no. 1, pp. 68–74, Nov. 2008. [66] J. Kim, K. S Lee, and J. Oh, “A study on the wireless onboard monitoring system for railroad vehicle axle bearings using the SAW sensor,” Sens. Syst. Softw., vol. 57, pp. 52–58, 2011. [67] P. Kolakowski et al., “Structural health monitoring of a railway truss bridge using vibration-based and ultrasonic methods,” Smart Mater. Struct., vol. 20, no. 3, p. 035016, Mar. 2011. [68] J. Konrad, S. Grenier, and P. Garnier, “Influence of repeated heavy axle loading on peat bearing capacity,” in Proc. 60th Can. Geotech. Conf., Ottawa, ON, Canada, 2007, pp. 1551–1558. [69] M. Kroener, “Energy harvesting technologies: Energy sources, generators and management for wireless autonomous applications,” in Proc. 9th Int. Multi-Conf. Syst., Signals Devices, Chemnitz, Germany, 2012, pp. 1–4. [70] M. Krüger et al., Sustainable Bridges. Technical Report on Wireless Sensor Networks using MEMS for Acoustic Emission Analysis including other Monitoring Tasks. Stuttgart, Germany: European Union, 2007. [71] R. Lagnebäck, “Evaluation of wayside condition monitoring technologies for condition-based maintenance of railway vehicles,” M.S. thesis, Luleâ Univ. of Technol., Luleâ, Sweden, 2007. [72] C. Lai et al., “Development of a fiber-optic sensing system for train vibration and train weight measurements in Hong Kong,” J. Sensors, 2012, Art. ID. 365165. [73] A. Ledeczi et al., “Wireless acoustic emission sensor network for structural monitoring,” IEEE Sens. J., vol. 9, no. 11, pp. 1370–1377, Nov. 2009. [74] C. Leung, S. Y. Zhang, S. W. Or, S. L. Ho, and K. Y. Lee, “Magnetoelectric smart current sensors for wireless condition monitoring of train traction systems,” in Proc. 1st Int. Workshop High-Speed Intercity Railways, Shenzhen, China, 2012, pp. 319–327. [75] P. Li et al., “Estimation of railway vehicle suspension parameters for condition monitoring,” Control Eng. Practice, vol. 15, no. 1, pp. 43–55, Jan. 2007. [76] R. Liu, Y. Wu, I. Wassell, and K. Soga, “Frequency diversity measurements at 2.4 GHz for wireless sensor networks deployed in tunnels,” in Proc. IEEE 20th Int. Symp. Pers., Indoor Mobile Radio Commun., 2009, pp. 2990–2994. [77] R. Liu, I. Wassell, and K. Soga, “Relay node placement for wireless sensor networks deployed in tunnels,” in Proc. IEEE 6th Int. Conf. Wireless Mobile Comput., Netw. Commun. , 2010, pp. 144–150. [78] J. Lopez-Higuera, L. Rodriguez Cobo, A. Quintela Incera, and A. Cobo, “Fiber optic sensors in structural health monitoring,” J. Lightw. Technol., vol. 29, no. 4, pp. 587–608, Feb. 2011. [79] A. Lorestani, S. A. Mousavi, and R. Ebadaty, “Monitoring rail traffic using Wireless Sensor Network (WSN),” Int. J. Comput. Sci. Eng. Technol., vol. 2, no. 6, pp. 1280–1282, Jun. 2012. [80] J. Lynch and K. Loh, “A summary review of wireless sensors and sensor networks for structural health monitoring,” Shock Vibration Dig., vol. 38, no. 2, pp. 91–130, Mar. 2006. [81] S. Mahlknecht and S. Madani, “On architecture of low power wireless sensor networks for container tracking and monitoring applications,” in Proc. 5th IEEE Int. Conf. Ind. Inf., Vienna, Austria, 2007, pp. 353–358. [82] T. Maly, M. Rumpler, H. Schweinzer, and A. Schoebel, “New development of an overall train inspection system for increased operational
[83] [84] [85] [86] [87] [88] [89] [90] [91]
[92]
[93] [94]
[95] [96] [97] [98] [99] [100] [101] [102] [103] [104] [105] [106]
safety,” in Proc. IEEE Intell. Transp. Syst., Vienna, Austria, 2005, pp. 188–193. F. Marquez, P. Weston, and C. Roberts, “Failure analysis and diagnostics for railway trackside equipment,” Eng. Failure Anal., vol. 14, no. 8, pp. 1411–1426, Dec. 2007. A. Matsumoto et al., “Continuous observation of wheel/rail contact forces in curved track and theoretical considerations,” Veh. Syst. Dyn., vol. 50, pp. 349–364, 2012. S. McConnell and D. Skillicorn, “A distributed approach for prediction in sensor networks,” in Proc. 1st Int. Workshop Data Mining Sens. Netw.a, Newport Beach, CA, USA, 2005, pp. 28–37. M. McHutchon, W. J. Staszewski, and F. Schmid, “Signal processing for remote condition monitoring of railway points,” Strain, vol. 41, no. 2, pp. 71–85, May 2005. T. Mei and H. Li, “Measurement of vehicle ground speed using bogiebased inertial sensors,” Proc. Inst. Mech. Eng. Part F, J. Rail Rapid Transit, vol. 222, no. 2, pp. 107–116, Jun. 2008. L. Mottola et al., “Not all wireless sensor networks are created equal: A comparative study on tunnels,” ACM Trans. Sens. Netw., vol. 7, no. 2, Aug. 2010, Art. ID. 15. C. Nagode, M. Ahmadian, and S. Taheri, “Motion-based energy harvesting devices for railroad applications,” in Proc. Am. Soc. Mech. Eng. Joint Rail Conf., Urbana, IL, USA, 2010, pp. 267–271. A. Nair and C. Cai, “Acoustic emission monitoring of bridges: Review and case studies,” Eng. Struct., vol. 32, no. 6, pp. 1704–1714, Jun. 2010. W. Nan, M. Qingfeng, Z. Bin, L. Tong, and M. Qinghai, “Research on linear wireless sensor networks used for online monitoring of rolling bearing in freight train,” J. Phys., Conf. Ser., vol. 305, no. 1, p. 012024, Jan. 2011. C. Nelson, S. Platt, D. Albrecht, V. Kamarajugadda, and M. Fateh, “Power harvesting for railroad track health monitoring using piezoelectric and inductive devices,” in Proc. SPIE Active Passive Smart Struct. Integrated Syst., San Diego, CA, USA, 2008, vol. 6928, no. 1, pp. 1–9. B. Nejikovsky and E. Keller, “Wireless communications based system to monitor performance of rail vehicles,” in Proc. IEEE/ASME Joint Railroad Conf., Newark, NJ, USA, 2000, pp. 111–124. N. Nenov, E. N. Dirmitrov, G. S. Mihov, T. G. Ruzhekov, and P. M. Piskulev, “A study on sensors for measuring load of railway vehicle wheels in motion,” in Proc. 31st Int. Spring Seminar Electron. Technol., Budapest, Hungary, 2008, pp. 550–555. Art. ID. 012016R. Ngigi et al., “Modern techniques for condition monitoring of railway vehicle dynamics,” J. Phys., Conf. Ser., vol. 364, no. 1, Jan. 2012. J. Nuffer and T. Bein, “Application of piezoelectric materials in transportation industry,” in Proc. Global Symp. Innovative Solutions Advancement Transp. Ind., San Sebastian, Spain, 2006, pp. 1–11. C. O’Donnell et al., “Pantograph damage and wear monitoring system,” in Proc. IET Int. Conf. Railway Condition Monitoring, Birmingham, U.K., 2006, pp. 178–181. B. Ollier, “Intelligent infrastructure—The business challenge: Railway Condition Monitoring,” in Proc. IET Int. Conf. Railway Condition Monitoring, Birmingham, U.K., 2006, pp. 1–6. M. Palo, “Condition monitoring of railway vehicles: a study on wheel condition for heavy haul rolling stock,” M.S. thesis, Luleâ Univ. Technology, Luleâ, Sweden, 2012. A. Pascale, N. Varanese, G. Maier, and U. Spagnolini, “A wireless sensor network architecture for railway signalling,” in Proc. 9th Italian Netw. Workshop, Courmayeur, Italy, 2012, pp. 1–4. A. Pourghodrat, “Energy harvesting systems design for railroad safety,” M.S thesis, Mechanical (and Materials) Engineering, Univ. NebraskaLincoln, Lincoln, NE, USA, 2011. J. Rabatel, S. Bringay, and P. Poncelet, “SO_MAD: SensOr mining for anomaly detection in railway data,” Adv. Data Mining Appl. Theor. Aspects, LNCS, vol. 5633, pp. 191–205, 2009. J. Rabatel, S. Bringay, and P. Poncelet, “Anomaly detection in monitoring sensor data for preventive maintenance,” Exp. Syst. Appl., vol. 38, no. 6, pp. 7003–7015, Jun. 2011. J. Reason, H. Chen, R. Crepaldi, and S. Duri, “Intelligent Telemetry for Freight Trains,” in Mobile Computing, Applications, Services, vol. 35. Berlin, Germany: Springer-Verlag, 2010, pp. 72–91. J. Reason and R. Crepaldi, “Ambient intelligence for freight railroads,” IBM J. Res. Develop., vol. 53, no. 3, pp. 1–14, May 2009. M. Reyer, S. Hurlebaus, J. Mander, and O. E. Ozbulut, “Design of a wireless sensor network for structural health monitoring of bridges,” in Proc. 5th Int. Conf. Sens. Technol., Palmerston North, New Zealand, 2011, pp. 515–520.
HODGE et al.: WSNS FOR CONDITION MONITORING IN THE RAILWAY INDUSTRY: A SURVEY
[107] D. Sala, J. Motylewski, and P. Koaakowsk, “Wireless transmission system for a railway bridge subject to structural health monitoring,” Diagnostyka, vol. 50, no. 2, pp. 69–72, 2009. [108] I. Salaberria, R. Carballedo, U. Gutierre, and A. Perallos, “Wireless communications architecture for ‘train-to-earth’ communication in the railway industry,” in Proc. 10th Int. Work-Conf. Artif. Neural Netw., Salamanca, Spain, 2009, pp. 626–633. [109] G. Scholl et al., “SAW-based radio sensor systems for short-range applications,” IEEE Microw., vol. 4, no. 4, pp. 68–76, Dec. 2003. [110] J. Schwarzenbach, L. Wilkinson, L. West, and M. Pilling, “Mapping the remote condition monitoring architecture—Core report,” RSSB, London, U.K., 2010. [111] K. Sekula and P. Kolakowski, “Piezo-based weigh-in-motion system for the railway transport,” Struct. Control Health Monitoring, vol. 19, no. 2, pp. 199–215, Mar. 2012. [112] G. Shafiullah, A. Gyasi-Agyei, and P. Wolfs, “Survey of wireless communications applications in the railway industry,” in Proc. 2nd Int. Conf. Wireless Broadband Ultra Wideband Commun., Sydney, NSW, Australia, 2007, p. 65. [113] G. Shafiullah, A. B. M. S. Ali, A. Thompson, and P. J. Wolfs, “Predicting vertical acceleration of railway wagons using regression algorithms,” IEEE Trans. Intell. Transp. Syst., vol. 11, no. 2, pp. 290–299, Jun. 2010. [114] G. Shafiullah, S. A. Azad, and A. B. M. S. Ali, “Energy-efficient wireless MAC protocols for railway monitoring applications,” IEEE Trans. Intell. Transp. Syst., vol. 14, no. 2, pp. 649–659, Jun. 2013. [115] J. Song, J. Zhong, and X. Li, “WHHT: A wireless sensor network for heavy haul transportation,” in Proc. 6th Int. Conf. Wireless Commun. Netw. Mobile Comput., Chengdu, China, 2010, pp. 1–4. [116] F. Stajano et al., “Smart bridges, smart tunnels: Transforming wireless sensor networks from research prototypes into robust engineering infrastructure,” Ad Hoc Netw., vol. 8, no. 8, pp. 872–888, Nov. 2010. [117] G. Stoneburner, A. Goguen, and A. Feringa, “Risk management guide for information technology systems,” NIST Special Publication, Gaithersburg, MD, USA, 2002, vol. 800, no. 30. [118] TagMaster, “Gotcha—wheel flat detection and axle load measurement system,” TagMaster North America Inc., Tacoma, WA, USA, Technical Report, 2005. [119] H. Tam et al., “Utilization of fiber optic Bragg Grating sensing systems for health monitoring in railway applications,” Struct. Health Monitoring, Quantification, Validation, Implementation, vol. 1–2, pp. 1824– 1831, 2007. [120] H. Tan, P. W. Q. Lee, W. K. G. Seah, and A. Zhi, “Impact of power control in Wireless Sensor Networks Powered By Ambient Energy Harvesting (WSN-HEAP) for railroad health monitoring,” in Proc. Int. Conf. Adv. Inf. Netw. Appl. Workshops, Bradford, U.K., 2009, pp. 804–809. [121] N. Thakkar, J. A. Steel, and R. L. Reuben, “Rail-wheel interaction monitoring using Acoustic Emission: A laboratory study of normal rolling signals with natural rail defects,” Mech. Syst. Signal Process., vol. 24, no. 1, pp. 256–266, Jan. 2010. [122] S. Tilak et al., “A taxonomy of wireless micro-sensor network models,” ACM SIGMOBILE Mobile Comput. Commun. Rev., vol. 6, no. 2, pp. 28– 36, Apr. 2002. [123] C. Townsend and S. Arms, “Wireless Sensor Networks. Principles and Applications,” in Sensor Technology Handbook, J. Wilson, Ed. Oxford, U.K.: Elsevier, 2005, ch. 22. [124] H. Tsunashima, T. Kojima, Y. Marumo, H. Matsumoto, and T. Mizuma, “Condition monitoring of railway track using in-service vehicle,” in Proc. 4th IET Int. Conf. Railway Condition Monitoring, 2008, pp. 1–6. [125] H. Waki, “Monitoring of contact line equipment by trains in operation,” JR East Tech. Rev., East Japan Railway Culture Found., vol. 17, pp. 11– 14, 2010. [126] C. Ward et al., “Condition monitoring opportunities using vehicle-based sensors,” Proc. Inst. Mech. Eng. Part F, J. of Rail Rapid Transit, vol. 225, no. 2, pp. 202–218, 2011. [127] C. Wei et al., “Real-time train wheel condition monitoring by fiber Bragg grating sensors,” Int. J. Distrib. Sens. Netw., vol. 2012, pp. 1–7, 2012, Art. ID. 409048. [128] A. Wilkinson, “Long range inspection and condition monitoring of rails using guided waves,” presented at the Proc. 12th Int. Conf. Exhib., Railway Eng., London, U.K., 2013. [129] R. Willsch, W. Ecke, and G. Schwotzer, “Spectrally encoded optical fibre sensor systems and their application in process control, environmental and structural monitoring,” in Proc. SPIE Opt. Fibers, Appl., 2005, vol. 5952, doi:10.1117/12.619430.
1105
[130] M. Wischke, M. Masur, M. Kroner, and P. Woias, “Vibration harvesting in traffic tunnels to power wireless sensor nodes,” Smart Mater. Struct., vol. 20, no. 8, p. 085014, Aug. 2011. [131] P. Wolfs, S. Bleakley, S. T. Senini, and P. Thomas, “An autonomous, low cost, distributed method for observing vehicle track interactions,” in Proc. IEEE/ASME Joint Rail Conf., Atlanta, GA, USA, 2006, pp. 279–286. [132] R. Wong, R. Thomson, and E. Choi, “In situ pore pressure responses of native peat and soil under train load: A case study,” J. Geotech. Geoenviromental Eng., vol. 132, no. 10, pp. 1360–1369, Oct. 2006. [133] H. Yazdi., “Intelligent condition monitoring of railway signalling equipment using simulation,” in Proc. Inst. Elect. Eng.—Seminar Condition Monitoring Rail Transport Syst. (Ref. No. 1998/501), 1998, pp. 13-1–13-5. [134] J. Yick, B. Mukherjee, and D. Ghosal, “Wireless sensor network survey,” Comput. Netw., vol. 52, no. 12, pp. 2292–2330, Aug. 2008. [135] P. Yilmazer et al., “The structural health condition monitoring of rail steel using acoustic emission techniques,” in Proc. 51st Annu. Conf. NDT, Daventry, U.K., 2012, pp. 1–12. [136] F. Zhou, M. D. Duta, M. P. Henry, S. Baker, and C. Burton, “Remote condition monitoring for railway point machine,” in Proc. ASME/IEEE Joint Railroad Conf., Washingtonm, DC, DC, USA, 2002, pp. 103–108. [137] H. Zimmermann, “OSI reference model-the ISO model of architecture for open systems interconnection,” IEEE Trans Commun., vol. 28, no. 4, pp. 425–432, Apr. 1980. [138] S. Zöller et al., “Efficient real-time monitoring of multimodal transports with wireless sensor networks,” presented at the Proc. 36th IEEE Conf. Local Comput. Netw., Bonn, Germany, 2011.
Victoria J. Hodge received the B.Sc. (Hons) and Ph.D. degrees in computer science from University of York, York, U.K., in 1997 and 2001, respectively. Since 2001 she has been a Research Associate with the Department of Computer Science, University of York. She is currently developing an infrastructure for condition monitoring of railway networks. She is on the editorial board of two journals and has published two books and two book chapters as well as 40 articles and proceedings. Her research interests include outlier detection, condition monitoring, neural networks, pattern recognition, data mining, and information retrieval. Dr. Hodge was a member of the research group that won the Outstanding Engineering Research Team of the Year award at the Times Higher Education Awards 2011.
Simon O’Keefe received the M.A. degree in engineering and management from University of Cambridge, Cambridge, U.K., in 1986; the M.Sc. degree in operational research from Lancaster University, Lancaster, U.K., in 1987; and the M.Sc. degree in information processing and the D.Phil. degree in computer science from University of York, York, U.K., in 1993 and 1997, respectively. He is currently a Lecturer with the Department of Computer Science, University of York. He was previously an Operational Research Analyst with Her Majesty’s Customs and Excise, London, U.K. He is a member of the York Centre for Complex Systems Analysis. His research interests principally include neural networks and pattern recognition, data mining, and novel computation. Dr. O’Keefe is a Fellow of the Higher Education Academy.
1106
IEEE TRANSACTIONS ON INTELLIGENT TRANSPORTATION SYSTEMS, VOL. 16, NO. 3, JUNE 2015
Michael Weeks received the B.Eng. (Hons) degree in computer engineering and the M.Phil. degree in electronics from University of Teesside, Middlesbrough, U.K, in 1997 and 2006, respectively. Since 2000 he has been a Research Associate with the Department of Computer Science, University of York, York, U.K. working on several research projects related to neural networks. He is currently working on two projects; a web-based infrastructure for condition monitoring across sensor networks and an internationally recognized web-based virtual laboratory for neuroscientists. Between 1997 and 2000 he was a Research Assistant with University of Teesside in the area of media server architectures. Mr. Weeks received the Sony Prize for Electronics while studying at University of Teesside. He was also a member of the research group at York that won the Outstanding Engineering Research Team of the Year award at the Times Higher Education Awards 2011.
Anthony Moulds received the B.Sc. (Hons) degree in electronics engineering from University of Kent, Kent, U.K., in 1984 and the M.Sc. degree in information technology from University of York, York, U.K., in 1990. After graduating in 1984, he spent four years as an Electronics Design Engineer with a subsidiary company of Westland Helicopters, U.K., and later was with the Department of Computer Science, University of York, in 1990 as an Experimental Officer. He is currently a Senior Experimental Officer within the Department. He has particular expertise in the design and development of novel research hardware with a focus on high-speed circuit design and fieldprogrammable gate array implementation. Mr. Moulds is a member of the Institution of Engineering and Technology, U.K.