Jun 2, 2003 - immigration policy (and associated policies) for the years to come. Immigration policy may extend beyond the interests of the host country, and ...
Immigration and the Dutch Economy Hans Roodenburg Rob Euwals Harry ter Rele
1
June 2003 CPB Netherlands Bureau for Economic Policy Analysis Van Stolkweg 14 P.O. Box 80510
2508 GM The Hague, the Netherlands Telephone+31 70 338 33 80 Telefax
Internet
+31 70 338 33 50 www.cpb.nl
ISBN 90-5833-129-6
2
Contents
Contents Preface
5
Summary and conclusions
7
Samenvatting en conclusies
11
1
Introduction
15
1.1
Aim
15
1.3
Methodology
17
2
Facts and figures
21
2.1
Trends in immigration
21
1.2
2.2
Scope
15
2.3
Economic position of immigrants
Immigration and integration policies
29
3
Labour market
41
3.1
Introduction
41
3.2
34
Stylized model
42
3.4
Extensions
52
3.6
Conclusions
56
4
Public sector
59
4.1
Introduction
59
Main underlying data
63
3.3 3.5
4.2 4.3
Simulations
Empirical evidence
Methodology
47 54
59
4.4
Results
68
4.6
Comparison with other studies
77
4.5
4.7
Sensitivity analysis Conclusions
73
80
3
Immigration and the Dutch Economy: Contents
5
Physical environment
83
5.1
Introduction
83
5.2 5.3
Land as factor of production
84
Economies of scale
86
Conclusions
87
5.4
Negative external effects
6
Policy implications
89
6.1
General discussion
89
5.5
6.2 6.3
6.4
86
Family migration and asylum
90
European policy
94
Labour migration
Literature
95
Appendices Appendix 1
91
105 Effects on countries of origin
105
Appendix 2A
The stylized model
109
Appendix 3A
The demographic impact
119
Appendix 2B Appendix 3B
4
Elasticities for the Netherlands
Equivalence of both measures of fiscal impact
115
121
Preface
Preface For some time now, immigration policy has been high on the national and international agenda. In addition to the legal, humanitarian and social aspects, the economic impact of immigration is receiving increasing attention. The present study presents facts and figures on immigration and integration in the Netherlands, gives an assessment of the impact of immigration on the labour market, the public sector and the physical environment and explores the policy implications of these findings.
The study was written by Rob Euwals (chapter 3), Harry ter Rele (chapter 4) and Hans
Roodenburg (remaining chapters and coordination). It has greatly benefited from the input of many people. Valuable comments on draft chapters were provided by Joop de Beer (Statistics Netherlands), Holger Bonin (IZA, Bonn), Lans Bovenberg (Tilburg University), Paul O’Brien
(OECD), Piet Emmer (Leiden University), Thomas de Graaf (Free University Amsterdam), Joop Hartog (University of Amsterdam), Carlo van Praag (Social and Cultural Planning Office of the Netherlands) and Kjetil Storesletten (Stockholm University). Experts from the ministries gave feedback at a seminar where preliminary results were discussed. In addition, many CPB
colleagues gave support: Linda van den Boom carried out a survey of the literature, Michiel Geschiere collected the material for appendix 1, Arie van der Giessen assisted with
computational programming, Ate Nieuwenhuis provided the MIMIC simulations and valuable comments on chapter 3 and Janneke Rijn prepared the tables and graphs and handled the layout, while many others made useful comments on earlier versions of the text. Jeanne Bovenberg edited most of the English. Henk Don Director
5
Immigration and the Dutch Economy: Preface
6
Summary and conclusions
Summary and conclusions Aim and scope The countries of Western Europe have experienced considerable immigration flows over the past decades. But only recently has immigration emerged on the political agenda. The topic of
immigration policy gained momentum, when, in accordance with the Amsterdam Treaty (1997), common policies with respect to asylum and immigration in the European Union were put on the agenda.
The economic effects of immigration are at the core of the debate, particularly since the ageing of the population raises the question whether immigrants can help countries to cope with the
economic consequences of ageing. Setting out a policy with respect to immigration requires an understanding of the economic mechanisms set in motion and effects brought about by
immigration. Providing an overview of these mechanisms and effects is the aim of this study. Our approach is basically forward looking. Although we evaluate and take into account the
policies of the past, our paramount aim is to offer information that can be useful in shaping immigration policy (and associated policies) for the years to come.
Immigration policy may extend beyond the interests of the host country, and should be based on
economic as well as non-economic considerations. This study concentrates mainly on the impact of immigration on the Dutch economy. Consequently, the study can make only a partial
contribution to the immigration debate and the shaping of immigration and integration policy in the Netherlands.
Main results labour market We conclude that immigration of labour has the following effects:
•
the gross domestic product will increase, but this increase will accrue largely to the immigrants
•
the overall net gain in income of residents is likely to be small and maybe even negative;
•
the more the skill distribution of immigrants differs from that of residents, the larger the
•
• •
in the form of wages;
the amount of redistribution between residents is substantial; amount of redistribution will be;
residents with skills comparable to those of immigrants will lose;
residents with skills complementary to those of immigrants will win in the long run;
7
Immigration and the Dutch Economy: Summary and Conclusions
•
•
capital owners will win in the short run, but in the long run their gains will disappear;
due to labour market imperfections, part of the income effects for resident workers will be replaced by employment effects (unemployment in stead of a wage decrease). public sector The effects of immigration on public finances are assessed by calculating the net lifetime
•
•
•
•
•
contributions of immigrants and their effects on future budget balances. We conclude that:
The fiscal impact of an immigrant depends very much on his or her age at entry and social and economic characteristics (labour market performance). The outcomes are most favourable for the immigrants who are 25 years of age at entry and perform well on the labour market.
For all entry ages, however, immigrants turn out to be a burden to the public budget if their social and economic characteristics correspond to those of the present average non-Western resident. Accordingly, budget balances are affected negatively.
This average negative contribution of immigrants is not fully the result of a lagging
performance. It is partly also the reflection of the generous system of Dutch collective arrangements.
Immigrants who perform better on the labour market than average Dutch residents alleviate public finances over a wide range of entry ages. Accordingly, an inflow of such immigrants would positively affect the budget balance.
The results indicate that immigration can not offer a major contribution to alleviate public
finances and thus to become a compensating factor for the rising costs for government due to the ageing of the population. physical environment An increasing population density brought about by immigration might affect the economy. After
•
•
a rough assessment, we come to the following conclusions:
accommodating an increasing population and associated economic activity, given a fixed amount of land, may have a negative impact on gross domestic product per head, but not necessarily on
the average income of the resident population;
the further population density increases, the more economies of scale are likely to be
outweighed by negative external effects related to such phenomena as traffic congestion, pollution, and loss of open space, landscape and nature.
8
Summary and conclusions
Policy implications general remarks The authorities in the Netherlands, like other Western-European countries, are facing
continuous pressure from potential immigrants supported by interested parties at home, such
as employers, to “open the door to immigrants”. From a national perspective, the question may
be how to deal with immigration pressure while at least avoiding losses for the host country and, if possible, realizing gains. A necessary condition would be that immigrants do not rely too
heavily on welfare state provisions. It will be clear that any successful policy will be restrictive as regards access to the country or its welfare arrangements. One way to achieve this is selectivity with respect to the economic potential of immigrants. family migration and asylum Family reunion, family formation and asylum, taken together, have been accountable for the majority of Dutch immigration in recent years. Economic criteria do not play a role in the
admission of these immigrants, which is largely based on the rules set out in international
agreements. The economic self-reliance of these immigrants may be improved by introducing stronger incentives - financial and legal - for the immigrants to integrate. It seems also
worthwhile to investigate what we can learn from other countries in the EU, as most of these countries seem to do better, at least judged from the employment rates of immigrants. In
integration policy, attention should also be given to the second generation, where the education system plays a crucial role; there is room for some optimism here. labour migration Large scale immigration of labour is not effective in alleviating the financial burden of ageing, while there are no positive labour market effects to be expected from such immigration.
However, some degree of labour migration may be beneficial for the labour market. This is in particular the case if immigrants have a high economic potential and can fill persisting vacancies.
The present system of labour migration in the Netherlands allows employers who cannot find
suitable staff to fill vacancies within the European Economic Area (EEA), to hire, on a temporary basis, employees from countries outside that area. This system can be characterized as demanddriven. It is sometimes suggested that we can learn from the traditional immigration countries
like Australia, Canada and the United States, that employ more supply-driven systems of labour migration, based on quota or a point system or a combination of both. Though such systems
offer better opportunities for selectivity, they imply risks for the welfare state as they weaken the incentive for employers to search among residents living on benefits. Moreover, unlike in the
9
Immigration and the Dutch Economy: Summary and conclusions
system currently prevailing in the Netherlands, there is no guarantee that admitted immigrants will find and keep a job. Welfare state provisions in the traditional immigration countries are austere as compared to those in the Netherlands. Therefore, it may be rational that these
countries prefer a supply-driven system, while for the Netherlands a demand-driven system seems to be more appropriate. European policy Since the Amsterdam Treaty of 1997, the European Union has been moving in the direction of a
common asylum and immigration policy. As regards labour migration, the position of the Dutch government so far has been that immigration is not a suitable policy response to population
ageing in the Netherlands. This position is supported by the results of the present study. The
European Commission, on the other hand, maintains that immigration is desirable in view of
population ageing. Other countries in the European Union may go along with the views of the Commission. This may particularly be the case for countries that are facing relatively severe ageing in combination with unsustainable pay-as-you-go pension systems.
10
Samenvatting en conclusies
Samenvatting en conclusies Doel en bestek De West-Europese landen worden al vele decennia geconfronteerd met aanzienlijke
immigratiestromen. Maar pas sinds kort staat immigratie hoog op de politieke agenda. De
aandacht voor het onderwerp kreeg een stimulans toen, als uitvloeisel van het Verdrag van Amsterdam (1997), een begin werd gemaakt met een gemeenschappelijk asiel- en immigratiebeleid in de Europese Unie.
De economische effecten van immigratie staan in het centrum van de belangstelling, vooral
omdat de komende vergrijzing de vraag oproept of immigranten zouden kunnen helpen om de economische gevolgen daarvan op te vangen. Beleidsvorming op het terrein van immigratie vereist derhalve kennis van de economische mechanismen die door immigratie in werking
worden gesteld en de economische effecten die erdoor worden teweeg gebracht. Het geven van een overzicht van deze mechanismen en effecten is dan ook het doel van deze studie.
Onze aanpak is niet zozeer gericht op het evalueren van beleid dat in het verleden is gevoerd, maar veeleer op het aandragen van informatie die bruikbaar is voor het immigratie- en
integratiebeleid in de komende jaren. Dat sluit natuurlijk niet uit dat nota wordt genomen van eerder opgedanen ervaringen.
Immigratiebeleid kan verder strekken dan alleen de belangen van het land van bestemming en zal niet alleen op economische, maar ook op niet-economische overwegingen gestoeld zijn.
Omdat deze studie zich in hoofdzaak beperkt tot de effecten van immigratie op de Nederlandse economie, kan zij slechts een partiële bijdrage leveren aan het immigratiedebat en aan het vormgeven van het Nederlandse immigratie- en integratiebeleid.
Belangrijkste resultaten arbeidsmarkt Het toetreden van immigranten tot de arbeidsmarkt heeft de volgende effecten:
•
het bruto binnenlands product zal toenemen, maar deze toename zal grotendeels toevallen aan
•
het gezamenlijk voordeel voor de reeds aanwezige bevolking zal gering zijn en mogelijk zelfs
•
de inkomensherverdeling tussen groepen in de reeds aanwezige bevolking is relatief
de immigranten in de vorm van loon; negatief uitvallen; omvangrijk;
11
Immigration and the Dutch Economy: Samenvatting en conclusies
•
hoe meer de opleidingsverdeling van de immigranten afwijkt van die van de reeds aanwezige
•
ingezetenen met kennis en vaardigheden die vergelijkbaar en dus concurrerend zijn met die van
•
ingezetenen met kennis en vaardigheden die een aanvulling vormen op de kennis en
•
kapitaalbezitters zullen er op de korte termijn op vooruitgaan, maar op lange termijn zal dit
•
als gevolg van imperfecties op de arbeidsmarkt kunnen negatieve effecten voor werkende
bevolking, des te groter zal de inkomensherverdeling zijn; de immigranten zullen er op achteruit gaan;
vaardigheden van de immigranten zullen er op lange termijn op vooruit gaan; voordeel verdwijnen;
ingezetenen ook de vorm aannemen van werkloosheid in plaats van een loondaling. overheidsfinanciën
Het effect van immigratie op de overheidsfinanciën wordt bepaald door berekening van de nettobijdrage van immigranten aan de overheidsfinanciën over hun resterende leven, alsmede hun •
effect op het toekomstige financieringssaldo van de overheid. We concluderen dat:
De invloed van een immigrant op de overheidsfinanciën sterk afhangt van zijn of haar leeftijd bij binnenkomst in Nederland en sociaal-economische karakteristieken (prestatie op de
arbeidsmarkt). De uitkomst is het gunstigst als de immigrant bij binnenkomst aan het begin van •
het werkzame leven staat en het goed doet op de arbeidsmarkt.
Bij alle leeftijden van binnenkomst blijken immigranten echter een belastende factor voor de
overheidsfinanciën te zijn als hun sociaal-economische karakteristieken overeenkomen met het gemiddelde van die van de huidige ingezetenen met een niet-westerse achtergrond. In
overeenstemming hiermee zal het toekomstige financieringssaldo van de overheid dan negatief •
•
•
worden beïnvloed.
Deze gemiddeld negatieve bijdrage van immigranten is niet alleen maar het gevolg van een
achterblijvende arbeidsmarktprestatie. Deels wordt deze veroorzaakt door het genereuze systeem van collectieve regelingen.
Immigranten die het op de arbeidsmarkt beter doen dan de gemiddelde Nederlandse ingezetene zijn over een brede ‘range’ van leeftijden bij binnenkomst een ontlastende factor voor de overheidsfinanciën.
De resultaten geven aan dat immigratie geen belangrijke ontlastende factor voor de
overheidsfinanciën kan zijn en dus geen compensatie kan bieden voor de oplopende kosten die gepaard gaan met de vergrijzing van de bevolking.
12
Samenvatting en conclusies
fysieke omgeving Een toename van de bevolkingsdichtheid door immigratie kan economische gevolgen hebben. •
Op basis van een globale verkenning komen we tot de volgende conclusies:
het accommoderen van een toenemende bevolking en bijbehorende economische activiteit bij
een gegeven hoeveelheid land kan een negatief effect hebben op het bruto binnenlands product per hoofd, maar niet noodzakelijkerwijs op het gemiddelde inkomen van de reeds aanwezige
•
bevolking;
naarmate de bevolkingsdichtheid toeneemt wordt de kans groter dat schaalvoordelen niet
opwegen tegen negatieve externe effecten die samenhangen met verkeerscongestie, belasting van het milieu en verlies van open ruimte en natuur.
Beleidsimplicaties algemene opmerkingen Evenals in andere West-Europese landen wordt de overheid in Nederland geconfronteerd met
een voortdurende druk van potentiële immigranten om te worden toegelaten, ondersteund door binnenlandse belanghebbenden zoals werkgevers. Vanuit nationaal perspectief bezien gaat het
om de vraag, hoe om te gaan met deze immigratiedruk, zodanig dat het land van bestemming er in ieder geval niet op achteruit gaat en zo mogelijk profiteert. Een noodzakelijke voorwaarde om dit te bereiken is dat immigranten niet meer dan gemiddeld zullen zijn aangewezen op de
collectieve voorzieningen. Het moge duidelijk zijn dat een succesvol immigratiebeleid altijd
restrictief zal zijn wat betreft de toegang tot het land, respectievelijk de daar aanwezige collectieve
voorzieningen. Een mogelijkheid om een dergelijk beleid vorm te geven is selectiviteit ten aanzien van het economisch potentieel van de immigranten. gezinsmigratie en asiel
Gezinshereniging, gezinsvorming en asiel namen de afgelopen jaren tezamen het grootste deel van de immigratie naar Nederland voor hun rekening. Economische criteria spelen geen rol bij de toelating van betrokkenen. Hun toelating is in belangrijke mate gebaseerd op internationale verdragen. De economische zelfredzaamheid van deze immigranten zou vergroot kunnen
worden door sterkere prikkels, zowel financieel als met betrekking tot de verblijfsstatus. Verder lijkt het de moeite waard om te bezien wat we kunnen leren van andere landen in de EU. De
meeste van deze landen boeken, afgemeten aan de arbeidsparticipatie van immigranten, betere resultaten. Tenslotte dient in het integratiebeleid de nodige aandacht te worden besteed aan de tweede generatie, waarbij het onderwijssysteem een cruciale rol speelt; er lijkt enige reden tot optimisme op dit punt.
13
Immigration and the Dutch Economy: Samenvatting en conclusies
arbeidsmigratie Immigratie op grote schaal is geen effectief middel om de financiële gevolgen van de vergrijzing te verlichten. Ook voor de arbeidsmarkt vallen geen positieve effecten te verwachten van
grootschalige immigratie. Wel kan beperkte arbeidsmigratie gunstig zijn voor de arbeidsmarkt.
Dit geldt met name als immigranten een hoog economisch potentieel hebben en terechtkomen op moeilijk vervulbare vacatures.
Het huidige systeem van arbeidsmigratie in Nederland staat werkgevers toe om, op tijdelijke basis, personeel te werven buiten de Europese Economische Ruimte (EER) als zij kunnen
aantonen dat daarbinnen geen aanbod beschikbaar is voor het vervullen van de betreffende
vacatures. Een dergelijk stelsel kan worden aangeduid als vraag-gestuurd. Soms wordt geopperd dat wij zouden kunnen leren van traditionele immigratielanden als Australië, Canada en de Verenigde Staten. Daar bestaat een meer aanbod-gestuurd stelsel, gebaseerd op quota, een
puntensysteem of een combinatie van beide. Hoewel een dergelijk stelsel meer mogelijkheden
biedt tot selectiviteit, brengt het risico’s met zich mee voor de overheidsfinanciën, aangezien het de prikkel voor werkgevers verzwakt om te werven onder de ontvangers van een uitkering.
Bovendien is er, anders dan in het huidige Nederlandse stelsel, geen garantie is dat toegelaten arbeidsmigranten een baan zullen vinden en behouden. De collectieve voorzieningen in de
traditionele immigratielanden zijn veel minder genereus dan die in Nederland. Daarom kan een aanbod-gestuurd stelsel voor die landen een rationele keuze zijn, terwijl voor Nederland een vraag-gestuurd stelsel beter op zijn plaats is. Europees beleid Sinds het Verdrag van Amsterdam uit 1997 wordt in de Europese Unie gewerkt aan het tot
stand komen van een gemeenschappelijk immigratie- en asielbeleid. Wat betreft arbeidsmigratie is het standpunt van de Nederlandse regering dat deze geen geschikt middel is om de gevolgen van de vergrijzing in Nederland op te vangen. Deze visie wordt ondersteund door de resultaten
van de onderhavige studie. De Europese Commissie is daarentegen van mening dat immigratie wenselijk is met het oog op de vergrijzing. Andere landen in de Europese Unie zijn mogelijk geneigd om mee te gaan met de Commissie op dit punt. Dit zou in het bijzonder het geval
kunnen zijn voor landen met een relatief sterke vergrijzing in combinatie met een onhoudbaar omslagstelsel voor de pensioenen.
14
Aim
1
Introduction
1.1
Aim The countries of Western Europe have experienced considerable immigration flows over the past decades. But only recently has immigration become high on the political agenda. The topic of immigration policy gained momentum, when, according to the Amsterdam Treaty (1997),
common policies with respect to asylum and immigration in the European Union were initiated. The tide turned recently in Germany, where legislation was initiated, that implied that the
restrictive regime for labour immigrants would become more open. It is hardly surprising that the immigration debate has riveted attention in the Netherlands as well.
The economic effects of immigration are at the core of the debate, particularly since the ageing of the population raises the question whether immigrants can help to cope with its economic
consequences. Setting out a policy with respect to immigration requires an understanding of the economic mechanisms set in motion and effects brought about by immigration. Providing an overview of these mechanisms and effects is the aim of this study.
1.2
Scope Our approach is basically forward looking. Rather than merely evaluating the policies of the past, we aim ultimately to offer information that can be useful in shaping immigration policy for the years to come. Nevertheless, we should take into account past experience with respect to immigration and associated policies.
As indicated by its title, this study focuses on the impact of immigration on the Dutch economy.
Of course, the impact of migration is neither merely economic by nature, nor limited to the host country. Examples of non-economic issues related to immigration are social cohesion in the host country, protection offered to refugees, (re)unification of families and broken social
networks in the countries of origin. International migration to a specific host country also affects the immigrants, the countries of origin and the rest of the world.
Immigration policy may thus extend beyond the interests of the host country (Borjas, 1999a), and should be based on economic as well as non-economic considerations. This study
concentrates mainly on the impact of immigration on the Dutch economy. Consequently, the study can make only a partial contribution to the immigration debate and the shaping of
immigration policy in the Netherlands. Before discussing the economic impact of immigration
15
Immigration and the Dutch Economy: Introduction
on the host country in the next few chapters, we first briefly assess the economic impact immigration may have on the other parties mentioned.
In general, immigrants will benefit, particularly those from non-Western countries. Given the income differentials between those countries and the West, migration brings about a
considerable improvement of their standard of living. GDP per head in the Netherlands is four times higher than in Turkey, seven times higher than in Morocco, while much higher figures
apply to the poorer countries in Asia and Africa. In the long run, immigrants may be inclined to compare their situation with other people in the host country and then may come to a less
favourable perception of their situation. Nevertheless, the fact that migrants are often prepared
to take risks and to undergo sacrifices in migrating to Western countries, supports the idea that they benefit substantially from migration.
As regards the countries of origin, the existing evidence seems to be inconclusive: on the one
hand, these countries may lose from the brain drain; on the other hand, however, they may gain from the experience brought by returning migrants and from the remittances that migrants often send to the relatives they left behind. More details can be found in appendix 1.
Aside from the countries of origin, the rest of the world may also be affected by immigration to a specific country of destination, mainly as a supplier of capital. Due to competition on
international capital markets, these effects are likely to be small, and likely to play only a marginal role in the immigration policy of the host country.
What kind of economic effects are to be expected in the host country? First, immigrants add to the country’s labour supply, which may affect employment opportunities and income of the
resident population. Second, immigrants will affect public finance as taxpayers and as clients of the welfare state. Third, immigration adds to population density, which may induce external effects in such fields as housing, land use, transport and the environment.
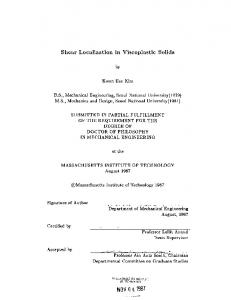
Regarding the economic impact on the host country itself, we distinguish the labour market, the public sector and the physical environment. The diagram in figure 1.1 below summarizes the
discussion in this section. Keywords in capitals refer to the issues that are the focus of this study.
16
Methodology
Figure 1.1 Some considerations in national immigration policy
Host country
Economic
Non-economic
LABOUR MARKET
Social cohesion
PUBLIC SECTOR
PHYSICAL ENVIRONMENT Immigrants
Income
Asylum Family values
Countries of origin
Brain drain
Broken social networks
Brain gain Remittances
1.3
Methodology General approach As a point of departure, and given the discussion in the previous section of this chapter, we focus on the costs and benefits accruing to the resident population in the host country. In
principle, such a survey can be carried out employing a comprehensive model of the economy including (among other elements) the labour market and the public sector, and considering
interactions between these elements. For reasons of transparency and convenience, however, we prefer to study the various aspects separately. This is in line with similar studies elsewhere (see, for instance, Smith and Edmonston, 1997). Facts and figures The discussion on the various economic effects of immigration is preceded by a brief overview of the history of Dutch migration, recent migration trends and policy issues. This provides a background for the rest of the study. Labour market As relevant Dutch studies are scarce, our point of departure is the international literature. This provides an analytical framework and empirical background for further explorations. In our
analysis of the labour market effects of immigration in the Netherlands, we employ a stylized
17
Immigration and the Dutch Economy: Introduction
general equilibrium model, proposed by Borjas (1995,1999b). This model distinguishes high-
skilled and low-skilled labour. Dutch estimates of the relevant coefficients in this model enable
us to obtain estimates of the effects of an immigration impulse with a certain skill composition. As the model assumes that labour markets clear, the results are in terms of income changes for the owners of the production factors involved. The advantage of such a stylized model is its transparency, as it provides a clear insight into the main economic mechanisms at work.
However, other mechanisms, that are not included in the model, in particular with respect to
market imperfections, may also play a role. This point is investigated further, employing a more detailed general equilibrium model for the Dutch economy. Our results are evaluated in light of other - mainly empirical - studies. Public sector Do immigrants pay their way in the welfare state? Immigrants from non-Western countries who
have come to the Netherlands show a higher than proportional use of welfare state programmes. Thus, fiscal impact (as it is called) is not merely an academic issue. There is a risk that
immigration will lead to increasing costs of the welfare state. However, immigration also offers opportunities to reduce welfare state costs. As immigrants are usually young, they can potentially make a net contribution to public finances.
The literature on fiscal impact indicates that net effects on public finance should be calculated in a long-term framework. Childhood, working age and old age each have their specific profiles
with respect to these net effects. Techniques related to generational accounting are employed to carry out the necessary calculations, as demonstrated earlier by Auerbach and Oreopoulos
(2000) and Storesletten (2000). We proceed in two stages. Stage one focusses on the individual immigrant. We calculate the net present value of his contributions to the public sector during
his lifetime. This exercise takes the form of a sensitivity analysis, as we vary our assumptions on the age at entry and the socio-economic performance of the immigrant. This approach enables
us to identify the break-even points with respect to these variables. The second stage moves from the individual to the aggregate level. Assuming an extra influx of immigrants with a certain age
distribution and varying socio-economic characteristics, over a long period of time, we calculate their aggregate impact on public finances. The calculations in both stages are essentially the
same, but the level of aggregation differs. The second stage enables us to draw conclusions with respect to immigration as an instrument to alleviate the financial burden of ageing. Physical environment Effects of immigration relating to increasing population density, are briefly discussed. An
inventory is made of possible effects, but the state-of-the-art does not allow us to make estimates of their size.
18
Methodology
Policy implications Based on the results obtained under the previous headings, we indicate what effects are to be expected of alternative policy options. The final choice is, of course, up to the policymakers.
19
Immigration and the Dutch Economy: Introduction
20
Trends in immigration
2
Facts and figures
2.1
Trends in immigration History in a nutshell The first lines of Dutch history, as recorded by Tacitus, refer to immigration: "The most
conspicuously brave of all the German tribes in Gaul, the Batavi, hold little of the river-bank, but do hold the Rhine island. They were once a section of the Chatti, and on the occasion of a civil
war they migrated to their present home - destined there to become a part of the Roman empire" (Mattingly and Handford, 1976). Through the ages, the Netherlands has experienced numerous waves of immigration and emigration. A brief summary, restricted to modern history, is given
below. More details can be found in references (see, for instance, Lucassen and Penninx, 1994). The Dutch Republic came into being in the late sixteenth century and lasted until the country
came under French domination at the end of the eighteenth century. Its war of independence
gave rise to a wave of migration from the Southern provinces, which remained under Spanish
rule, to Holland and other provinces in the north. Freedom of the Protestant religion and better
economic opportunities were the driving forces. The total number of these immigrants from the South was about 150,000 (Briels, 1978), or ten percent of the total population of the Republic at the beginning of the seventeenth century (De Vries and Van der Woude, 1995). The
concentration of immigrants in cities like Amsterdam, Haarlem and Leiden ranged from one third to far over a half of the population (Briels, 1978). The immigrants from the South were
often highly skilled and wealthy. It seems likely that this wave of immigration boosted economic activity in the Republic, which was to rise to the status of a naval and economic super-power in the first half of the seventeenth century (Briels, 1978, De Vries and Van der Woude, 1995).
Religious or ethnic persecution caused other waves of migration to the Republic. The Jewish immigrant population in the Republic in the late eighteenth century included approximately
3,000 people from Portugese origin and 30,000 others. The Portugese Jews in particular played
a significant role in the economic life in the Republic (de Jong, 1974). The revocation of the edict of Nantes, directed against Protestantism in France in 1685, caused an exodus of ‘Hugenots',
many of whom settled in the Republic. Estimates vary between less than 35,000 to 50,000. The Hugenots, with their skills and wealth, had a substantial impact on Dutch economic life (Israel, 1995). Total immigration between 1600 and 1800 is estimated to have amounted to half a million people (De Vries and Van der Woude, 1995).
While the prosperity and tolerant climate of the Republic attracted migrants, so did the rise of the Dutch overseas empire. In the seventeenth and eighteenth centuries, nearly one million
21
Immigration and the Dutch Economy: Facts and figures
people, including Dutch and foreign nationals in equal parts, boarded ships of the Dutch East
India Company (VOC). Only half of them eventually returned. This means that about a quarter
of a million inhabitants of the Republic left the country for good (De Vries and Van der Woude,
1995). These persons did not usually intend to emigrate, but either perished underway or during their service overseas. This figure suggests that, during the existence of the Republic,
immigration was to a considerable extent offset by - mainly unintentional - emigration. There is little doubt that immigration contributed to economic prosperity in the Republic. Two factors were conducive to this effect. First, many immigrants had high economic potential,
bringing skills and capital to the country. Second, the majority of immigrants had a cultural and religious background familiar to the host country, while language barriers did not play a major role for many immigrants from the Southern provinces.
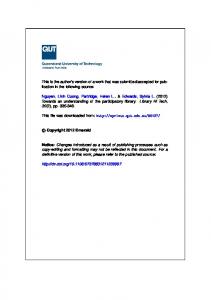
Figures on international migration are available on a regular basis from 1865 onwards. Time
series of migration are shown in figures 2.1 to 2.3. Until the First World War, both immigration and emigration steadily increased, while net migration (the difference between the two)
remained close to zero. Later (around 1960), the patterns show much volatility, explained by the
First World War (refugees) and the Second World War (deportations), while from 1945 onwards, other events can be mentioned. The decolonization of Indonesia boosted immigration: about
350,000 people repatriated, although many of them had never before seen the Netherlands (de Jong, 1988). In addition, 13,000 Moluccan servicemen and their families came to the
Netherlands. In the postwar years, high population growth and gloomy economic perspectives caused some 200,000 Dutch citizens, firmly encouraged by the government, to emigrate to
countries like Australia and Canada (Lakeman, 1999). By the end of the fifties, these postwar
migration flows had come to an end. The numbers mentioned should be seen in relation to a total population of 10 million in 1950.
Since the sixties, net migration has shown an upward trend. In the nineteen sixties, the Dutch economy was booming, and employers looked abroad for employees that could fill their
vacancies. Low-skilled and unskilled workers were recruited from Mediterranean countries, such as Italy, Spain, Yugoslavia, Greece, Turkey and Morocco. The idea was that the presence of these so-called ‘guest workers' would be temporary. After the oil crisis of 1973, the recruitment was terminated. While the foreign population originating from the other countries more or less stabilized, the number of Turks and Moroccans in the Netherlands grew steadily.
22
Trends in immigration
Figure 2.1 Immigration 12
10
8
6
4
2
0 1870 1860
1890 1880
1910 1900
1930 1920
1950 1940
1970 1960
1990 1980
2000
Source: Statistics Netherlands
Figure 2.2 Emigration 10
8
6
4
2
0 1870 1860
1890 1880
1910 1900
1930 1920
1950 1940
1970 1960
1990 1980
2000
Source: Statistics Netherlands
23
Immigration and the Dutch Economy: Facts and figures
Figure 2.3 Immigration minus Emigration 8
6
4
2
0
-2
-4
-6
-8 1870 1860
1890 1880
1910 1900
1930 1920
1950 1940
1970 1960
1990 1980
2000
Source: Statistics Netherlands
The guest workers who preferred to stay received permanent residence permits and were
allowed to let their families join them. In addition, about 10,000 illegal immigrants were granted a legal status in 1975.
As many Turks and Moroccans have chosen their spouses from their country of origin, family
migration among these groups has been going on ever since. In the early seventies, there were
55,000 Turkish and Moroccan guest workers in the Netherlands and about 20,000 family
members, while 25 years later these ethnic groups, including the second generation, accounted for half a million people in total (Roodenburg, 2000).
In 1954, the relations with the colonies in the Western Hemisphere were revised. Inhabitants of Suriname and the Netherlands Antilles became Dutch citizens and thus acquired the right to migrate to the Netherlands. This gave rise to a fairly steady immigration flow from the
Netherlands Antilles (and Aruba, which later became a separate entity). Immigration from
Suriname increased in the years prior its independence in 1975, and returned to lower levels after a more restrictive regime came into being in the early eighties.
Since the eighties, refugees have increasingly contributed to immigration in the Netherlands,
which has received per head of population more asylum seekers than most European countries
24
Trends in immigration
(CPB, 1999). Over 450,000 persons have requested asylum since 1985 (source: The Ministry of
Justice). Not all these applicants were eventually allowed to stay. For the period 1972-1997 it has been estimated that the number of applications granted was about half the number of
applications submitted during that period (CPB, 1999). Asylum seekers in the Netherlands
come from many different countries. Afghanistan, Iran, Iraq, former Yugoslavia and Somalia, among others.
Since the sixties, immigration from the EU and other Western countries has been far from
negligible. However, unlike immigration from non-Western countries like the Netherlands
Antilles, Morocco, Suriname, Turkey and the refugee countries, it has always been more or less counterbalanced by emigration. Net immigration was thus mainly brought about by immigration from non-Western countries.
As mentioned before, in the early seventies, the authorities switched to a more restrictive policy with respect to labour migration. Legislation was introduced that implied a de facto freeze of
labour migration, for as long as unemployment remained high. Since labour shortages occurred in the late nineteen nineties, the same legislation allowed labour migration once again (see
section 2.3). In 2001 the number of labour immigrants from non-EU countries was 7 000,
including employees from highly developed countries like the United States and Japan. This
figure corresponds to 7.5 percent of total immigration with the exception of Dutch nationals. What has been the economic impact of immigration since the nineteen sixties? Initially, the
guest workers had a positive impact on the income of natives. According to Kooyman and Van der Pas (1972), the benefits accrued entirely to non-wage income, as immigration reduced the relative scarcity of labour. They showed that these positive results depended strongly on the
assumption that the guest workers would not be followed by their families. As indicated above, this assumption would prove to be unrealistic. Moreover, by the end of the nineteen seventies the economy fell into a deep recession and many foreign workers lost their jobs and became
dependent on benefits. As a result, the economic impact turned negative (Lakeman, 1999). As will be shown in section 2.2, recent economic indicators on the immigrant population from
non-Western countries, including family members of the former guest workers and immigrants from refugee countries, show that these groups lag well behind, on average. Recent immigration In recent years (1997-2001), average immigration amounted to about 125,000 people yearly,
with a total population of 16 million. Most immigrants, including the repatriated Dutch, were born in Western countries. Slightly less than 60,000 were born in non-Western countries.
Immigration is unrestricted only for Dutch nationals (including people from the Netherlands
25
Immigration and the Dutch Economy: Facts and figures
Antilles and Aruba) and de facto unrestricted for nationals of EU countries. All others need
permission from the authorities to immigrate. Based upon the country of birth, the latter group is estimated to have numbered about 70,000 persons (yearly average, see table 2.1). Table 2.1
Immigration by country of birth, yearly average 1997-2001 Net immigrationa
Immigration x1000
%
x1000
%
The Netherlands
24.1
19.5
S 13.1
S 30.3
EU14
20.9
16.9
6.2
14.4
Netherlands Antilles/Aruba
7.9
6.4
5.3
12.2
Suriname
3.7
3.0
2.1
4.8
Morocco
5.0
4.0
3.6
8.3
Turkey
5.6
4.5
3.8
8.7
20.0
16.2
10.5
24.2
Rest Western countries Rest non-Western countries Total
36.3
29.4
24.9
57.7
123.5
100.0
43.2
100.0
Total Western countries
65.0
3.6
Total non-Western countriesb
58.5
39.6
Total free entryc
52.9
S 1.6
Total restricted entry
70.6
44.8
a b c
Net immigration is defined as immigration minus emigration Turkey, all countries in Africa, Latin America and Asia (excluding Japan and Indonesia) the Netherlands, Netherlands Antilles/Aruba, EU14
Source: Statistics Netherlands
Immigration exceeded emigration by almost 45,000 persons; this is the ‘net immigration’.
While immigration and emigration of people born in Western countries were more or less in balance; this was not the case for those born in non-Western countries. This category was
accountable for approximately 90% of net immigration. Although immigration clearly exceeded emigration for people born in non-Western countries, the number of emigrants belonging to this group is substantial: about one third of the number of immigrants (as can be concluded
from the figures in table 2.1). From age-specific data on emigration rates, it can be estimated that about fifty percent of all immigrants from non-Western countries who enter the Netherlands at the age of 25 will have left the country before the age of 65.
What are the motives for migration to the Netherlands? Figure 2.4 gives a breakdown of
immigration by grounds for admission as they appear in the official documents. These data
cover all nationalities, but in figure 2.4 we exclude immigrants with Dutch passports. Family
reunification and formation, taken together, are the largest category. The rest concerns asylum,
26
Trends in immigration
work, education and other motives. The figure for family formation reflects the preference for a partner from the country of origin in certain ethnic groups. Over 90 percent of the Turks and Moroccans in the Netherlands choose a partner from the same ethnic group, and 75 percent even choose a partner directly from their country of origin (Tweede Kamer, 2002). Figure 2.4 Immigration by grounds of admission, 1997-2001a
asylum 26.3% labour 19.5%
other 5.7% family reunification 21.3% study 7.8%
family formation 19.5% a
With the exception of holders of a Dutch Passport
Source: Statistics Netherlands
In Dutch population statistics the concept of ‘allochtoon’ (plural ‘allochtonen’) plays a key role. It
can be translated as ‘people with a foreign background’. For reasons of convenience, we use the word ‘immigrant'. However, it should be noted here that the definition includes both first and
second generations. By definition (CBS, 2000a), a person qualifies as an allochtoon (immigrant)
if he or she has at least one parent born in a foreign country. If the person in question was born
in a foreign country as well, he or she belongs to the first generation. If not, he or she belongs to the second generation. In Dutch population statistics, the children of the second generation (the third generation) are not considered to be immigrants. Another distinction made in Dutch
population statistics is between immigrants from ‘Western countries' and immigrants from
‘non-Western countries'. ‘Western countries' include Europe (with the exception of Turkey),
North America, Oceania (including Australia and New Zealand), Japan and Indonesia. Japan is
included on socio-economic grounds, and Indonesia is considered as ‘Western', because due to
27
Immigration and the Dutch Economy: Facts and figures
the colonial past, many people in the Netherlands that were born in Indonesia are of Dutch descent.
The total number of immigrants in 2002 was 3.0 million - 18 percent of the population. Roughly speaking, this total population is equally distributed over Western and non-Western as well as the first and second generations. However, among non-Western immigrants the majority
belongs to the first generation, while the reverse is true with respect to Western immigrants (see table 2.2). Table 2.2
Immigrant populationa in 2002 and forecast for 2050 2002
2050
million persons % of total population
million persons
% of total population
Non-Western countries first generation
1.0
6.0
1.6
9.1
second generation
0.6
3.6
1.9
10.6
total
1.6
9.7
3.5
19.6
Western countries first generation
0.6
3.6
1.1
6.0
second generation
0.8
5.2
1.2
6.6
total
1.4
8.7
2.2
12.6
3.0
18.4
5.7
32.2
16.1
100.0
17.6
100.0
All immigrants Total population of the Netherlands a
On 1 January
Source: Statistics Netherlands
Population statistics include only those immigrants who are officially registered as residents. The population of illegal immigrants was recently estimated by Statistics Netherlands (CBS, 2002a) to lie between 47,000 and 116,000 persons. Future immigration Statistics Netherlands (Statline) estimates that net immigration will be slightly over 30,000
persons in the long run (31,000 in 2050). This is considered to be the most likely development. The 67 percent confidence interval for 2050 is estimated to lie between 7 000 and 58,000 persons. The modal estimate of 31,000 persons corresponds to 0.17 percent of the total population.
28
Economic position of immigrants
What does this mean for the future size of the foreign population? Table 2.2 shows the key
figures with respect to the foreign population in 2002 and the forecast for 2050 according to
Statistics Netherlands (CBS, 2003). The main findings are as follows: between 2002 and 2050 the share of immigrants will almost double and reach about one third of total population. This
increase can largely be attributed to non-Western immigrants. This reflects their relatively large
share in net immigration. By the year 2050 their share will, according to the forecast, have more than doubled: one of every five inhabitants will then be a non-Western immigrant.
2.2
Economic position of immigrants Employment is the key issue if we talk about the economic position of immigrants. Figure 2.5 gives the employment rate by country of origin (including the Netherlands). While the
employment rate of immigrants from Western countries is close to that of the Dutch, this is not the case for non-Westerners. Their employment rate is about one quarter lower. There are,
however, considerable differences between the constituent countries of origin: the employment rates of Moroccans and (to a lesser extent) Turks are lower than the average of non-Westerners, while the rates of Antilleans/Arubans and Surinamese are higher.
Figure 2.5 Employment and unemployment in % of the population of 15-64 years by country of origin (first and second generation), 2000 % 70 60 50 40 30 20 10 0 total
the Netherlands non-western countries other western countries Turkey unemployed
Morocco
Antilles/ Aruba Suriname
employed
Source: Statistics Netherlands
29
Immigration and the Dutch Economy: Facts and figures
Figure 2.5 includes employment and unemployment, both as a percentage of the relevant
population. The sum of these two figures is by definition equal to the participation rate (the
labour force as a percentage of the relevant population). Figure 2.5 shows clearly that, though a low employment rate tends to go hand-in-hand with a high unemployment figure, the differences in employment rates are mainly due to differences in participation rates.
Though not every person without employment qualifies for a social transfer programme,
generally speaking, a low employment rate goes hand-in-hand with high dependency on such
programmes. This is illustrated in figure 2.6, which indicates the dependency ratios by country of origin. The dependency ratio is defined as the number of benefit recipients expressed as a
percentage of the number of employed. Benefits include unemployment and disability benefits and welfare. The higher this dependency ratio, the heavier the financial burden on society. The picture in figure 2.6, if compared to figure 2.5, clearly shows that a low employment rate goes
hand-in-hand with a high dependency ratio.1 Employment is thus an important issue - not only from the point of view of the immigrant, but also from the point of view of society as a whole.
Figure 2.6 Dependency ratio by country of origin, 2000, population 15-64 years
The Netherlands
Other western countries
Suriname
Netherlands Antilles / Aruba
Other non-western countries
Turkey
Morocco 0
20
40
60
80
100
% Source: Statistics Netherlands
1
Refugees are not distinguished as a separate category here. Older sources show, however, that their dependance
on social transfers programmes is relatively high (Roodenburg, 2000).
30
Economic position of immigrants
What explains the low employment rate of non-Westerners (except the Surinamese)? There are some differences in the age and sex composition of the different groups, but these exert only minor effects. Lack of education is certainly an important factor. The average educational
attainment of non-Western immigrants is relatively low, as is illustrated by figure 2.7. On
average, labour market participation is positively related to educational attainment, while for
unemployment the opposite is true. Thus, it follows that the low educational attainment of these immigrants will adversely impact their employment rate. However, per level of education, we still find lower employment rates for non-Western immigrants. It can be calculated that
educational attainment explains only one-third of the lower employment rate of non-Western immigrants.
Figure 2.7 Educational attainment a by country of origin, 2000, population 15-64 years % 100
80
60 tertiary higher secondary lower secondary 40
primary
20
0 TMSA a b
b
The Netherlands
Highest level accomplished except for ‘primary’, which includes less than primary Turkey, Morocco, Suriname and Net. Antilles/Aruba
Source: Statistics Netherlands
As was pointed out before, the employment rate is determined by both the participation rate and the unemployment rate. Several explanations, other than educational attainment, have been
suggested for the high unemployment rate of non-Western immigrants. Van Praag and Tesser
(2000) point out that factors that are not reflected in formal educational attainment may play a role as well. They mention language skills, communication skills in general, motivational
characteristics and familiarity with job search channels. It should further be noted that the
education level ‘primary' includes people with only a few years of primary education or even
31
Immigration and the Dutch Economy: Facts and figures
without any formal education at all. This causes some overestimation of the actual educational attainment of non-Western immigrants. The significance of language problems should not be underestimated. Dagevos (2001) concludes from an empirical investigation among heads of households, that about 70 percent of the Turks and 60 percent of the Moroccans frequently
experience problems with speaking and reading Dutch, and that they prefer their own language
to communicate with other members of their household. Also playing a role, however, are other factors not associated directly with the immigrants. Based on empirical findings from
1993/1994, Bovenkerk et al. (1995) concluded that "...the unfavourable position of ethnic minorities on the Dutch labour market is not only due to their low educational level and
language problems, but is, for a substantial part, caused by discriminatory behaviour on the part of employers in hiring procedures.". Similar findings were reported by Van Beek and Van Praag (1992). It remains to be seen whether these results still apply to the year 2000. The labour
market situation changed drastically: high unemployment gave way to labour shortages, which may have induced employers to be less selective.
While the explanation of high unemployment among non-Western immigrants is already far
from precise, the explanation of their low participation rates is even more enigmatic. It is not
unlikely that a ‘discouraged worker effect' plays a role. Immigrants who, in job applications, are repeatedly confronted with their inadequate language skills, or with discrimination, may finally give up. Cultural factors are likely to play a role as well. For instance, some immigrant women do not enter the labour market for religious reasons.
The low employment rate of non-Western immigrants does not seem to be a specific problem of the Netherlands, as is suggested by figure 2.8. The figures in this graph relate to non
EU nationals. This is not the same as immigrants, as in some countries many immigrants have acquired the nationality of the host country, while in other countries that is not the case. This may be a source of ‘selection bias’. Moreover, the figures of non EU nationals include both
Western and non-Western nationalities. Strictly speaking, these figures on non EU nationals do not allow us to draw precise conclusions with respect to non-Western immigrants. If,
nevertheless, we assume that they give an indication of differences between countries with respect to the employment rate of non-Western immigrants, the following figures for
non EU nationals may shed some light on the position of non-Western immigrants as well.
Most countries show a relatively low employment rate of non EU nationals (index less than 100), but the figure for the Netherlands is among the lowest. We have no explanation for this
phenomenon. It might be related to the social transfer system (particularly the disability scheme), which is known to be relatively generous and accessible, and thus provides a
disincentive to employment. Taking age differences into account, the number of disability
32
Economic position of immigrants
beneficiaries among non-Western immigrants is about 20 percent above the national average (CBS, 2001).
Figure 2.8 Employment rate non EU nationals, 2000, index (nationals = 100)
Belgium Sweden Netherlands Denmark France Ireland Finland United Kingdom Germany Norway EU-15 Switserland Luxemburg Austria Iceland Portugal Spain Italy Greece 0
20
40
60
80
100
120
Source: Eurostat
As was indicated above, a low employment rate goes hand-in-hand with a high dependency on social transfer programmes. Thus, figure 2.8 supports the idea that the relatively generous
welfare states of Western Europe tend to attract migrants that are likely to become dependent on welfare state provisions. This idea of so-called ‘welfare magnets’ is confirmed by empirical research with respect to the United States (Borjas, 1999c).
Thus far, we have treated the economic position of immigrants mainly in terms of employment. We will conclude with some brief remarks about income. In the year 1999, the net income of
households of non-Western immigrants was just in excess of 75 percent of the national average. the Netherlands (CBS, 2002b). The result is not surprising. As we have seen, non-Western immigrants are relatively low-skilled and are relatively often dependent on benefits.
33
Immigration and the Dutch Economy: Facts and figures
2.3
Immigration and integration policies Scope of immigration policy Immigration policy tries to regulate the size and composition of immigration flows. This has proved to be difficult for many reasons. First, the driving forces of immigration (mainly
economic and humanitarian by nature) and the activities of the international migration industry, are largely beyond the control of the authorities in the host country. Second, the scope for
regulation is limited, moreover, due to a number of international agreements (i.e. the Geneva
refugee treaty, the Charter of Fundamental Rights of the European Union, the Charter for the
Kingdom of the Netherlands, the Schengen Accord and the Dublin Convention), although these agreements, in principle, are open to adjustment. A third reason is that physical borders with
neighbouring countries have ceased to exist since implementation of the Schengen Accord in 1995. Restrictions on immigration have become mainly administrative, such as the denial of
public facilities to illegal aliens. Once the expected common immigration policy is introduced in the European Union, the freedom for each host country to act will be even further restricted. Despite the above-mentioned limitations, there remains some room for the authorities to
regulate immigration. Generally speaking, Dutch immigration policy has moved in a more restrictive direction over time. Labour migration The oil crisis of 1973 marks a turning point in Dutch immigration policy. The prospect of
economic stagnation and increasing unemployment led to the adoption of a restrictive regime
for labour migration. Labour migration from non-Western countries came to an end. However,
as was described in section 2.1, immigration on other grounds (family, asylum, Dutch passports) was hardly discouraged and so the Netherlands remained effectively an immigration country. With respect to labour migration, legislation was adopted under which employers were only
allowed to employ workers from outside the European Economic Area (EEA = EU plus Iceland,
Liechtenstein and Norway) if they could prove that suitable employees could not be found within that area. In the years of high unemployment, which came to an end in the late nineties, this
requirement served as a de facto restriction on labour migration to the Netherlands. Since the
late nineties, however, the situation on the Dutch labour market has changed. Unemployment
decreased sharply and an increasing number of vacancies signalled labour shortages. A decrease in unemployment could also be observed in other European countries, but the resulting level of unemployment was still higher than in the Netherlands. Since then, it has become easier for
employers to prove that they can not find suitable employees in the Netherlands and, though to a lesser degree, inside the EEA. The same regulations thus changed from restricting to
facilitating labour migration. In principle, the system is open-ended. This does not mean,
34
Immigration and integration policies
however, that labour migration from non-Western countries has already become a major component of total migration from these countries to the Netherlands.
The present Dutch system of labour migration is demand-driven. Permission is given only if a
specific vacancy exists. Employment of the person in question is thus guaranteed. This approach
is different from supply-driven labour migration, as it exists in traditional immigration countries (Loobuyck, 2001). These countries employ a point system (Canada) or quota (the so-called green
card lottery in the United States) or a combination of both (Australia). In such a system there is a certain likelihood, but no guarantee, that an immigrant will be employed. In principle, labour
migration into the Netherlands is temporary. The permit issued is of limited duration, but can be renewed. The present system may in practice lead to permanent immigration.
The international debate on labour migration was triggered by a report of the United Nations (2000) that suggested that European countries should welcome more immigrants and thus reshape the unfavourable age distribution of their ageing populations. Van Imhoff and Van Nimwegen (2000) calculated what the implications of this prescription would be for the
Netherlands. In order to keep the share of the senior population (65 years or older) at the
present level, net immigration would have to increase on average by 300,000 persons per year up to 2050. This is about ten times the current projection for that year. In 2050, the total
population would reach the level of 39 million, while the present level is 16 million. This policy would create additional ageing problems after 2050, and immigration would thus have to
continue even further to keep the share of seniors at the desired level. By the year 2100 the population would then have reached 109 million. It will be no surprise that the idea of
‘replacement migration' as launched by the United Nations has not gained much support in the Netherlands. However, the idea that some immigration might be helpful appeared on the agenda in Europe.
Already before the publication of the United Nations report, members of the European Union took the decision to develop a common immigration policy. Accordingly, the European Commission issued a memorandum on this issue (Commissie van de Europese
Gemeenschappen, 2000). The Commission, referring to the demographic changes in the EU, advocates a common policy with respect to the controlled admission of economic immigrants, including permanent immigrants, in the EU. Immigrants, according to the commission, can
make a positive contribution to the labour market, economic growth and the sustainability of the welfare state. This means that restrictions on economic immigration in the EU should, according to the Commission, be alleviated.
35
Immigration and the Dutch Economy: Facts and figures
The position of the Dutch cabinet with respect to the ideas launched by the Commision, was laid down in a memorandum (Tweede Kamer, 2001a). As regards the budgetary effects of ageing,
priority should be given to measures such as a further increase in participation and a decrease in disability (now widely used as an exit route) and an increase in productivity. Immigration is not
seen as an option, because it may well aggravate rather than alleviate the financial problems, due to a negative fiscal impact (see also Van Ewijk et al., 2000). With respect to labour market
imbalances due to demographic trends, the same arguments apply. However, bottlenecks (in particular, with respect to high-skilled labour) may occur. Educational policy and the present system of demand-driven temporary labour immigration is expected to be adequate. So, as
regards the proposals of the Commission, the government did not see any reason to change its policy with respect to labour migration. The Dutch position is in line with the findings of the Netherlands Scientific Council for Government Policy (WRR, 2001). Their conclusion is that labour migration may be profitable for both the immigrant and his or her employer, but that this provides no guarantee that the outcome on the national or macro economic level will be
positive. The Council does not consider labour migration - unless it is selective and temporary to be a suitable instrument for economic policy. Asylum While labour migration is more or less subject to regulation, this is much less the case with
immigration through the asylum channel. Once inside the country, any foreigner is entitled to
ask for asylum. In an application centre (so-called ‘aanmeldcentrum’), the apparently unjustified applications are sorted out within a few days. The remaining applicants are admitted to the asylum procedure, during which they can stay in an asylum seekers’ centre
(‘asielzoekerscentrum’), where they are provided with food, clothing, shelter, medical aid and
pocket money. In the second half of the nineteen nineties, about half of those who initially asked for asylum were eventually granted a legal status, either as a refugee or for other (humanitarian) reasons. The whole procedure took on average about two years. Those who were denied a legal status were supposed to leave the country. However, they could have extended their stay as illegal immigrants.
Recently, new legislation, shortened the procedure and tightened the regulations. This may
explain the decrease in the number of applications that has been observed since 2001, and it may also have caused the decline in the number of successful applications.
The influx of asylum seekers remains, however, highly unpredictable and largely beyond
government control. This has especially been the case since the introduction of open borders
under the terms of the Schengen Accord in 1995. The Dublin Convention, intended to redirect
36
Immigration and integration policies
asylum seekers to the country of first arrival within the Schengen area, has proved to be far from effective (CPB, 1999).
The large numbers of asylum seekers who do not pass indicate that many asylum seekers are
economically, rather than politically, motivated. Though the Geneva refugee treaty demands the host country to offer protection to people under threat, it does not demand permanent
immigration. Nevertheless, under the present rules, those asylum seekers who have been
granted a legal status, are almost automatically entitled to a permanent resident permit three
years later. This perspective makes the asylum channel particularly attractive to economically motivated immigrants. Family migration In principle, immigrants are entitled to ‘family reunification', which means that their spouse
and children up to a certain age are entitled to immigrate. Residents, whether Dutch or foreign, are also entitled to ‘family formation', which means that if they start a relationship (not
necessarily marriage) with a foreigner, the person in question is also allowed to immigrate.
These are the general principles, but the resident in question has to meet certain requirements, such as adequate income and housing. The requirements with respect to this type of immigration have become more strict over the years.
As was pointed out earlier, immigration through the ‘family channel', can go on for a long time and add up to considerable numbers. For instance, most marriages of residents with a Turkish
of Moroccan background are with partners from the country of origin. This follow-up migration
limits the scope of any immigration policy that is selective with respect to the economic potential of immigrants. After all, given international agreements, family immigrants can be subject to criteria of that kind only to a limited extend. Integration An overview of policies with respect to ethnic minorities, as they existed until recently, is given by Lucassen and Penninx (1994) and Choenni (2000). A review of these policies in the first stage was given by the Netherlands Scientific Council for Government Policy (WRR, 1989). Initially, ethnic minorities were supposed to stay only temporarily, and this was the official
position taken by the authorities. Accordingly, integration policy was not an issue. Gradually, it came to be accepted that these minorities were here to stay. This was recognized by the
authorities in the early eighties, and integration policy began to soar. In fact, until recently, this
policy focussed mainly on alleviating the deprivation of immigrants, rather than on integration. Attention was focussed on better access of immigrants to employment, education and housing
and enhancement of their legal position. Cultural diversity was highly valued, and incentives to
37
Immigration and the Dutch Economy: Facts and figures
learn the Dutch language were handled with reservation. The idea was that while immigrants
should integrate, their identity should be preserved at the same time. This concept dates from the time before integration policy came into being (SCP, 1976). Children belonging to certain
ethnic minorities received lessons in their ‘own' language and culture during school hours. This type of education had already been introduced in the nineteen seventies and was substantiated
by the notion that these children would eventually return to the country of origin. Once that idea was abandoned, this type of education was defended on psychological and pedagogical grounds, although it has always remained controversial (Lucassen and Penninx, 1994).
Since 1998, new immigrants are required to take part in a programme called ‘inburgering’. The
programme, which includes a Dutch language course, an introduction to Dutch institutions and values, and labour market orientation, is considered to be the first step towards integration.
Participation is compulsory for new immigrants, which implies that they are expected to play an active role in this first step towards integration. A similar programme, though on a voluntary basis, is available for immigrants who arrived before the compulsory programme was
introduced. Implementation of the compulsory programmes has suffered from a number of
drawbacks. First, while non-participation and dropping-out taken together amount to over 40
percent, sanctions have rarely been imposed. Second, for those who do attend classes, the final outcome is uncertain as there is no systematic final exam to measure the results; one survey
indicates that about half the participants finally meet the requirements with respect to language skills. (Ministerie van Financiën, 2002). Recent changes After decades of relative silence, immigration and integration have recently become the subject of public debate. For instance: Lakeman (1999) raised the question of fiscal impact, Scheffer
(2000) concluded that integration policy had failed and Van der Zwan (2002) questioned the
absorption capacity of the host society with respect to immigration. It has become increasingly
clear that immigration and integration are interrelated (Tweede Kamer, 2002). The continuing
high levels of immigration have not only increased the strain on the integration machinery, but have also created a disincentive for immigrants to integrate. Their increasing numbers have
made it easier for immigrants to live in self-contained communities, particularly in the larger cities.
The government that took office in 2002 has signalled increasing controversy between ethnic groups, while noting that not enough progress has been made in the integration process
(Rijksvoorlichtingsdienst, 2002). To turn the tide, this government intended to further reduce
immigration by restrictive measures directed towards asylum and family migration. Another tie has been made between immigration and integration by requiring successful completion of the
38
Immigration and integration policies
inburgering programme before a permanent residence permit will be issued. A further
significant change is the abolition of education in the ‘own’ language of immigrants’ children, as the government gave priority to lessons in the Dutch language.
In 2003, a new government took office. Its intentions with respect to immigration and
integration policies seem, generally speaking, to be in harmony with those of the previous
government (Rijksvoorlichtingsdienst, 2003). The requirement of a successful completion of the inburgering programme before a permanent residence permit will be issued will apply to
admitted asylum seekers. Immigrants who come to the Netherlands on a voluntary basis, if they belong to a category for which an inburgering programma is compulsory, are required to acquire a basic knowledge of the Dutch language before they are allowed to enter the country.
39
Immigration and the Dutch Economy: Facts and figures
40
Introduction
3
Labour market
3.1
Introduction What will happen to the labour market of a host country if immigration increases the number of people in the labour market? In the first place, it may affect resident workers, as the number of their competitors increases. However, as the economy adjusts to the new situation, other
production factors may also be affected. Low-skilled and high-skilled resident workers may be
affected differently if immigrants are either predominantly low-skilled or predominantly high-
skilled. This chapter therefore also studies the effects of immigrants with particular skill levels. An important question is what will happen to the labour market opportunities of resident
workers. Standard economic theory says that immigrants have a negative impact on earnings of production factors to which they are substitutes. For instance, low-skilled immigrants might
affect the labour market opportunities of low-skilled resident workers negatively, either because of downward pressure on their wages, or, in case of rigid wages, because of deteriorating
chances of employment. The extent of these effects is, however, difficult to measure. This
chapter tackles the problem of measurement by employing a stylized model of the economy of a host country. The stylized model is elaborated by Borjas (1995, 1999b) especially to analyse the economic consequences of immigration for the resident population.1
Although the impact of immigration on the earnings of resident workers is an important issue, economic theory says a lot about other effects, as well. In particular, some US and Canadian
authors emphasize certain non-negligible positive effects. Owners of production factors that are complements to immigrants might actually gain from immigration and these gains might be
larger than the losses of owners of other production factors. Nevertheless, the overall net gain of
the economy is likely to be small and redistribution of earnings within the resident population is likely to be substantial.
The model employed in this chapter is stylized, but it provides an intuitively clear method to tally the gains and losses of residents. In the economic literature, the resulting overall net gain is
called the immigration surplus. We emphasize up front that the stylized model assumes flexible wages and full employment. Moreover, the model does not include a public sector and the associated social transfer programmes. In other words, this chapter ignores a potential 1
We consider the resident population, which includes the population with a foreign background already living in
the host country, as we want to study the impact of future immigration. In is own work, Borjas mostly considers the native population, which is the population born in the host country, as he studies the impact of past immigration.
41
Immigration and the Dutch Economy: Labour market
disproportional use of social security and welfare by immigrants. This aspect will be discussed in Chapter 4.
Of course, there are alternative models to analyse the economic effects of immigration. For
example, Altonji and Card (1991) and Zorlu (2002) employ a model of connected local labour
markets and analyse the outcomes for low-skilled residents. Burda and Wyplosz (1992) employ a model with human capital formation and analyse wage differentials within an integrated
Europe. Chiswick et al. (1992) employ a long-run model and analyse the trade-off between
immigrant quantity and immigrant quality. And Steinmann (1994) employs a long-run model
that incorporates the costs of integration and analyses the short-run and long-run effects for the
resident population. An advantage of the model employed in this chapter is its transparency, and for this reason the recent Dutch WRR study (2001) uses a similar approach. At the same time,
the relative simplicity of the model is a weakness. At the end of this chapter we therefore discuss several aspects ignored by the stylized model.
3.2
Stylized model The stylized model in a nutshell The model of this chapter is stylized in the sense that it considers only some direct effects of
immigration, and in the sense that it distinguishes only two types of labour. We first present a simple version of the model to demonstrate the direct effects.
We consider a competitive economy with two production factors: capital and labour. We assume both the number of workers and the stock of capital to be fixed, i.e. perfectly inelastic. Figure 3.1 illustrates the demand for labour at different wages in the form of a demand curve fL.2 The
labour demand curve fL will not be affected by immigration, as we assume the stock of capital to be fixed. Curve S represents labour supply without immigrants and thus with a number of N resident workers, while curve S’ represents labour supply with an additional number of M
immigrant workers. Flexible wages allow the economy to reach an equilibrium where supply and demand meet. In the initial equilibrium B the wage is equal to w0. The entry of M
immigrants shifts the labour supply curve, leading to a new equilibrium C with wage w1. How does immigration affect the incomes of different groups in the population? We distinguish residents from (new) immigrants, and we assume both groups supply labour. We assume that
residents own the production factor capital entirely. We do a welfare analysis using the property
2
This is the compensated demand curve, which gives the demand for labour (holding the marginal costs of
production constant). We need this particular demand curve to calculate surpluses (Binger and Hofmann, 1998).
42
Stylized model
that the area under the labour demand curve fL is equal to the economy’s total output. Figure 3.1 shows that immigration increases total output from trapezoid ABN0 to ACL0, implying a gain
of trapezoid BCLN. A large part of it, rectangle DCLN, will be paid to immigrants in the form of
wages. The rest, triangle BCD, will be divided among residents. The increase in total earnings of the resident population is called the immigration surplus.
Immigration thus increases national income accruing to residents. Do all residents gain? It
turns out that resident workers are actually worse off, as their part in national income decreases
from rectangle w0BN0 to w1DN0. Who actually gains? National income not paid to workers goes to the only other production factor, which is capital. Total earnings of capital owners increase
from triangle ABw0 to ACw1. In other words, within this simple model immigration implies a
redistribution in favour of capital owners.
Figure 3.1 The immigration surplus in a simple model of the labour market 3 S
Wage
S’
A
B !
w0
C
w1
! D
ƒL N
0
L=N+M
Employment
The stylized model in detail We extend the simple model by introducing different types of labour. Furthermore, we discuss different assumptions on how the production factor capital adjusts in reaction to immigration.
This subsection presents the model in descriptive terms, while appendix 2A presents the model in analytical terms.
3
For the sake of argument, the magnitudes of the effects are exaggerated and do not refer to any specific case.
43
Immigration and the Dutch Economy: Labour market
We consider a competitive economy with three production factors: capital, high-skilled labour and low-skilled labour. We assume that within each type of labour workers are perfect
substitutes in production. We further assume the number of resident workers of each skill type to be fixed; i.e. labour supply is perfectly inelastic. Thus, the total number of workers after the arrival of the immigrants is the number of resident and immigrant workers taken together.
An influx of immigrants causes adjustments in wages and the return to capital (which are both defined in real terms). As a result, some production factors gain and some lose. The
immigration surplus is a weighted average of the changes in the rewards of the production factors, whereby the weights are the respective shares of the production factors in the total
production costs. If residents own the entire capital stock, the total gains of the residents are larger than the total losses, so that the immigration surplus is always non-negative (Borjas,
1999b). However, the assumption that residents own the entire stock of capital is unrealistic for a small and open economy like the Netherlands. Later in this section we investigate what happens to the immigration surplus if foreigners own part of the capital stock.
The analysis of this section will show that the adjustment of the economy after an influx of
immigrants crucially depends on how the production factor capital adjusts. We consider two
polar cases: in the first case, we assume the stock of capital to be fixed. As the stock of capital cannot react to immigration, the adjustment mechanism of the economy depends solely on
changes in wages and the return to capital. In the second case, we assume the return to capital to be fixed. A rising return encourages capital to flow into the country until the return is again
equalized across countries. As now the stock of capital helps the economy to adjust, the impact of immigration on wages might be strongly dampened.
Which of the cases is more realistic depends on the international mobility of (physical) capital.
As it takes time for the stock of capital to adjust, on the short run the case of immobile capital is clearly more realistic. The international mobility of capital on the longer run is, however, still
open to scientific dispute. On the one hand, many studies show that capital is not very mobile
internationally. But on the other hand, the European capital markets are integrating rapidly so that capital is becoming more mobile within the EU (Gorter and Parikh, 2003). As we will
consider a small and open economy, i.e. the Dutch economy, the long run situation is likely to be close to the case of mobile capital.
We have formulated the stylized model in general terms, and it does not represent a particular
economy. For an application to the Netherlands we need to specify the parameters of the model.
44
Stylized model
Empirical specification In our model, adjustments of the economy are mainly due to changes in wages. It is therefore important to know how wages react to immigration. In this section, we specify factor supply
elasticities of wages. The definition of these elasticities is: ghh = Mlog(wh)/ Mlog(Lh), which is the
own-labour-supply elasticity of the high-skilled, where wh is the wage of high-skilled workers and
Lh is the number of high-skilled workers.4 The interpretation of such an elasticity is as follows: if,
for instance, the own-labour-supply elasticity of the high-skilled is -2, and the labour supply of high-skilled workers increases by 1%, then the wages of high-skilled workers will decrease by 2%.
The empirical specification of the elasticities is not obvious. Borjas (1999b) chooses a range of values that is credible for the US economy. The present study relies on a number of empirical studies for the Netherlands. This section presents the derivation in descriptive terms, while appendix 2B presents the derivation in analytical terms.
We calculate the Dutch factor supply elasticities of wages on the basis of empirical results for production functions that are part of the CPB macroeconomic model for the medium term,
JADE (CPB, 1997, Draper and Manders, 1997, Draper, 2001). The production functions are of the Constant Elasticity of Substitution (CES) type, which implies that we need to specify the substitution elasticities between the production factors.
Draper (2001) reports a substitution elasticity between capital and labour of about 0.3. The
interpretation of this figure is as follows: if the production factor capital becomes 1% cheaper
relative to the production factor labour, then the demand for capital, relative to the demand for labour, will increase by 0.3%. The size of the elasticity implies that capital and labour are
complements in the Dutch production process. Many macroeconomic studies assume that the substitution elasticity is equal to unity, but this is often a result of using the rather inflexible
Cobb-Douglas production function. Empirical studies mostly find that the substitution elasticity is smaller than one (Hamermesh, 1993). An elasticity of 0.3 is, however, at the lower bound of
the range reported in the literature. Note that because of the production function, here labour is to be interpreted as a weighted average of the two different types of labour.
Next, we need to specify which workers are low-skilled and which are high-skilled. We use the
definition of the JADE model: Low-skilled workers are workers with primary or lower secondary education, while high-skilled workers are workers with higher secondary or tertiary education.5
4
These are compensated elasticities, which are elasticities holding the marginal costs of production constant.
5
Other definitions of high and low skills lead to similar results in a qualitative sense (Borjas, 1999b).
45
Immigration and the Dutch Economy: Labour market
In 2000, about 33% of Dutch workers were low-skilled. Draper and Manders (1997) report a substitution elasticity between the two types of labour, keeping the capital stock constant, of
about 1.7. As the demand for the two types of labour reacts strongly to changes in wages, the
types of labour are substitutes in the Dutch production process. Other empirical evidence on this substitution elasticity hardly exists. Hamermesh (1993) reports substitution elasticities
between blue and white collar workers, but the range of the results is very wide. For this reason, our analysis will include a sensitivity analysis on this particular substitution elasticity.
Besides substitution elasticities, we need the production factors’ shares in the total production
costs at the national level. In 2000, the share of capital in total production costs was about 35%.
To calculate the shares of the two types of labour in total production costs, we use the number of workers and the average gross wages per skill level. The shares in the total production costs of low-skilled and high-skilled workers are about 17% and 49%. Table 3.1
Factor supply elasticities for the Dutch economy
a,b
j (quantities) i (prices)
Capital (i=k)
Capital
High-skilled labour
Low-skilled labour
(j=k)
(j=h)
(j=l)
S 2.0
1.5
0.5
High-skilled labour (i=h)
1.1
S 1.0
S 0.1
Low-skilled labour (i=l)
1.1
S 0.4
S 0.7
a b
Entries are compensated factor supply elasticities gij = d log(pi) / d log (qj) with price pi and quantity qj. Appendix 2B presents details on the derivation of the elasticities
Table 3.1 reports the factor supply elasticities. The own-capital-supply elasticity is -2, which is
large: a 1% increase in the supply of capital leads to a 2% decrease in the return to capital. All cross-elasticities between capital and labour, gkh, gkl, ghk, and glk are larger than zero. This is
because capital and labour are complements in production. For example, an increase in the
supply of capital leads to a higher demand for labour and therefore to higher wages. High-skilled labour is more complementary to capital than low-skilled labour as an increase in the supply of
high-skilled labour has a stronger impact on the return to capital. This finding is in line with the international evidence reported by Hamermesh (1993).6 The wages of high- and low-skilled
labour react with the same magnitude to the supply of capital: this is a result of the nested CES production function which is restrictive in this sense.
6
Direct comparisons with elasticities reported in the literature are difficult, as the literature reports price
elasticities.
46
Simulations
The cross-elasticities for labour, ghl and glh, are negative. This is because the two types of labour are substitutes in production. For example, an increase in the supply of low-skilled workers
drives down the wages of low-skilled, but it also drives down the wages of high-skilled as they face stronger competition. The own-supply-elasticities of wages are in line with the evidence
reported in the empirical literature: wages of low-skilled workers are less sensitive to the supply of low-skilled workers than wages of high-skilled workers to the supply of high-skilled workers.
3.3
Simulations Results The stylized model, empirically specified for the Netherlands, can be employed to explore the
impact of immigration on the economy. The model is static, which means we can compare two equilibrium situations, one prior to the influx of immigrants and one after their arrival. In the
real world, however, we observe waves of immigration taking place over a longer period of time
rather than an instantaneous arrival. Nevertheless, the basic mechanisms at work are essentially the same. We assume an increase in labour supply of 5% because of immigration. In terms of
current labour supply, this would amount to approximately 0.4 million additional workers in the Netherlands. This figure has the order of magnitude of the negative impact of population ageing on the labour force that is expected in the first decades of the current century.
The impact on the labour market is determined not only by the number of immigrants, but also by their skills. We consider the following cases or scenarios. First, we assume all immigrants to be low-skilled. This scenario coincides with the Dutch immigration policy of the 1960’s and early 1970’s. Second, we assume all immigrants to be high-skilled. This scenario can be
associated with the selective immigration policies of certain Anglo-Saxon countries. Canada and Australia, for instance, select economic immigrants on the basis of skill shortages in their own labour market. This is, of course, not necessarily a selection on immigrants being high-skilled,
but it comes close to it. In addition to the two extreme scenarios, we consider a third scenario in which immigrants have the same skill distribution as residents. In reality, the skill distribution of immigrants will not fit to any of the three cases, but our approach provides us with clear insight into the basic mechanisms at work.
47
Immigration and the Dutch Economy: Labour market
Table 3.2
Simulation of economic effects of immigration, in %
a
only low-skilled immigrants
skills immigrants equal to residents
only high-skilled immigrants
Assume: stock of capital fixed Change in return to capital
6.9
9.7
10.5
Change in wages of high-skilled residents
S 1.7
S 5.1
S 6.7
Change in wages of low-skilled residents
S 9.7
S 5.1
S 2.5
2.4
2.9
3.2
0.10
0.08
0.11
Change in quantity of capital
3.6
5.0
5.4
Change in wages of high-skilled residents
2.0
0.0
S 1.0
Change in total GDP Immigration surplus
b
Assume: price of capital fixed
S 6.0
0.0
3.1
Change in total GDP
Change in wages of low-skilled residents
3.4
5.0
5.2
Immigration surplus
0.06
0.00
0.02
a b
We assume immigrants to increase the labour force by 5%. We assume residents to own the entire stock of capital.
We first discuss what happens if all immigrants are low-skilled. Table 3.2 shows that low-skilled residents are clearly worse off, as their wages decrease by 6% to 10%. Whether high-skilled
residents gain or lose depends on the mobility of capital. In case of immobile capital, so on the short run, the substantial downward pressure on the wages of the high-skilled will make them
also worse off. And in case of mobile capital, so on the longer run, the adjustment of the capital stock will dampen the downward pressure on the wages so that the high-skilled are better off.
Capital owners gain only on the short run. The immigration surplus is at best 0.1% of GDP. On the basis of a population of 16 million and a GDP of 400 billion Euro, the annual gain accruing to residents is at best 25 Euros per head of the resident population.
The effects for high-skilled and low-skilled residents will switch if immigrants are high-skilled. Now the effects for high-skilled residents are clearly negative, while the effects for low-skilled residents depend on the mobility of capital. The mobility of capital makes the immigration surplus very small. Next, the least profitable case is when immigrants have the same skill
distribution as residents. In case of perfectly mobile capital, the equilibrium of the economy will not be affected at all. The only effect is that the economy grows by 5%. Note that the stylized
model does not include scale effects. On the short run the immigration surplus is non-negative: capital owners gain, while both types of workers are about equally worse off.
48
Simulations
Table 3.3
Simulation of redistribution because of immigration, in billions of Euros only low-skilled immigrants
a,b
skills immigrants equal to residents
only high-skilled immigrants
Assume: stock of capital fixed Change in total earnings of capital owners
c
9.8
13.6
14.7
Change in total earnings of highS skilled residents
S 3.3
S 9.9
S 12.6
Change in total earnings of lowS skilled residents
S 6.0
S 3.4
S 1.7
8.6
11.9
12.9
0.4
0.3
0.5
S 2.0
Change in total GDP Immigration surplus
c
Assume: return to capital fixed 4.0
0.0
Change in total earnings of lowS skilled residents
Change in total earnings of highS skilled residents
S 3.7
0.0
2.1
Change in total GDP
13.8
20.1
20.9
Immigration surplus
0.3
0.0
0.1
a b c
We assume immigrants to increase the labour force by 5%. We use the GDP of the year 2000, which was 402.6 billion Euros. We assume residents to own the entire stock of capital.
Table 3.3 shows the amounts of redistribution between residents caused by immigration. Capital
owners will gain only if capital is not perfectly mobile. The mobility of capital, moreover, leads to a redistribution of several billions between high-skilled and low-skilled residents. In all scenarios, the immigration surplus is only a small fraction of the amounts involved in
redistribution.7 The redistribution caused by immigration therefore seems to be more important
than the immigration surplus.
Until now, we have assumed that residents own the entire stock of capital. In particular for a
small and open economy like the Dutch economy this assumption may be seriously flawed. The fraction of the Dutch capital stock that is in foreign hands is difficult to estimate. To get an
indication of the importance of foreign ownership of capital, we consider the annual return to
capital which leaves the country. In the year 2000, about 7.5 billion Euros of profits, 5.9 billion Euros of dividends, and 10.6 billion Euros of interest payments left the country, adding up to a total of 24.0 billion Euros. These figures should be interpreted with care, as in particular
international capital flows within multinational firms may affect the figures. Nevertheless, the
result is substantial compared to the capital share in total production costs, which is about 140 billion Euros on an annual basis.
7
Appendix 2A shows that the stylized model exhibits an increasing return to immigration. Nevertheless, the
conclusion also holds for other realistic numbers of immigrants.
49
Immigration and the Dutch Economy: Labour market
As we do not know the exact figure of foreign ownership of capital in the Netherlands, we do a break-even analysis for each of the three skill distributions for the case ‘stock of capital fixed’.
This means, we calculate the fraction of foreign ownership at which the immigration surplus would be zero. For all three scenarios, the break-even point is at about 4%. As the amount of
returns to capital leaving the country is sizable, the immigration surplus is likely to be small, and maybe even negative. Sensitivity analysis The specification of the elasticities are based on several assumptions on parameters that are still
open to scientific dispute. We do a sensitivity analysis to show which parameters are crucial. We
do this by comparing our results to the results of Borjas (1995, 1999b) for the US economy. The comparison is however less than straightforward, as Borjas uses other definitions of skill levels.
We will first examine how we can make the simulations for the US economy comparable to our simulations.
Borjas (1999b) considers two different definitions for skill level: the first is based on high school graduates, and it implies that 91% of workers are high-skilled, while the second is based on high school-college equivalents, and it implies that 43% of workers are high-skilled. In particular,
under the first definition, if all immigrants were low-skilled, it would imply a large increase in the number of low-skilled workers. To render the US situation comparable to the Dutch
situation, where about 64% of workers are high-skilled, we assume the skill distribution to be measurable on a continuous scale, so that we are able to find a definition for the US implying
that 64% of workers are high-skilled. Using the income shares of Borjas that correspond to his two different definitions of skills, the income share of high-skilled and low-skilled workers in national income is approximately 52% and 18%.
Borjas performs the simulations by choosing different values for the own-supply-elasticities.
Where the Dutch elasticities of high- and low-skilled wages are equal to (-1.0, -0.7), see table 3.1, he allows the US elasticities to vary from small (-0.5, -0.3) to large (-1.5, -0.9). And where we
assume high- and low-skilled workers to be substitutes in production, he assumes them to be complements. It will turn out that in particular the last assumption leads to different results. Table 3.4 compares the immigration surplus for the Netherlands (see table 3.2) to the three
different cases for the US reported by Borjas. Despite the major difference in the elasticities, the
results on the immigration surplus do not seem to deviate between the two countries: the Dutch results are close to the results on the medium and large elasticities for the US.
50
Simulations
Table 3.4
Comparison of immigration surplus, in % of GDP
a,b
only low-skilled immigrants
skills immigrants equal to residents
only high-skilled immigrants
0.07
Assume: stock of capital fixed US, (small elasticities)
c
0.04
0.03
US, (medium-size elasticities)
0.08
0.06
0.12
US, (large elasticities)
0.10
0.10
0.20
NL, (see table 3.2)
0.10
0.08
0.11
US, (small elasticities)
0.04
0.00
0.01
US, (medium-size elasticities)
0.07
0.00
0.02
US, (large elasticities)
0.09
0.00
0.03
NL, (see table 3.2)
0.06
0.00
0.03
Assume: price of capital fixed
a b c
We assume immigrants to increase the labour force by 5%. We assume residents to own the entire stock of capital. The three cases for the US are taken from Borjas (1999b).
Table 3.5
Comparison of change in wages of low-skilled, in %
a,b
only low-skilled immigrants
skills immigrants only high-skilled equal to residents immigrants
Assume: stock of capital fixed US, (small elasticities)
b
-3.7
-0.7
1.1
US, (medium-size elasticities)
-7.4
-2.2
1.1
US, (large elasticities)
-9.9
-3.1
1.1
NL, (see Table 3.2)
-9.7
-5.1
-2.5
US, (small elasticities)
-3.5
0.0
2.1
US, (medium-size elasticities)
-6.5
0.0
3.9
US, (large elasticities)
-8.8
0.0
5.1
NL, (see Table 3.2)
-6.0
0.0
3.1
Assume: price of capital fixed
a b
We assume immigrants to increase the labour force by 5%. The three cases for the US are taken from Borjas (1999b).
Does the amount of redistribution differ between the two countries? We focus on the effects for the low-skilled workers, as public discussions often focus on that particular group. Table 3.5
shows that in case of low-skilled immigrants, the effects are rather similar. The major deviation occurs for the case ‘stock of capital fixed’: the results for the US imply that low-skilled workers
are better off with high-skilled immigrants. This is a result of the complementarity between the types of labour for the US. As explained before, there is however still a lot of uncertainty on the
complementarity of types of labour in the production process. Therefore, the short run effects of immigrants with skill levels other than residents should be interpreted with care.
51
Immigration and the Dutch Economy: Labour market
Comparing the results for the two countries, we find minor differences in the immigration
surplus and substantial differences in the redistribution. Nevertheless, we should keep in mind that we have to be careful with interpreting the differences in the outcomes from the stylized
model. As the labour markets of the two countries are quite different, it is very well possible that effects of immigration are different because of reasons not incorporated in the model.
3.4
Extensions The advantage of the stylized model is that it allows us to calculate the immigration surplus. On
the other hand, the model neglects several aspects that might be important. In this section, we discuss some of these aspects and we investigate how important they are. The first possible
extensions of the stylized model we consider are labour supply, imperfect competition on the labour market and international trade. We investigate the importance of these aspect by
employing the applied general equilibrium model MIMIC (Graafland et al., 2001). We compare our results with the results reported by Nieuwenhuis (2003). The last three possible extensions of the stylized model build on insights developed in the recent economic literature.
First, the stylized model assumes labour supply to be fixed. In reality, however, we should expect it to react to changes in wages. MIMIC allows for endogenous labour supply, the model even
differentiates between the labour supply of the main and the secondary earner of the household. From a theoretical point of view, it is not possible to tell what will be the effect of changing wages on labour supply as income and substitution effects work in opposite directions.
Simulations with MIMIC show that if immigrants have a skill distribution similar to residents,
labour supply behaviour of residents will change negligibly. So for this case, it is safe to assume that the number of resident workers is fixed. If one considers the effects of immigrants with particular skill levels, then the labour supply behaviour of residents does change: with high-
skilled immigrants, high-skilled residents will reduce, and low-skilled residents will increase
their labour supply (and vice versa). So for these cases, the changes in labour supply behaviour of residents will dampen the impact of immigration on wages and therefore also on the return to capital, which will in turn reduce the immigration surplus.
Second, the stylized model assumes that the labour market is competitive. This might be a
reasonable assumption for the functioning of the US labour market, but for the Dutch labour market it is less evident. In the MIMIC model, wages are determined by a bargaining process
between employers and unions in which employers have a right to manage. As a consequence,
52
Extensions
MIMIC allows for unemployment.8 Simulations with MIMIC show that the bargaining process dampens the effect of immigration on wages, which in turn leads to a smaller immigration
surplus. Furthermore, low-skilled immigrants have a minor impact on the unemployment rate,
while high-skilled immigrants increase the unemployment rate. The latter effect occurs because the labour supply of low-skilled residents increases so strongly so that it more than offsets their increased employment opportunities.
Third, the stylized model avoids the modelling of international trade. This is a safe way of
modelling if an expanding production of exports goods does not affect the prices of the exported goods (or if international trade is unimportant for the host country). In the case of product
heterogeneity on the world market, however, an expanding production of export goods is less innocent: an open economy that specializes in certain export goods may have to accept
deteriorating terms of trade. MIMIC incorporates such an effect for the Netherlands, and
simulations show that this causes all production factors to lose with immigration. Obviously, the immigration surplus will then be negative.
Fourth, the stylized model treats the host country as a homogeneous entity and ignores the role
of regional adjustments. Resident workers might however react slowly to regional differences in wages and employment opportunities. Borjas (2001) argues that immigrants are more
responsive to regional differences and therefore help the labour market to attain an efficient
allocation. The efficiency of immigrants gain is however likely to be small for the US. Boeri et al. (2002) argue that the gain is probably larger for Europe as European workers are known to be
less mobile than US workers. But on the other hand, the Netherlands may simply be too small for this argument to be relevant.
Fifth, the stylized model considers only two skill levels and therefore ignores that particular high skilled workers might make an important contribution to an economy. An example can be taken from the modern growth literature: very high-skilled immigrants might contribute significantly
to research and development activities and therefore help a host country to realise a higher longterm economic growth. There is another side to this story: low-skilled immigrants may make an economy to specialize in low-skilled production, which may reduce incentives for innovation. Examples other that on innovation are possible as well: immigrants may be very talented
doctors, lawyers, musicians, football players, etcetera. Van Ours (2001) discusses the issue in more detail with reference to the Netherlands.
8
Note that the MIMIC model cannot explain higher unemployment rates of immigrants compared to residents, as
they are assumed to be perfect substitutes in production (depending on their skill level).
53
Immigration and the Dutch Economy: Labour market
Sixth, the stylized model ignores the potential existence of shortages of particular skills in the
labour market. For this extension we do refer to very talented and high-skilled immigrants, but
(also) to medium level skills for which shortages exist or will exist in the future. For instance, the education and health care sector are currently facing problems in attracting personnel and this
problem is quite likely to worsen in the next decades. Immigration might help to overcome such skill shortages, helping the economy as a whole to function better. Skill shortages are however
likely to be temporary as market forces react to such shortages and make them disappear on the
longer run (CPB, 2000). Skill shortages may therefore be an argument for temporary migration with a selection on particular skills (Boeri et al., 2002).
The first three extensions of the stylized model, (1) endogenous labour supply, (2) imperfect
competition on the labour market, and (3) product heterogeneity on the world market, do not
make the immigration surplus larger. From this point of view, the results of tables 3.2 and 3.3
can be interpreted as an upper bound for the immigration surplus. The last three extensions, (4) regional rigidities and adjustments, (5) selection on high skills, and (6) skill shortages and selection on particular skills, might make the immigration surplus larger. The economic
literature has however by no means reached a final conclusion on these issues. Therefore, we
still need a better understanding of the sources and magnitudes of the benefits of immigration.
3.5
Empirical evidence The evidence presented in this chapter so far is based on macroeconomic theory and macro-
econometric evidence. Does the micro-econometric evidence on wages support the prediction
that immigration decreases wages in the host country? This section investigates the evidence on wages and immigration on the individual level. Note that in this section, the definition of immigrants varies between the different studies.
Dutch studies on the effects of immigration on wages are surprisingly scarce. Almost all studies are devoted to the unfavourable position of immigrants in the labour market. An early example is Heijke (1979), while two recent examples are Van Ours and Veenman (2002) and De Graaff (2002). There is however one recent exception to the rule: Hartog and Zorlu (2002).
Hartog and Zorlu use two data sources to obtain the first results on immigrants and wages for the Netherlands. The first data source was taken from a questionnaire included in 20 local
newspapers on Saturday, January 17, 1998, which hypothetically came into the hands of 1.7 million households throughout the country. By merging these data to regional population
statistics, the authors were able to explain individual wages from a number of characteristics of
the respondents plus the concentration of immigrants in the region where the respondents live.
54
Empirical evidence
The main finding is that immigrants from non EU countries have a negative impact on wages of low-skilled individuals and a positive impact on wages of high-skilled individuals. As such
immigrants are mostly lowly skilled, the first finding confirms that immigration has a negative
impact on wages. The second finding, however, implies that low-skilled and high-skilled workers are complements in production. That contradicts the macro-econometric evidence used in the previous section, as that evidence suggests that the two types of labour are substitutes.
The second data source used by Hartog and Zorlu, the ‘Loon Structuur Onderzoek’, is a
combination of three data sources: an employer survey on employment and wages, the labour
force survey, and the administrative data set with insured people. The findings are less clear-cut: non-EU immigrants have no impact on wages of low-skilled individuals and a positive effect on
wages of high-skilled individuals. The findings are particularly puzzling, as EU immigrants, who are mostly high-skilled, have a negative impact on wages of low-skilled natives. Since the results from the two different data sources used by Hartog and Zorlu contradict each other, we are unable to draw firm conclusions from this study.
Do the Dutch empirical results deviate from the results for other countries? The short answer is “no”. Although phrased differently, recent survey studies on the US, like Borjas (1994),
Friedberg and Hunt (1995) and Smith and Edmonston (1997), argue that the weight of evidence
suggests that the impact of immigration on wages is negative, but small. They also conclude that the variation in the empirical results is rather large. With regard to European countries, the number of studies is limited. In a recent survey study, Bauer and Zimmermann (1999)
conclude that most empirical studies on Europe find negligible effects, and that some studies find positive effects. The recent Dutch evidence thus coincides perfectly with the US and European evidence.
Particularly in the European context the existence of rigid wages might explain the small wage
effects. So, immigration might increase unemployment rather than decrease wages. However, Bauer and Zimmermann (1999) conclude that the empirical evidence suggests that the
employment effects of immigration in Europe are small. On the other hand, Angrist and Kugler (2002) find a negative employment effect in countries with restrictive institutions.
Another explanation for the small wage effects reported by the empirical literature relates to the method of measurement. Most studies crucially depend on regional variation in the number of immigrants. There are, however, several reasons why this approach may be questionable. For
instance, immigrants might move to regions with good employment opportunities, causing a
positive correlation between immigrants and wages. Or natives may decide to move in reaction
55
Immigration and the Dutch Economy: Labour market
to an increasing number of people in their region, so that the downward pressure on the wages disappears. In these cases, the method of measurement used by most studies is incorrect. Estimation of the impact of immigration on wages requires a variation in the number of immigrants. This variation should not be disturbed by a strategic mobility behaviour of
immigrants or residents. In a recent study, Borjas (2003) uses a variation in schooling and
experience. The advantage of this method of measurement is that strategic mobility from one
group to another is almost impossible. Based on the average wage per group in the US Census
Data and the Current Population Survey, Borjas finds a sizable negative effect of the number of immigrants in a certain schooling and experience group. The result is clearly at odds with the
conclusions of recent survey studies. Future research must determine how robust this result is. While the stylized model predicts that immigration impacts wages, the Dutch and international
empirical literature on wages has a hard time showing that such a connection really exists. Most of the recent survey studies conclude although that immigration does impact wages, the impact is likely to be small. Only a recent study of Borjas finds more substantial effects. At present,
therefore, there seems little reason to reject the results of our stylized model on the basis of the empirical literature. Nevertheless, more empirical research is needed to answer the still numerous open questions on the effects of immigration on wages and employment.
3.6
Conclusions This chapter studied the effects of immigration on the Dutch labour market. We apply a stylized
model to investigate the effects of different immigration policies. We also discuss how possible
extensions of the stylized model would affect the outcomes. We conclude that immigration has the following effects:
•
the gross domestic product will increase, but this increase will accrue largely to immigrants in
•
the overall net gain in income of residents is likely to be small and maybe even negative;
•
the more the skill distribution of immigrants differs from that of residents, the larger the
•
the form of wages;
the amount of redistribution between residents is substantial; amount of redistribution becomes;
•
residents with skills comparable to immigrants will lose;
•
capital owners will win in the short run, but in the long run their gains will become zero;
• •
residents with skills different from those of immigrants will win in the long run;
due to labour market imperfections, part of the income effects on resident workers will be replaced by employment effects.
56
Conclusions
Several extensions of the stylized model make the overall gain in income of residents smaller.
Nevertheless, some potential positive effects of immigration that are not elaborated in this study should be mentioned as well. For instance, immigrants might grease the wheels of the labour market; immigration policy might select very high-skilled and talented immigrants; and
immigration policy might select immigrants with skills for with shortages exist in the labour market. Future research will have to determine the importance of such effects.
The small and possibly even negative effect of immigration on the income of residents applies under the condition that immigrants have no effect on the public sector (meaning that they
contribute as much as they gain). The next chapter investigates the consequences of dropping this assumption.
57
Immigration and the Dutch Economy: Labour market
58
Introduction
4
Public sector
4.1
Introduction This chapter analyses the financial effect (or “fiscal impact”) of immigration on the public
sector. Its main purpose is to establish whether immigration can form an alleviating factor to public finances, and thereby to the resident population, and under what economic
characteristics of immigrants this may be the case. This issue is particularly relevant in the light of the ageing of the population. Several studies (see Van Ewijk et al. (2o00) and CPB (2003)) have pointed out that population ageing will lead to rising costs for government on public
pensions, and health care and cure, and that without adjustment, government policies will
become unsustainable. In this setting, so the reasoning goes, immigration could provide a way to increase the tax base and thereby to close part of the financing gap.
This chapter investigates whether immigration can really perform this task. However, following the general practice in international literature (see Storesletten (2000), Bonin et al. (2000)), the calculations will not only be restricted to the revenue side of the government budget but also include the expenditure generated by the immigrants. Moreover, the calculations will take
account of the long term effects of immigration. This is particularly relevant as immigrants tend to be young when entering the country whereas the costs for government mainly occur at the later stages of life.
These measurements are carried out in two ways. The first of these calculates the present value of the lifetime net contribution of an individual immigrant to public finances. The second way
expresses the aggregate impact of a persistent additional yearly inflow of immigrants on future
public budgets. Both methods, which are basically equivalent, are explained in detail in the next section which describes the methodology we follow and explores the pros and cons of each
method. Section 4.3 will treat the underlying data. Then, section 4.4 presents the results under the benchmark assumptions. Section 4.5 performs a sensitivity analysis and section 4.6
compares the methodology and results of this study with those of other studies. Section 4.7 concludes.
4.2
Methodology The contribution of an individual immigrant The first way of assessing the fiscal impact of immigration is by determining the lifetime net contribution to public finances of an individual immigrant. This way of assessing the fiscal impact is derived from the instrument of Generational Accounting. GA measures the net
59
Immigration and the Dutch Economy: Public sector
lifetime contribution to public finances of an average member of a generation over his or her remaining lifetime. It does this by adding up remaining lifetime burdens from taxation and
subtracting remaining lifetime benefits from public expenditure - both in present value terms.
This methodology can also be applied to measure the net lifetime contribution of an immigrant. A negative balance then implies that, overall, the immigrant constitutes a burden to public
finances and thus to the resident population, a positive balance that he or she has an alleviating effect. This measure of the fiscal impact of immigration provides important information for political decision making.
The basic material for calculating lifetime net contributions to government is formed by the age profile of annual net contributions to the government. The age profile represents the balance of
tax collection and generated expenditure for each age group. Figure 4.1 shows the age profile for the average Dutch resident, the average Dutch resident with a non-Western background and a
‘highly performing’ person. The first two of these profiles are constructed by using the data on
tax collection, claims on social security provisions etc. that apply to both groups. The difference
between these two age profiles, involving a lower contribution of non-Western residents, reflects differences in social and economic characteristics and is mainly the result of differences in
labour market performance (see below). In our assessments, the age profile of the average non-
Western resident will be used as a benchmark as it is in non-Western countries where the main opportunities lie to attract immigrants. This age profile represents the contributions of future non-Western immigrants if they would have the same social and economic characteristics as
their counterparts in the past. However, it will also serve as the lower boundary in the range of
possibilities we explore. This is because (as the results below will show) immigrants with these characteristics turn out to burden public finances whereas our aim is to assess the scope of
immigration to form an alleviating factor to public finances. We will carry out these calculations over a wide range of social and economic characteristics, not only up until the level of
performance of the average Dutch resident, but also beyond that level by including calculations
in which an above average labour market performance is imputed. Figure 4.1 also shows the age profile that we constructed to assess what fiscal impact such ‘highly performing’ immigrants would have. Its imputed characteristics are discussed below.
The lifetime net contribution of an individual immigrant is determined by summation - in
present value terms - of the relevant annual net contributions over the years of their stay in the
Netherlands. For instance, for an immigrant who enters the country at the age of 25 and has the same social and economic characteristics as the present non-Western residents, the lifetime net
contribution is calculated by using the ‘non-Western’ age profile and by starting the summation at the age of 25. For immigrants with average ‘Dutch’ or ‘highly performing’ characteristics we use the corresponding age profile. In these calculations we take account of productivity and
60
Methodology
income growth, and its effect on future (age-specific) tax revenues and expenditure, as well as of mortality and return migration.1
Figure 4.1 Age profiles of net contributions, 2001 1000 euros 20 15 10 5 0 -5 -10 -15 -20 -25 -30
average non-Western average Dutch
-35
highly performing
-40 0
5
10
15
20
25
30
35
40
45
50 age
55
60
65
70
75
80
85
90
95
Budgetary effects of immigration The second way of assessing the fiscal impact of immigration is by establishing its aggregate effects on the future budget balance of the government. These effects can be interpreted as a measure of the contribution of immigration to public finances. A downward effect on future
balances reveals that immigration has a burdening impact on public finances and therefore on the resident population. An alleviating impact is indicated by an upward effect. The aggregate effects are measured by determining how a fictitious inflow of immigrants (a scenario for
additional immigration) would affect the government balance over time. This exercise is carried out by analysing the budgetary effects if the annual net inflow of immigrants is 0.05% of the
total population larger than what it is in the baseline demographic projection.2 This calculation
is carried out by combining the immigrant’s age profile of net contributions (as shown in figure 4.1) with the size and age composition of the fictitious population increase that is generated by
1
Furthermore, these calculations are carried out under the assumption that policies are made sustainable.
Assuming no policy change would ignore the requirement for adjustment at some point in time due to the rising costs of ageing. Indirect taxes are used as the instrument to make policies sustainable. 2
This involves an annual net inflow of 8000 to 9000 people, and an accumulated effect on the total population
that amounts to 1.5 million people after a century. Appendix 3A shows how this additional inflow affects the population through time.
61
Immigration and the Dutch Economy: Public sector
the additional inflow of immigrants. It is important to note that the question whether
immigration alleviates or burdens public finances can only be determined by the long term effect on the balance. The reason for this is that the age composition of the inflowing
immigrants deviates from the age composition of the population increase that this inflow
generates in the long term. As shown in appendix 3A, immigrants are on average young when
they enter the country. Focussing on the short term fiscal impact would therefore lead to biassed results, due to the relatively large proportion of immigrants in the working ages and the relatively small proportion of costly elderly in this group.
This exercise will also include the budgetary effects of the second and third generation of
immigrants. The second generation is assumed to have bridged half of the gap between the labour market performance of the first generation and that of the Dutch average. The third generation is assumed to have fully adopted the ‘Dutch’ characteristics.3
Essentially, both ways of assessing the fiscal impact of immigration use the same basic
methodology. Both are based on the age profile presented in figure 4.1 and include the long term effects of immigration. In fact, they involve only different ways of adding up the same
underlying data. The first way adds up annual lifetime contributions for an individual, thereby discounting future contributions. The second way adds up the individual contributions of the inflow for each year, thereby also taking account of the intertemporal issue by including the
effect on interest payments. It can be shown that in both methodologies the outcome (whether immigration has a positive or negative impact) depends on the same criterion. This exercise is
carried out in appendix 3B. It turns out that also the impact on future budgets hinges on the net lifetime contribution of the (average) immigrant.
The first measure, the net contribution of the individual immigrant, offers the more direct
answer to the question whether immigration forms a burden or a relief to public finances. It offers an instrument to establish the individual characteristics of immigrants with positive
contributions to public finances and can therefore be used for selection purposes. The advantage of presenting the budgetary impact of immigration lies in its concreteness and transparency. It shows the effects on fiscal surpluses and debts (the traditional budgetary measures for
sustainability), and enables us to illustrate the possible divergence between the short term
3
The assumption with respect to the second generation is based on Van Ours et al. (2002). They find that the
labour market position of young persons who are second generation immigrants from a non-Western background is better than that of their parents (the first generation of immigrants) but still lags behind that of the native young. Major determining factors are their level of education as well as that of their parents. Tesser and Iedema (2001) add to this that school performances of youngsters from a non-Western background have improved in recent years and that further improvements may be achieved by government policies.
62
Main underlying data
effects and the long term effects. It can also be used to explore to what extent immigration can alleviate the financial consequences of the ageing of the resident population.
The size of the burden or relief that the inflow of immigrants brings about on the public budget can be expressed in one figure by the change in tax level that matches its effect in present value
terms. This change in tax level, if implemented immediately and permanently and expressed as a percentage of GDP, measures the annualised financial effect of the inflow and therefore provides an insightful measure of its fiscal impact.
4.3
Main underlying data This section explains the main determinants of the difference in age profile between the resident population and the average non-Western resident. Assigning tax revenues to immigrants Government revenues mainly consist of direct taxes, contributions to social transfer
programmes, indirect taxes and corporate taxes. The assignment to immigrants of direct taxes and contributions to social transfer programmes is carried out in a two stage procedure. The first of these ignores differences between immigrants and residents. Future age specific tax
revenues are constructed by assuming that, apart from indexation to productivity, these age
specific revenues remain unchanged. This procedure is carried out for the taxation of various sources of income.4 The second stage modifies the age profiles by taking account of the
diverging characteristics of immigrants. For the non-Western characteristics, this typically
involves lower wage levels and lower participation rates. It also involves lower saving through
pension funds, which leads to lower tax deductible pension premiums and taxed pensions. Table 4.1 reveals these divergencies. On balance, these divergencies translate into lower levels of taxes and contributions to social transfer programmes. The opposite applies to the imputed characteristics for ‘highly performing’ immigrants.
When interpreting the social and economic characteristics (or labour market performance), it is important to know that they do not fully coincide with educational levels (or skills). Data for the Netherlands reveal that the relatively weak labour market performance by the current nonWestern residents can only be partially attributed to educational levels (see chapter 2).
4
These sources are labour income, income from public and private pensions, social security other than public
pensions, third pillar pensions, early retirement benefits and income from capital.
63
Immigration and the Dutch Economy: Public sector
Table 4.1
Divergencies of current non-Western residents and ‘highly performing’ immigrants, relevant for taxation current non-Westerna
average Dutch
Relative labour participation
73
100
110
Relative wage level
71
100
125
Relative second pillar pension (per worker)
42
100
150
Relative pension premium (per worker)
42
100
150
a
highly performingb
These figures are adjusted for age composition. This adjustment is carried out by dividing the figure for the non-Western residents by the
weighted average of the age specific ‘Dutch’ figures in which the non-Western age composition is used as a weight. Sources: (for participation) CBS ( 2001); (for wage levels) Statistics Netherlands, Loonstructuuronderzoek, CBS ( 2000b) and own calculations. These figures are adjusted for differences in age composition between the two groups ; The figures for relative pensions and pension premiums are based on own calculations. These figures apply to a full career. Immigrants are assumed not to have built up pension rights in their country of origin. b
These involve imputed values (see main text).
Tax revenues that are paid from second pillar pension incomes require special treatment. Apart from the wage level during employment, the size of this pension depends proportionally on the number of years worked. Therefore, immigrants who enter the Netherlands at an age over 20 build up a smaller pension. A special treatment is also required for first and second pillar
pensions of immigrants who returned. According to bilateral treaties with most countries of
origin, most of these immigrants are not subject to taxation in the Netherlands. They are taxed in the country of residence.5
Corporate taxes are treated differently. The percentage increase due to immigration is assumed to equal the percentage effect on GDP.6 Accordingly, the assignment of corporate taxes to
individual immigrants is imputed proportionally to their contribution to GDP.7 This way of
assigning taxes focusses on the generated revenue for the government and reflects the fact that it is our intention to measure the effect of immigration on public finances, not to measure how much immigrants themselves contribute to taxes and expenditure.8 Therefore, the age profile
that is imputed for this tax item does not coincide with the immigrant’s age profile of share ownership.
5
An exception is formed by (former) civil servants. This small group is ignored in these calculations.
6
This reflects the assumption of constant return to assets which results from the free in- and outflow of capital in
a small open economy. In turn, GDP is assumed to increase at the same rate as aggregate wages. 7
In turn, the immigrants contribution to GDP relative to that of a resident is assumed to equal the product of
relative labour participation rates and wage levels. 8
In aggregate terms too, there can be a difference between the amount of generated corporate taxes by the
immigrant and the corporate taxes indirectly paid by him as a result of share-ownership. This difference is covered by foreign shareholders.
64
Main underlying data
Figure 4.2 Age profile of generated taxes
1000 euros 30
25
20
15
10
5
average non-Western average Dutch highly performing
0 0
5
10
15
20
25
30
35
40
45
50 age
55
60
65
70
75
80
85
90
95
Figure 4.2, which shows the age profiles of tax collection for the three types of social and
economic characteristics, reveals large differences. For the age groups between 20 and 65, this mainly reflects participation and wage levels. In the case of the elderly, it is the result of
divergencies in incomes from funded second-pillar pensions. It must be noted that tax revenues from second pillar pensions of non-Western residents in this figure reflect a full career in the Netherlands. A shorter career leads to a lower tax on this source of income. Assigning government expenditure to immigrants Two categories of expenditure are distinguished. The first category consists of the expenditures
of which the benefits can be attributed to beneficiaries. This applies to expenditures on
government transfers, education and health care. Analogous to the treatment of government
revenues, the assignment of the benefits to the immigrants is carried out in two stages. The first stage does not take account of differences in the use of these public arrangements between the various types of immigrants. In this stage the current age-specific benefits of the average
resident are used to construct the future age-specific benefits by assuming that - apart from the indexation to productivity - these age specific benefits remain unchanged.9
9
For disability benefits, unemployment benefits and health care a more extended version of this approach is
carried out. These extensions are explained in detail in Van Ewijk et al. (2000).
65
Immigration and the Dutch Economy: Public sector
Table 4.2
Relative claim on expenditure by current non-Western residents and the assumed relative claim for ‘highly performing’ immigrants current non-Westerna
average Dutch
highly performingb
Disability benefits
124
100
80
Unemployment benefits
157
100
80
Social assistance
437
100
80
Individual rent subsidies
284
100
50
Health care
100
100
100
Education-primary
148
100
100
Education-secondary
100
100
100
Education-tertiary
73
100
100
GDP-related expenditure (defence etc.)
52
100
138
a
These figures are adjusted for age composition. This adjustment is carried out by dividing the figure for the non-Western residents by the
weighted average of the age specific ‘Dutch’ figures in which the non-Western age composition is used as a weight. Sources: (for social assistance, unemployment benefits and disability benefits) CBS ( 2002b); (for education) Tesser et al. ( 1999),Ministerie van OcenW (2001), Tweede Kamer (2001b) and own calculations; (for individual rent subsidies)Statistics Netherlands, Woningbehoefteonderzoek 1998. b
These involve imputed values (see main text).
The second stage imputes the deviating claims on these public arrangements. This involves
multiplication by a factor that reflects the differences in the claim on these arrangements. In the case of the current non-Western characteristics, this factor is derived from additional
information from several sources. Table 4.2 reveals the multiplication factors involved for the
expenditure items that show a deviating claim. It turns out that these immigrants draw relatively heavily on government transfers. This applies especially to the individual rent subsidies and
social assistance. The claims for these programmes are, respectively, 2.8 and 4.4 times as high as they are for the average Dutch resident. The claim on education is mixed. Per pupil
expenditure on primary education is 48% higher than average, due to special provisions for
children from a socially deprived background. In contrast, lower enrolment rates lead to agespecific costs on tertiary education that equal only 73% of that of the average resident
population. Relative expenditures in the GDP-related items (defence, general government, etc. (see below)) amount to only 52% of that of the average resident. This reflects the lower
participation rates and wage levels. For the ‘highly performing’ immigrants we impute relative
expenditure levels that, apart from education, are opposite to those of the current non-Western residents.
Return migration calls for a separate treatment of public pensions.10 As residents in the
Netherlands build up a right to public pensions during their stay in the Netherlands, return
10
66
Appendix 3A shows that return migration is high for non-Western residents.
Main underlying data
migration leads to additional expenditures that are not dealt with by the methodology described above. Our calculations take account of this by imputing additional expenditure on public
pensions.11 Finally, we include the costs of courses that intend to facilitate integration in the
Netherlands (‘inburgeringscursussen’). These costs are assigned to immigrants who are older
than the school going ages and amount to 7000 Euros per person. We do not include the costs of the procedure involved in the decision whether or not to allow asylum seekers into the Netherlands, nor their costs of living.
The second category consists of the expenditures that can not be directly attributed to
beneficiaries. This category consists of expenditures on defence, general government, transfers abroad and subsidies. In long term projections of CPB (see Van Ewijk et al. (2000)), aggregate expenditures on these items are assumed to grow at the same rate as GDP. This reflects past developments. Correspondingly, it is reasonable to impute that immigration leads to a
percentage increase of expenditure on these items that equals its percentage effect on GDP.
These expenditures are accordingly assigned to immigrants by linking them proportionally to
their contribution to GDP. The resulting distribution over age groups therefore equals the shape of the contribution to GDP. Moreover, the assigned age specific level of expenditure depends on the immigrant’s contribution to GDP relative to that of the average resident. Consequently, the expenditure levels assigned to these groups shows differences due to deviating effects on GDP which in turn are the result of different levels of labour participation and wages.
Figure 4.3 reveals the age profile of total expenditure for the three types of immigrants described above. For children of primary school age, the expenditure on those from a non-Western
background is higher than that of the average resident. In contrast, it is lower during the ages of tertiary education. It is also lower in the working (middle) stage of life, due to the relation in the assignment of non-attributable items with the contribution to GDP. This factor turns out to outweigh the higher claim of non-Western residents on government transfers. Except for
education, the ‘highly performing’ profile shows the opposite characteristics. Figure 4.1, which combines figures 4.2 and 4.3, represents the net contribution for the three types.
11
The pension of a returning immigrant depends proportionally to the length of residency in the Netherlands
between 15 and 65 year of age. This expenditure item is derived by taking account of the age of entering the Netherlands, the (age specific) chances of return migration and survival fractions.
67
Immigration and the Dutch Economy: Public sector
Figure 4.3 Age profile of assigned expenditure 1000 euros 50 45 40 35
average non-Western average Dutch
30
highly performing 25 20 15 10 5 0 0
4.4
5
10
15
20
25
30
35
40
45
50 age
55
60
65
70
75
80
85
90
95
Results The lifetime contribution of the individual immigrant Figure 4.4 presents the present value of the lifetime net contribution of an average immigrant at various ages of entering the Netherlands. We impute four combinations of social and economic
characteristics. The first uses those of the current average non-Western residents; the second
takes the average characteristics of the non-Western and ‘Dutch’ residents; the third uses the
characteristics of the average ‘Dutch’ resident, and the fourth assumes characteristics that exceed those of the average resident.12
For all types of immigrants, the outcome is most favourable for the immigrants who are 25 years
of age at the time of entry to the Netherlands. Immigrants entering at this age do not increase
costs for education and yet have the relatively favourable ‘middle ages’ in front of them. The
expensive ‘old’ stage of life is still far away and therefore weighs less heavily in present value
terms. However, it turns out that if the immigrants have the social and economic characteristics of non-Western residents even this age group carries a negative contribution (of around 43,000 Euros) to public finances. For the younger immigrants, the costs of education form a large 12
In all calculations we assume the probabilities of return migration that apply to the current non-Western
residents. Survival fractions are assumed to equal those of residents. The calculations are carried out by using a discount rate of 4% in real terms and a productivity increase of 1.75%. The interest rate on government debt is assumed to be equal to the discount rate.
68
Results
burden. The net costs of an average “newborn” amount to about 95,000 Euros. For immigrants
who are older than 25 when entering the Netherlands, the results deteriorate gradually and reach a negative value of roughly 110,000 Euros at the age of 50.
Immigrants whose social and economic characteristics resemble more those of the Dutch
average perform better. If these characteristics are half-way between the non-Western and
‘Dutch’ residents, only those entering between the ages of 22 and 32 actually show a small
positive contribution. If the characteristics coincide with those of the average Dutch residents,
the outcomes are positive for a very wide range of entry ages, notably 14 to 45 years of age. When the immigrant is under 14 or over 45 years of age at entry, however, the result is still negative. Immigrants whose characteristics are more favourable than those of the average resident population show a wider range of positive outcomes.
To put these results into perspective, it should be noted that also the newborn of the resident
population feature negative net lifetime contributions, even in sustainable scenarios. This level is marked on the vertical axis and equals minus 18,000 Euros.13 On average, current Dutch collective arrangements thus generate a net benefit over one’s whole lifetime. The negative
impact on public finances if the immigrants have the social and economic characteristics of the
non-Western residents is thus not fully the result of a lagging performance. It is partly due to the generous system of collective arrangements, which leads to lower net contributions for residents as well as for immigrants.
This favourable system of sustainable collective arrangements results from the fact that, in
terms of present values, the projected net contributions of the currently living generations over their remaining lifetimes is positive and exceeds the balance of net government debt14 and the
present value of revenues from natural resources. This result implies that the current newborn and the future generations are left with a (positive) bequest that allows their lifetime tax contributions to fall short of fully covering the expenditure that they generate.15
13
The net lifetime contribution of a native newborn does not coincide with that of a newborn immigrant with
average Dutch characteristics because immigrants feature a (relatively high) probability of return migration. The effects of return migration on lifetime contribution is analysed in section 4.5. For immigrants entering at the working ages there are two additional differences. The first of these are the costs involved in the courses that intend to facilitate integration. The second is that these immigrants build up a smaller pension and thus contribute less to the public coffers when they reach the age of retirement. 14
Net government debt is defined as government debt minus the present value of revenues from financial assets.
15
Storesletten (2000), Storesletten (2003) and Bonin et al.(2000) also find negative lifetime contributions for
native newborns for respectively the United States, Sweden and Germany.
69
Immigration and the Dutch Economy: Public sector
Figure 4.4 Net lifetime contributions to public finances as a function of the age at entry 1000 euros 200
150
100
50
0
-50 average non-Western average non-W./Dutch
-100
average Dutch highly performing
-150 0
5
10
15
20
25 age at entry
30
35
40
45
50
Figure 4.4 also provides the opportunity to assess the effects of the immigration of families. A
few examples are worked out here. The first is a family with a husband and wife aged 25 and the characteristics of the non-Western immigrants. The family has two children, aged 0 and 5,
whose characteristics correspond to the average of those the Dutch and non-Western residents.
It can be calculated from the data in figure 4.4 that the family carries a negative net contribution of 230,000 Euros (minus 43,ooo Euros for each of both parents and minus 68,000 Euros for the 0 year old child and minus 76,000 Euros for the 5 year old child) and thus forms a
substantial burden to public finances. Even if the parents have the average of the non-Western
and Dutch characteristics, and the children have the ‘Dutch’ characteristics the total lifetime
contribution is negative (minus 48,000 Euros). A positive contribution requires that the social
and economic characteristics of the family of immigrants almost fully equal those of the average
Dutch residents. If all members of the family have the Dutch characteristics the total lifetime contribution amounts to 76,000 Euros, and if the parents are ‘highly performing’, the contribution rises to 226,000 Euros.
What is the composition of the net contributions of figure 4.4? Table 4.3 works out a number of
selected cases. It shows that the differences in social and economic characteristics mainly affect
the revenue side of the budget. This reflects the differences in labour participation, income and,
as a result, in tax revenues. The age of the immigrant has an important impact on the outcome on both the revenue and the expenditure side of the government budget. If the immigrant has
the age of 25, all budget items except education have a larger impact than if he or she is aged 0.
70
Results
This results from the fact that tax revenues and the bulk of expenditure are not as far away in the future and are thus discounted less heavily. The fact that the 25-year old scores better than the newborn is largely due to the saving on expenditure on education. Table 4.3
Composition of net contributions, with non-Western and ‘Dutch’ characteristics (thousands of Euros)
Age of immigrant at entry
0 years Characteristics non-Western
Revenues
25 years average Dutch
non-Western
average Dutch
96
164
215
368
191
202
258
292
health and care
26
26
43
43
education
54
49
0
0
transfers
63
48
120
84
GDP-related
48
79
95
165
S 95
S 38
S 43
76
Expenditure of which:
Total net contribution
It should be noted that the results presented above are sensitive for the (inevitably arbitrary) way the pure public goods (defence, etc.) are assigned. Our approach, which assigns values that correspond to the contribution to GDP, deviates from the way this is done in other studies.
Storesletten (2000 and 2003) and Bonin et al. (2000) assign equal values to all residents, either
immigrant or native. This approach would lead to lower net contributions for those immigrants that have weaker characteristics than the natives and higher contributions for those with better characteristics. Another approach could be to assign values that intend to capture the benefit from these expenditures. This would require an indicator of benefit levels.
The negative net contributions we find for the non-Western residents reflect a net benefit for this group. To a large extent this net benefit is a result of the system of social security in the
Netherlands. This system may have additional effects as Borjas (1999c) suggests that countries with generous welfare systems tend to attract migrants that are likely to become dependent on the welfare state provisions, which makes the welfare system more costly. This introduces a trade-off between immigration policies and the generosity of the welfare state. Budgetary effects of immigration Figure 4.5 reveals the effects on the budget balance through time of an additional net inflow of immigrants that equals 0.05% of the population and has the same age composition as the
present inflow. We impute the same type of immigrants we used for the calculations of the lifetime contributions. It turns out that public finances improve only if the economic
71
Immigration and the Dutch Economy: Public sector
performance of immigrants at least equals that of the average Dutch resident. Even in this case, however, the alleviating effect is marginal.16 A substantial improvement is achieved only if the
immigrants are of the ‘highly performing’ type. Figure 4.5 Effect of immigration on the budget balance % GDP 4
2
0
-2
average non-Western
-4
average non-W./Dutch average Dutch highly performing
-6 0
5
10
15
20
25
30
35
40
45
50 years
55
60
65
70
75
80
85
90
95
The upper row of table 4.4 shows how the inflow of immigrants, in the quantity and age
composition as described above, affects the (immediate and permanent) budgetary adjustment
that is required to arrive at a sustainable system of public arrangements. It turns out that if the immigrants’ characteristics are equal to those of the present group of non-Western residents, this measure of budgetary unsustainability is raised by 0.34% of GDP. If the characteristics
correspond to those of the average Dutch residents, the effects are negligible.17 The budget is
alleviated only if the immigrants outperform the Dutch residents on the labour market. The last
column shows that an inflow of ‘highly performing’ immigrants, with the characteristics as were outlined in section 4.2, reduces the required adjustment by 0.22% of GDP. As recent
calculations18 pointed out that a budgetary adjustment up to 1.8% of GDP is required to arrive at
16
This small positive outcome is the net result of a positive net contribution of the first generation of immigrants
and almost as large negative net contributions of their offspring (the second and third generations). The latter fact reflects the feature, which was discussed above, that Dutch collective arrangements result in negative net contributions over one’s whole lifetime. 17
Knaap et al. (2003) also find only small favourable effects for an inflow of immigrants with ‘Dutch’
characteristics. 18
72
see CPB (2003).
Sensitivity analysis
a sustainable system of public arrangements, this indicates that immigration can not be considered to form a major possibility to alleviate public finances. Table 4.4
Effects of 0.05% annual immigration under various types of immigrants type of immigrant current non-Western
average nonWestern/Dutch
average Dutch
highly performing
0.18
S 0.01
S 0.22
%GDP Effects on required adjustment
a
0.34
effects on required lifetime contribution of residents (present values, thousands of Euros) Age of resident b
Unborn generations
2.3
1.2
0.0
0-year olds
2.3
1.2
0.0
S 1.8
20-year olds
3.4
1.8
S 0.1
S 2.5
40-year olds
2.4
1.2
S 0.1
S 1.8
60-year olds
0.8
0.4
0.0
S 0.6
80-year olds
0.2
0.1
0.0
S 0.2
a
S 1.8
This is the difference between the required budgetary adjustments with and without immigration. The adjustments in this exercise take place
through an increase of indirect taxes. b
The effects of the unborn (future) generations are adjusted for the rise in lifetime income.
How these results affect the lifetime wealth of the resident population is presented in the lower part of table 4.4. These effects are measured by the present values of the additional lifetime tax
burden involved in the change of the required budgetary adjustments. If the flow of immigrants has the social and economic characteristics of the present non-Western residents, there are
substantial effects. In this case, for example, a 20-year old resident is faced with an additional lifetime tax burden of 3,400 Euros. If the inflow has the same characteristics as the average
Dutch residents, the effects are negligible. In contrast, ‘highly performing’ immigrants would reduce the lifetime tax burden of the resident population.
4.5
Sensitivity analysis The results of the calculations that were presented above depend on a number of assumptions. This
section investigates the influence of two of these assumptions, the discount rate and the rate of return migration.
A 1% lower discount rate A sensitivity analysis on the impact of the discount rate seems especially justified because of the importance of intertemporal considerations in these calculations. This follows from the age
73
Immigration and the Dutch Economy: Public sector
profile of net contributions which was presented above. Figure 4.6 presents the net lifetime
contributions of immigrants if the calculations that are carried out with a 1% lower discount rate (i.e a rate of 3%).19 The net lifetime contributions are then generally lower than in the base case (which was presented in figure 4.4). The main reason for this is that if interest rates are lower, pension funds need higher pension premiums to cover their future liabilities. These are deductible for income taxation and therefore burden the government budget.
Figure 4.6 Net lifetime contributions as a function of the age at entry under a 1% lower interest rate 1000 euros
average non-Western
200
average non-W./Dutch average Dutch highly performing
150
100
50
0
-50
-100
-150 0
5
10
15
20
25 age at entry
30
35
40
45
50
Figure 4.7 presents how annual immigration of 0,05% of the population affects the budget
balance through time under the 1% lower interest rate. It shows results that are similar to those of the base case, which was presented in figure 4.5.
19
74
A sensitivity analysis with a 1% higher interest rate leads to ‘symmetrical’ results.
Sensitivity analysis
Figure 4.7 Effect of return migration on the budget balance by age of entry under 1% lower interest rate % GDP 3
2
1
0
-1
-2 average non-Western average non-W./Dutch
-3
average Dutch highly performing
-4 0
5
10
15
20
25
30
35
40
45
50 years
55
60
65
70
75
80
85
90
95
No return migration The extent of future return migration is an unknown factor. In the calculations above it was
assumed that immigrants will behave in the same way as the present non-Western residents. This may change, and it may therefore be interesting to measure its influence on the main
outcomes. This sensitivity analysis can also serve as a measure of the financial attractiveness of a policy line of stimulating or reducing return migration.
Figures 4.8 and 4.9 compare the net lifetime contributions of immigrants - if no return
migration is assumed - to those in the baseline. Figure 4.8 performs this exercise under the
assumption that immigrants have the same social and economic characteristics as the average non-Western residents. Figure 4.9 assumes that they have the ‘highly performing’
characteristics. The figures show that the social and economic characteristics are an important factor in determining whether return migration yields positive or negative results for public
finances. For all age groups, the result is positive if the immigrants have the characteristics of
the present non-Western residents. A prolonged stay in the Netherlands is unfavourable to the
budget due to their negative lifetime contribution. In contrast, up to the entry age of 43, a longer
stay alleviates public finances if they have the ‘highly performing’ characteristics. This follows from the positive lifetime contribution over a wide range of ages at entry.
75
Immigration and the Dutch Economy: Public sector
Figure 4.8 Effect of return migration on lifetime contributions under non-Western characteristics 1000 euros 0 -20 -40 -60 -80 -100 -120 no return migration
-140
present probabilities
-160 0
5
10
15
20
25 age at entry
30
35
40
45
50
Figure 4.9 Effect of return migration on lifetime contributions under ‘highly performing’ characteristics 1000 euros no return migration
250
present probabilities 200
150
100
50
0
-50 0
5
76
10
15
20
25 age at entry
30
35
40
45
50
Comparison with other studies
4.6
Comparison with other studies The literature on the fiscal impact of immigration shows a variety of ways in which these studies are carried out. This section deals with these differences in methodology and briefly discusses their pros and cons. It will also discuss the outcomes of the studies with respect to the attractiveness of immigration for the resident population.
At the least, the following differences in methodology can be summed up: •
The focus on the fiscal effects at one moment in time (static approach) versus the exploration of the long run effects (dynamic). As stated above the long run perspective is preferable as the effects of
immigration may show changes through time due to shifts in the skills and age composition of the immigrant population. However, it has a drawback in that it requires assumptions about
•
future developments;
The presentation of the effects of immigration on (future) government budgets versus the presentation of net lifetime effects of individual immigrants in terms of present values. Both use the age-specific net
tax contributions and are thus equivalent because they sum up the same underlying data. Both
forms of presentation have advantages. The determination of the net lifetime contribution of the individual immigrant has the quality of being the direct measure of the immigrant’s
contribution to public finances and may therefore be used for selection purposes. On the other side, future budgets are more concrete, which can be helpful in the presentation to policy •
makers, and may facilitate the distinction between short term effects and long term effects; The allowance for diverging social and economic characteristics of immigrants (skills) versus the assumption that immigrants have the same characteristics as natives. It is obvious that taking
account of the immigrants characteristics is more realistic and offers the better measure for •
•
their fiscal effect. It also enables the study of selection criteria.
The inclusion of behavioural responses to immigration and possible tax rate changes versus no such
feedbacks. The first approach, which requires a general equilibrium model, obviously offers the more complete analysis;
The distinction of males and females and between generations (first, second and third) within the
population of immigrants versus no such distinctions. Introducing these distinctions opens the
possibility of differentiating skills and fiscal impact. However, as information on the economic performance of the second generation is scarce, this differentiation may have to be made by
assumption. Ignoring the distinction by gender has the drawback of not capturing the effects of possible future changes in the gender composition of immigrants, due, for instance, to
reuniting families. However, for selection purposes this distinction may not be of practical value as such policies can be considered discriminatory.
77
Immigration and the Dutch Economy: Public sector
•
The treatment of the expenditure types of which the benefits are not clearly attributable to specific beneficiaries (general government, defence etc.) can also differ. This assignment is inevitably
arbitrary and there may be no single best way to do it. As was discussed above, the preferred way depends on the aim of the exercise. The measurement of the effect on fiscal sustainability may require a treatment that differs from the measurement of the benefits from immigration. Our study scores well on a number of these issues. It explores the long-run effects of
immigration, measures both net lifetime contributions as well as the long-run budgetary effects, allows for diverging characteristics of immigrants and, through imputing assumptions,
distinguishes between generations of immigrants. Compared to many of the other studies, it also has the advantage of being more explicit about the treatment of the non-attributable
expenditure items. However, this study does not take account of behavioural feedbacks and disregards gender issues.
There are several studies for the United States that measure the fiscal impact of immigration.
Storesletten (2000) uses a calibrated general equilibrium overlapping generations (CGE) model.
As in our study, he takes account of the skills of the immigrants. He concludes that immigration can have a substantial alleviating effect on public finances, provided that they are selected by age and skill. Even if no selection takes place immigration has a positive, though small, effect. Compared to our study, these results show a far greater scope for immigration to be an alleviating factor. Smith and Edmonston (1997), who calculate present values of net
contributions, reach a similar conclusion. The major reason for this may lie in the fact that, on average, the labour market performance of immigrants to the US does not deviate much from that of natives whereas our study shows a large difference in labour market performance. A
further reason lies in the more developed welfare state in the Netherlands and the large use of it
by immigrants. However, this is compensated by the lower attribution of the purely public goods (general government, defence, etc.) which in our study is related to the contribution to GDP.
Like our study, Auerbach and Oreopoulos (1999) use the technique of Generational Accounting to assess the impact of immigrants and distinguish between immigrants and residents on the
basis of data on these groups. With respect to the fiscal effects, they roughly come to the same conclusion as Storesletten. Their analysis is extended further by distinguishing gender and by investigating how a delay of the required fiscal adjustment would affect the relative burden of ageing borne by immigrants and residents.
Sinn and Werding (2001) investigate the fiscal effect for Germany on an annual basis and
conclude that, on balance, it was negative for 1997. They present positive contributions for
immigrants who reside in Germany for more than 25 years but conclude that, as shorter stays
78
Comparison with other studies
are typical for European migration, the welfare system artificially enhances immigration to Germany. Bonin et al. (2000) and Bonin (2001) explore the long run effects by using the technique of Generational Accounting. These studies conclude that immigration can
substantially alleviate the fiscal burden of the native population. This applies also if the
immigrants’ labour market performance is assumed to correspond to that of the current
migrant residents. This results from the favourable demographic structure of immigrants, consisting largely of age groups with positive lifetime contributions, and the fact that
immigration raises the number of future tax payers, thereby spreading the existing implicit debt. These circumstances do not explain the differences with the outcomes of our study as these
factors also apply to the Netherlands. The difference rather lies in two other factors. The first is that net lifetime contributions of immigrants in Germany do not lag as much behind those of natives as they do in the Netherlands. This reflects the relatively better labour market
performance and the fact that public pensions in Germany are related to past earnings, thereby partially undoing past differences in taxation, whereas they are a flat rate basic provision in the
Netherlands. The second factor lies in the minimum labour market performance that is required for an immigrant to be alleviating to public finances. According to the calculations for Germany the level of performance of immigrants, which falls behind that of natives, suffices. In the
Netherlands in contrast, it turns out to take at least the native performance. However, it must be noted that this difference in minimum requirement may (partly) originate from a difference in methodology. Public consumption (general government, defence, etc.) in the studies for
Germany are attributed in equal values to all residents, either native or migrant and irrespective of age. In our study, it is related to the contribution to GDP, and thus dependent on labour market performance and concentrated in the working stages of life.
Storesletten (2003) uses an overlapping generations model to assess the fiscal impact for Sweden. His results are similar to ours in that they suggest that immigrants impose a
substantial fiscal burden. However, unlike us, he finds that young immigrants still represent a large fiscal gain.
Moscorola (2001) uses Generational Accounting to assess the impact of immigration for Italy.
This study reaches the conclusion that immigration is alleviating to the budget. It measures this effect by the reduced tax rate required to meet the intertemporal budget constraint. This
measure is also used in our study. Ablett (1999) uses Generational Accounting for Australia.
Though he includes the favourable age-distribution effect, his calculations ignore differences in the social and economic characteristics. He finds the long term effect of immigration to be positive.
79
Immigration and the Dutch Economy: Public sector
Knaap et al. (2003) investigate the effects of immigration for the Netherlands by using an
overlapping generations model. This enables the inclusion in the analysis of changes in wages and interest rates. The study analyses the effects on the economy and public finances of the
admission of an inflow of immigrants that is selected by age. Also, their analysis is restricted to immigrants with skills that are equal to those of the resident population. Generally they
conclude that, even with these (relatively favourable) characteristics of immigrants, the resident population benefits only marginally. Wage rates show small changes and the government budget improves only slightly. This latter finding coincides with our result for this type of immigrants.
None of the above studies presents the effect of immigration on future budget balances. Also,
except for Bonin et al. (2000), none is very clear about the treatment of expenditure items that can not be attributed directly to beneficiaries.
4.7
Conclusions This chapter assesses the effects of immigration on public finances. It does this by calculating the net lifetime contributions of immigrants and their effects on future budget balances. We conclude that: •
•
•
•
The fiscal impact of an immigrant depends very much on his or her age at entry and social and economic characteristics (labour market performance). The outcomes are most favourable for the immigrants who are 25 years of age at entry and perform well on the labour market.
For all entry ages, however, immigrants turn out to be a burden to the public budget if their social and economic characteristics correspond to those of the present average non-Western resident. Accordingly, budget balances are affected negatively.
This average negative contribution of immigrants is not fully the result of a lagging
performance. It is partly also the reflection of the generous system of Dutch collective arrangements.
If the social and economic characteristics fully resemble those of the average Dutch resident the
result is positive for entry ages between 14 and 45 years. On balance, an inflow of immigrants of this type which has the same age composition as the present inflow would have small positive
•
•
effects.
Immigrants who perform better on the labour market than average Dutch residents alleviate public finances over a wide range of entry ages. Accordingly, an inflow of such immigrants would positively affect the budget balance.
The difference in fiscal impact between the various types of immigrants originates mainly from the revenue side of the budget.
80
Conclusions
•
The results are relatively robust for the assumption with respect to the interest rate and the level
•
The results presented in this study are more negative about the fiscal impact of immigration
of return migration.
than comparable studies for most other countries. Compared to the results for the United States
and Germany, the differences mainly originate from the fact that labour market performances of immigrants in these countries do not lag as much behind those of natives as they do in the •
Netherlands.
The results indicate that immigration can not offer a major contribution to alleviate public
finances, and thus to become a compensating factor for the rising costs for government due to the ageing of the population.
81
Immigration and the Dutch Economy: Physical environment
82
Introduction
5
Physical environment
5.1
Introduction Immigration increases population density. This affects land use, as more space will be needed
for housing, employment, transport and so on. In countries where land is abundant this is not
likely to be a matter for concern. That may be the reason why the subject does not appear in the international literature on the economic impact of immigration. This literature refers mainly to
traditional immigration countries like Australia, Canada, New Zealand and the United States, all sparsely populated countries (see figure 5.1). In contrast, the Netherlands is the most densely populated of the Western countries, as listed in figure 5.1. It should be noted that, unlike the
Netherlands, many countries, and in particular the traditional immigration countries, include
large areas such as deserts, mountains and tundras that are less fit for human habitation. Taking this into account would lead to less striking differences, though the general pattern is likely to
remain the same. There would thus seem to be some grounds for exploring the possible impact
of immigration on the physical environment and the related economic consequences. Figure 5.1 Population density in persons per square kilometre
Australia Canada New Zealand Finland Sweden United States Ireland Spain Greece Austria Portugal France Denmark Luxembourg Italy Germany United Kingdom Belgium The Netherlands 0
100
200
300
400
500
Source: 1999 CIA World Factbook
83
Immigration and the Dutch Economy: Physical environment
Unlike the chapters on the labour market and the public sector, this chapter cannot sail by the
compass of the international literature. This investigation will thus be limited to a rough outline •
the availability and price of land as a factor of production;
•
negative external effects mainly related to congestion and the environment.
•
5.2
of the effects that might occur, and will explore three kinds of effects:
economies of scale associated with a high density of economic activity;
Land as a factor of production A high population density does not necessarily imply that the accommodation of spatial claims
brought about by additional immigration is problematic. As is shown in figure 5.2, over twothirds of all land in the Netherlands is used for farming. Given the current perspective for
agriculture, this land could serve as a buffer to absorb an immigration shock without too much
cost. However, particularly in the densely populated Western part of the country, urbanisation is increasingly competing with other interests, such as recreation and nature (see box). Additional
immigration will exacerbate this competition, even more so as its impact will be felt particularly
in the urbanised Western part (Jansen et al., 2001). This competition may affect the price of land available for non-agricultural purposes. Recently, the issue of the fixed amount of land was raised by Hartog (2002a, 2002b).
Figure 5.2 Land use in the Netherlands (1996)
forest 9.5% built-up area 9.4%
natural landscape 4.1% transport 4.0% recreation 2.4% other 1.1%
farming 69.4%
Source: Statistics Netherlands
84
Land as a factor of production
Making space, sharing space “Increasing prosperity leads to more claims on material consumption and land.” “Many inhabitants of the Netherlands think that the country is getting more crowded, polluted and monotonous than it used to be. They perceive this to be a decline in their well-being and environment.”
“The rapid changes in recent years are likely to continue for some time to come, along with a steadily increasing need for
space for housing, employment, infrastructure, recreation, water and nature. Agriculture, on the other hand, will require less space. It is becoming increasingly difficult to meet all these needs without damaging spatial quality.”
Source: Fifth National Policy Document on Spatial Planning 2000/2020 (Ministerie van VROM, 2001)
Classical economics usually deals with three factors of production: labour, capital and land. In this concept, land is customarily associated with its use for agricultural production. If the amount of land is fixed, and labour and capital are growing at the same rate, what rate of
economic growth can be expected? As long as land is abundant, it may be neglected as a factor of production, and we may expect the economy to grow at the same rate as labour and capital
(constant returns to scale), or perhaps even at a higher rate due to ‘economies of scale’ (see also section 5.3).
At some point along this growth path, however, the fixed amount of land may start to become a binding constraint, in the sense that it will lead to decreasing returns to scale, where ‘scale’
refers to the amount of labour and capital. This is all textbook economics, but the real question is: will decreasing returns to scale due to scarcity of land apply to the Netherlands in the years ahead? On the one hand, in our post-industrial society the availability of land for agricultural
purposes seems to be less vital for a flourishing economy than it used to be. On the other hand, economic expansion implies that more space is needed for company premises, infrastructure
and residential structures; current spatial planning constraints imply that meeting these claims cannot be taken for granted. The most desirable locations have become subject to distribution.
Whether this will lead to decreasing returns to scale remains uncertain, but we will assess in an informal manner how this may affect the economy, if it does occur.
Let us assume that the amount of land is fixed, while labour supply increases through
immigration. Furthermore, we assume capital to be perfectly elastic, and the rate of return to
capital to be determined by the international capital market. The labour market is supposed to clear. An increase in labour supply brought about by immigration will (due to the fixed
production factor land) lead to a less-than-proportional increase in production. This implies a
85
Immigration and the Dutch Economy: Physical environment
decrease in labour productivity. How will the income of the resident population, in this setting, be affected by an immigration shock? By analogy, the simple model presented in figure 3.1 in
chapter 3 can be used (replacing capital by land) to argue that resident workers will experience
lower wages, while the owners of land will collect a higher income. Given a fixed rate of return on investment, this will lead to a rise in prices of land and real estate. If landowners are
residents, there will be an ‘immigration surplus’; this implies that, though there is an income shift from workers to landowners, the total income of residents will increase. However, this
increase may turn into a loss if some of the land is owned by foreigners. To conclude: despite a
drop in labour productivity, the income of residents may not decrease. But this is possible only if there is a shift in income from wage earners to landowners.
5.3
Economies of scale A higher density of economic activity related to immigration may lead to economies of scale in
production. Average fixed costs (for instance, those related to research and development) may decrease if large quantities are produced. Furthermore, a higher density of economic activity
leads on average to shorter lines of communication. This may further reduce costs, including those of transportation and travel time. These effects may explain why concentration of
economic activity in large agglomerations is an omnipresent pattern of spatial dispersion. Further theoretical explanations can be found in Fujita, Krugman and Venables (1999).
5.4
Negative external effects In his foreword to the study of Kooyman and Van der Pas (1972), former CPB director Van den Beld stated, “The fact remains that harmful external effects arise from the dense population, particularly in view of the concentration of foreign workers in the Western Holland
Conurbation, owing among other things to the pressure on physical space. These effects cannot adequately be neutralised by technical measures, and it is difficult to quantify them.” More
recently, Van Egmond (2002) discussed the negative environmental impact of encouraging additional immigration to alleviate the ageing problem.
Some effects associated with increasing population density and related economic activity are
•
traffic congestion
•
loss of open space, landscape and nature
•
pollution
In case of a major population shock caused by additional immigration, traffic in general may
become more congested, the environment may get more polluted, and so on. These ‘external
86
Conclusions
effects’ impact the welfare of the resident population. Some references on these external effects of immigration, albeit of a theoretical nature, are Beck(1996) and Clarke and Ng (1993).
The question might arise whether these external effects really matter. It should be noted, however, that the magnitude of these effects is not always proportional to the size of the
population, as some of the mechanisms involved are characterised by non-linearities. From
traffic engineering we learn that if the volume of traffic approaches road capacity, travel time
increases at an accelerating rate. Pollution of potentially dangerous substances may be relatively
harmless if their concentration is not too high, but above a certain threshold value (‘critical load’) they will seriously damage public health or nature. These examples show that, potentially, relatively small changes in population may have a considerable impact on the physical
environment. It remains, however, difficult to determine to what extent population and associated economic activity may still increase before serious effects are to be expected.
Congestion, pollution and loss of open space may lead to a waste of time, health problems and a loss of quality of life in general. Some empirical estimates with respect to transport are given in INFRAS/IWW (2000). For instance, the marginal external costs of 1000 passenger kilometres additional road transport in urban areas are estimated to amount to 113 Euro. It goes without
saying that such effects will hurt welfare. There may be a direct negative impact on the economy, as has been shown in empirical studies (see, for instance, Van Ewijk and Van Wijnbergen,
1995). In principle, these effects can be avoided– either by financial incentives such as ‘road pricing,’ or by investment in infrastructure, pollution control, nature reserves and so on.
However, the cost of such investment will not always rise proportionally with population
density, due to the non-linearities mentioned above. An increasing share in national income may be needed, therefore, to compensate for these external effects; this will harm welfare.
5.5
Conclusions This chapter assessed how increasing population density brought about by immigration might •
•
affect the economy. We come to the following conclusions:
accommodating an increasing population and associated economic activity, given a fixed amount of land, may have a negative impact on GDP per head, but not necessarily on the average income of the resident population;
the further population density increases, the more economies of scale are likely to be
outweighed by negative external effects related to such phenomena as traffic congestion, pollution, and loss of open space, landscape and nature.
87
Immigration and the Dutch Economy: Physical environment
88
General discussion
6
Policy implications
6.1
General discussion The central policy question in the last chapter of our study is: “How and when to open the door to migrants?” (The Economist, 2002). Given the focus of this study on the economic impact in
the country of destination, we can come up with relevant material, but not with definite answers. Policy makers also take into account non-economic considerations and may even look beyond the interests of their own country. It is their task to assign weight to these different elements and make decisions.
From The Economist (2002) we quote: “On balance, host countries benefit only slightly from
immigration, whereas immigrants benefit hugely” and “You cannot simultaneously have free immigration and a welfare state” (Milton Friedman). These statements, taken together,
constitute a concise summary of the discussion in the previous chapters of our study. According to our findings, total benefits are at best small, but some groups win, while others lose. If the
migrants do not find their way into the labour market and become dependent on social transfer programmes, the taxpayer will lose. Employees with skills competing with those of migrants lose, while those with complementary skills win. Employers are also winners, at least in the
short run. Furthermore, migrants, in particular those from non-western countries, will be clear winners. In most of these countries the standard of living is likely to remain far behind.
Consequently, the authorities in the Netherlands, like other Western-European countries, are
facing continuous pressure from potential immigrants supported by interested parties at home, such as employers, to “open the door to immigrants”.
From a national perspective, the question may be how to deal with immigration pressure while
at the very least avoiding losses for the host country - and if possible realizing gains. A necessary condition would be that immigrants do not rely too heavily on welfare state provisions. It will be clear that any successful policy will be restrictive as regards access to the country or its welfare arrangements. One way to achieve this is selectivity with respect to the economic potential of
immigrants. These ideas will be further explored in the next sections. We discuss the pros and cons of labour migration and review various systems of labour migration. However, we start
with an assessment of family and asylum related immigration, which has, due to its size and composition, a considerable economic impact as well. We conclude this chapter with some
remarks on the shaping of a European immigration and asylum policy which has been under construction since the Amsterdam Treaty of 1997.
89
Immigration and the Dutch Economy: Policy implications
6.2
Family migration and asylum Family reunion, family formation and asylum, taken together, have been accountable for the majority of Dutch immigration in recent years. Economic criteria do not play a role in the
admission of these immigrants, which is largely based on the rules set out in international
agreements. We estimate that these immigrants and their children born in the Netherlands
form the majority of the present population of non-Western immigrants. As we have seen in
chapter 2, the average employment rate of this population is well below the national average, and its dependency on social transfer programmes above average.
Economic self-reliance may be improved by introducing stronger incentives - financial and legal
- for the immigrants to integrate. It seems also worthwhile to investigate what we can learn from other countries in the EU. As shown in chapter 2, most of these countries seem to do better, at least judged from the employment rates of immigrants. In integration policy, attention should
also be given to the second generation, where the education system plays a crucial role; there is room for some optimism here (Tesser and Iedema, 2001).
In the Netherlands, immigrants entering the country through the family and asylum channels are issued a temporary residence permit first, which may not be renewed if the grounds for
admission cease to exist, for instance due to a divorce (family migration) or a regime change in the country of origin (asylum). However, after three years, the temporary permit is converted into a permanent one, which can only be denied for a limited number of reasons, such as a
recent criminal record. Recently, changes were initiated to extend this period to five years in case of asylum. The right to an almost automatic conversion, after a couple of years, of the temporary residence permit into a permanent one, implies full and practically lifelong eligibility to welfare state provisions upon conversion.
It should be noted that issuing a permanent residence permit is not required by the
international agreements mentioned above. These provide for family life or protection, not
necessarily permanent immigration. The practice of automatic conversion is not in accordance with the principle of selectivity. This was implicitly recognized by the authorities, when they decided to introduce the condition that an inburgering programme has to be successfully
completed as a first step towards integration (see chapter 2). This is expected to provide an incentive for immigrants to make a start with the integration process. The principle of
conditional conversion being adopted, further conditions, such as a record of economic selfreliance, may also be considered. This type of regulation may interfere with the shaping of a European policy with respect to immigration and asylum. The national authorities should
90
Labour migration
therefore be alert in the European negotiations, that enough room will be reserved for the implementation of this type of conditions (see also section 6.4).
6.3
Labour migration pros and cons Assuming a selective immigration policy, there is little doubt that some degree of labour
migration is beneficial to the economy of a host country. However, the analysis indicates that there are no substantial gains to be expected from large scale immigration of labour; more
specifically, such immigration would not be effective in alleviating the financial burden of population ageing in the Netherlands. How and when should we open the door to labour
migrants? Policy options should be evaluated taking into account the pros and cons as listed below.
•
Some arguments in favour of labour migration are:
For certain talents and skills the labour market is international and sometimes even global. Therefore, it may be beneficial to the economy if employers are allowed to look abroad for
talented staff. The European Union already offers ample opportunity to do so, but it might be •
•
interesting to look further abroad.
Labour shortages will eventually vanish due to feedback mechanisms in the economy, such as an increase in wages. Therefore, immigration is not necessary as a response to shortages. Nevertheless, temporary labour migration may be preferable to long-lasting vacancies.
Population ageing will lead to an increase in demand for labour in the health care and cure sectors. If labour supply does not keep up, these sectors may increase wages in order to
successfully compete on the labour market. This will lead to an increase in public spending, which the authorities would prefer to avoid because of the consequences for the tax burden. While immigration is, generally speaking, not effective to alleviate the financial burden of
ageing, some immigration of labour, specifically targeted on the health care and cure sectors, •
may be considered if staffing in these sectors turns out to be a serious problem.
Immigration may help to ‘grease the wheels of the labour market’, particularly with respect to regional discrepancies.
Arguments against labour migration include the following:
•
There is a risk of failing integration and thereby relatively large dependency on social transfer
•
One labour immigrant will be followed by several family members (see chapter 2). The present
programmes.
regulations allow no selectivity with respect to the economic potential (thus far seen to be below average) of these family immigrants.
91
Immigration and the Dutch Economy: Policy implications
•
Labour migration reduces incentives for the (re-)employment of beneficiaries of social transfers
•
In a densely populated country like the Netherlands there are risks of negative external effects
(disability, unemployment and welfare). (see chapter 5).
from demand driven to supply driven? The present system of labour migration in the Netherlands was described in chapter 2.
Employers who cannot find suitable staff to fill vacancies within the European Economic Area (EEA), are allowed, on a temporary basis, to hire employees from countries outside that area.
This system can be characterized as demand-driven. It is sometimes suggested that we can learn from the traditional immigration countries like Australia, Canada and the United States, that employ supply-driven systems of labour migration, based on quotas or a point system or a combination of both (Loobuyck, 2001).
•
•
•
•
Indeed, a supply-driven system has some advantages:
Formalities to check whether individual candidates qualify for immigration take time; this
directly affects the time it takes in a demand-driven system to fill a vacancy, while in a supplydriven system employers can directly search among admitted labour migrants.
In a demand-driven system, the tethering of migrants to specific employers creates inefficiencies and limits the freedom of the employee to change jobs; in a supply-driven system, this is not the case.
A supply-driven system offers better opportunities for selectivity with respect to the However, a supply-driven system has some disadvantages as well:
Unlike in the demand-driven system, there is no guarantee, despite selection criteria, that a
labour migrant will find and keep a job. For instance, educational attainment is not a reliable
predictor of success on the labour market (see chapter 2). Integration may fail, resulting in the •
dependency on some social transfer programme.
In the present demand-driven system, employers have to give priority to the unemployed (in the EEA), which may help to reduce the number of beneficiaries; in a supply-driven system there is no such mechanism.
Welfare state provisions in the traditional immigration countries are austere as compared to the Netherlands. Therefore, it may be rational that these countries prefer a supply-driven system, while for the Netherlands a demand-driven system seems to be more appropriate.
92
Labour migration
unorthodox systems Apart from the systems mentioned above, which have been applied in different countries, other, less ‘orthodox’ systems have been proposed. Some of these will be briefly reviewed here.
Liberalisation of immigration in combination with a delayed access to the welfare state was
proposed by Doomernik et al. (1999). Immigrants have to choose between labour immigration
and applying for asylum. This system is supposed to counteract the activities of the international immigration industry and abuse of asylum. It will also render redundant the present efforts to control immigration. However, it implies inequality between newly arrived immigrants and
residents. This may lead to initiatives, possibly indirectly funded by the government, to bypass
restrictions on the use welfare state provisions, as we have seen with respect to undocumented immigrants. Moreover, the formal exclusion from these provisions is only temporary.
Recently, Veenkamp et al. (2003) put forward a proposal for immigration policy in the European Union. They state: “Control of migration flows seems simultaneously to be more necessary and less feasible than ever before.” In their view, anyone in the world wishing to travel to the European Union for whatever reason, can apply for a visa as either a visitor, a worker, a
sponsored resident or a refugee. Permission will be granted automatically on fulfilment of
certain basic criteria. In case of a worker this may be either a job offer or qualification under a points-based system. Freedom to enter and travel across the European Union would thus become easier to achieve. Migration produces continuing increases in diversity. This fact
logically implies, according to the authors, a modest integrative ambition: just to establish and maintain peaceful coexistence would be a significant achievement. Welfare provision is to be
reorganised so that beyond guaranteed entitlements for the retired and others incapable of selfreliance, welfare investment is structured through the provision of a ‘citizenship credit’ that entitles the individual to a revolving, interest-free credit facility and a range of personalised
support services and opportunities, including various levels of health and social care, education, retraining, and so on. Such services and credit facilities are potentially available on similar conditions to migrant workers, but very few are available as unconditional benefits.
Unfortunately, we have no assessment of fiscal impact of immigration under the proposed system.
Finally we should mention systems involving the selling, auctioning or trading of permits for labour migration (see for instance Simon, 1990, Becker and Becker, 1996, and Weinstein,
2002). The idea is that those who benefit most from immigration (i.e. the immigrant and the employer) should pay for an immigration permit. This is supposed to lead to a selection of
immigrants with a high economic potential and it allows for compensation of negative external effects, including the use of welfare state provisions.
93
Immigration and the Dutch Economy: Policy implications
6.4
European policy Since the Amsterdam Treaty of 1997, the European Union has been moving in the direction of a common asylum and immigration policy. This means that the policy discussion in the previous sections of this chapter, may be relevant at the European level as well. While national policies
can be changed if circumstances require so, policies agreed upon at the European level are far less flexible and may turn out to be practically irreversible. Maybe this will be less so if, in the
decision-making process, unanimity is traded in for qualified majorities. However, in that case, national interests may easily be overruled. As we shall see, the Dutch national interest in the field of immigration may diverge considerably from the interest of other member states.
The envisaged common European asylum system should, in time, lead to a common asylum
procedure and a uniform status, valid throughout the Union, for those granted asylum. As we
discussed in section 6.2, a country considering whether or not to grant a permanent status, may find it advisable to apply criteria with respect to the applicant’s self-reliance. Therefore, in a European system, enough room should be reserved for the implementation of this type of condition.
As regards labour migration, the position of the Dutch government so far has been that
immigration is not a suitable policy response to population ageing in the Netherlands. This position is supported by the results of the present study. We have already mentioned the
initiative of the European Commission departing from the desirability of immigration in view of population ageing. Other countries in the European Union may go along with the views of the Commission. This may particularly be the case for countries that are facing relatively severe ageing in combination with unsustainable pay-as-you-go pension systems.
94
Literature
Literature Ablett, J. , 1999, Generational Accounting in Australia, in Generational Accounting around the
World, University of Chicago Press.
Altonji, J. G. and D. Card, 1991, The effects of immigration on the labor market outcome of lessskilled natives, in: J. M. Abowd and R. Freeman (eds.) Immigration, trade, and the labor market University of Chicago Press, Chicago, IL.
Angrist, J. and A. Kugler, 2002, Protective or counter-productive? Labour market institutions and the effect of immigration on EU natives, IZA DP 433.
Auerbach, A.J. and P.Oreopoulos, 2000, The Fiscal Effect of U.S. Immigration, A Generational Accounting Perspective, in Tax Policy and the Economy, NBER, MIT-press.
Auerbach, A. J., and P. Oreopoulos, 1999, Analyzing the fiscal impact of immigration, American Economic Review, Papers and proceedings, 176-180.
Bauer, T., and K. F. Zimmermann, 1999, Assessment of possible migration pressure and its labour market impact following EU enlargement to Central and Eastern Europe: Part 2, Research Report No. 139, Department for Education and Employment.
Beck, Roy, 1996, The case against immigration, Norton & Company, New York-London. Becker, G. and G. N. Becker, 1996, The economics of life: from baseball to affirmative action to immigration, how real world issues affect our everyday life, McGraw-Hill.
Beine, M., F. Doquier and H. Rapoport, 2001, Brain drain and economic growth: Theory and evidence, Journal of Development Economics, Vol. 64.
Bhagwati, J., 1976, The brain drain, International Social Science Journal, Vol. 28(4). Binger, B. and E. Hoffman, 1998, Microeconomics with calculus, Scott Foresman and Co. Boeri, T., G. Hanson and B. McCormick, 2002, Immigration Policy and the Welfare System, Oxford University Press.
95
Immigration and the Dutch Economy: Literature
Bonin, H., B. Raffelhueschen and J. Walliser, 2000, Can immigration alleviate the demographic burden? Finanzarchiv, 57.
Bonin, H., 2001, Fiscale Effecte der Zuwanderung nach Deutschland: Eine Generationenbilanz, IZA Discussion paper No. 32, University of Bonn.
Borjas, G. J., 1994, The economics of immigration, Journal of Economic Literature, Vol. 32, No. 4. Borjas, G. J., 1995, The economic benefits from immigration, Journal of Economic Perspectives Vol.9, No. 2.
Borjas, G. J., 1999a, Heaven’s Door, Immigration Policy and the American Economy, Princeton University Press, Princeton.
Borjas, G. J., 1999b, The economic analysis of immigration, in: O. Ashenfelter and D. Card (eds.) Handbook of Labor Economics, Vol. 3, Amsterdam, North-Holland.
Borjas, G.J., 1999c, Immigration and Welfare Magnets, Journal of Labor Economics, Vol. 17. Borjas, G. J., 2001, Does immigration grease the wheels of the labor market, Brookings Papers on Economic Activity, Issue 1.
Borjas, G. J., 2003, The labor demand curve is downward sloping: reexamining the impact of immigration on the labour market, NBER WP 9755.
Briels, J., 1978, De Zuidnederlandse immigratie 1572-1630, Fibula-van Dishoeck, Haarlem. Bovenkerk, F., M.J.I. Gras and D. Ramsoedh, 1995, Discrimination against migrant workers and
ethnic minorities in access to employment in the Netherlands, International Migration Papers 4, Employment Department, International Labour Office, Geneva.
Burda, M. and C. Wyplosz, 1992, Human capital, investment and immigration in an integrated Europe, European Economic Review, Vol. 36.
CBS, 2000a, Nieuwe standaarddefinitie voor allochtonen, Maandstatistiek van de bevolking, mei 2000.
CBS, 2000b, Allochtonen in Nederland 2000, November 2000.
96
Literature
CBS, 2001, Allochtonen in Nederland 2001, November 2001. CBS, 2002a, Illegalen in Nederland, Maandstatistiek van de bevolking, mei 2002. CBS, 2002b, Allochtonen in Nederland 2002, November 2002. CBS, 2003, Driekwart bevolkingsgroei door allochtonen, persbericht PB03-050. Chiswick, C., B. Chiswick and G. Karras, 1992, The impact of immigrants on the macroeconomy, Carnegie-Rochester Conference Series on Public Policy, Vol.37.
Choenni, Chan E.S, 2000, Ontwikkeling van het rijksoverheidsbeleid voor etnische
minderheden 1975-2000, Nimwegen, Nico van en Gijs Beets (red.): Bevolkingsvraagstukken in Nederland anno 2000, NiDi-rapport no. 58, Den Haag.
Clarke, Harry R., Yew-Kwang Ng, 1993, Immigration and Economic Welfare: Resource and Environmental Aspects, The Economic Record, Vol. 69, No. 206, pp. 259-273.
Commissie van de Europese Gemeenschappen, 2000, Mededeling van de Commissie aan de Raad en het Europees Parlement over een communeautair immigratiebeleid, COM(2000) 757 definitief, Brussel.
CPB, 1997, JADE: a model for the joint analysis of dynamics and Equilibrium, CPB working paper, No. 99.
CPB, 1999, Centraal Economisch Plan 1999, Sdu, Den Haag. CPB, 2000, Centraal Economisch Plan 2000, Sdu, Den Haag. CPB, 2003, Centraal Economisch Plan 2003, Sdu, Den Haag. Dagevos, J., 2001, Perpectief op integratie; over de sociaal-culturele integratie van etnische minderheden in Nederland, WRR werkdocumenten W121, Den Haag
de Graaff, T., 2002, Migration, ethnic minorities and network externalities, Tinbergen Institute Research Series, No. 278, Thela Thesis.
97
Immigration and the Dutch Economy: Literature
de Jong, L., 1974, Het Koninkrijk der Nederlanden in de Tweede Wereldoorlog, deel 5, eerste helft, Staatsuitgeverij, ‘s-Gravenhage.
de Jong, L., 1988, Het Koninkrijk der Nederlanden in de Tweede Wereldoorlog, deel 12, tweede helft, Staatsuitgeverij, ‘s-Gravenhage.
de Vries, Jan en Ad van der Woude, 1995, Nederland 1500-1815: de eerste ronde van economische groei, Balans, Amsterdam.
Doomernik, Jeroen, Bernadette Ficq en Edith Mol, 1999, Laat migranten het in Europa zelf uitzoeken, de Volkskrant, 27 juli.
Draper, N., 2001, Herschatting productiefunctie JADE, CPB Memorandum, No. I/2001/8. Draper, N. and A. Manders, 1997, Structural changes in the demand for labor, De Economist, Vol. 145, No. 4.
Friedberg, R. and J. Hunt, 1995, The impact of immigration on the host country wages, employment and growth, Journal of Economic Perspectives, Vol.9, No. 2.
Fujita, Masahisa, Paul Krugman and Anthony J. Venables, 1999, The Spatial Economy, The MIT Press.
Gorter, J. and A. Parikh (2003), How responsive is FDI to differences in effective corporate tax rates? De Economist, forthcoming.
Graafland, J, R. de Mooij, A. Nibbelink, A. Nieuwenhuis, 2001, MIMICing tax policies and the
labour market, Amsterdam, North Holland.
Grubel, H.B. and A.D. Scott, 1966, The international flow of human capital, American Economic
Review, May.
Hamermesh, D. S., 1993, Labor Demand, Princeton University Press, Princeton. Haque, N.U. and S. Kim, 1995, Human capital flight: Impact of immigration on income and growth, IMF staff papers, Vol 42, Nr. 3.
Hartog, Joop, 2002a, Ongegrond, Economisch-Statistische Berichten, 24-5-2002.
98
Literature
Hartog, Joop, 2002b, Nederland Immigratieland? Nee!, van Dalen, Harry en Frank Kalshoven (eds.): Meesters van de welvaart, Balans, Amsterdam.
Hartog, J. and A. Zorlu, A, 2002, The effect of immigration on wages in three European countries, IZA DP 642.
Heijke, H., 1979, Sociaal-economische aspecten van gastarbeid, Doctoral dissertation, NEI, Rotterdam.
INFRAS/IWW, 2000, External Costs of Transport. Accident, Environmental and Congestion Costs of Transport in Western Europe, Zürich/Karlsruhe.
Israel, Jonathan I. 1995, The Dutch Republic: its Rise, Greatness, and Fall 1477-1806, Clarendon Press, Oxford.
Jansen, Kees, Jan Schuur, Marc Stoffers en Herman Stolwijk, 2001, De ruimtevraag in 2030 in twee scenario’s, CPB Document No 009, Den Haag.
Keller, W.J.,1976, A nested CES-type utility function and its demand and price-index functions, European Economic Review, Vol. 7.
Knaap, T., A.L. Bovenberg, L.J.H. Bettendorf, D.P. Broer, 2003, Vergrijzing, aanvullende pensioenen en de Nederlandse economie, Ocfeb Studies in Economic Policy 7, Erasmus Universiteit Rotterdam.
Kooyman, Jan and Jos van der Pas, 1972, The Economic Effects on the Netherlands of Recruiting Foreign Labour, CPB Occasional Papers, No.2/1972.
Lakeman, Pieter, 1999, Binnen zonder kloppen; Nederlandse immigratiepolitiek en de economische gevolgen, Meulenhoff, Amsterdam.
Loobuyck, Patrick, 2001, Vreemdelingen over de (werk)vloer; het debat over arbeidsmigratie en de migratiestop in kaart, Academia Press, Gent.
Lucassen, Jan and Rinus Penninx, 1994, Nieuwkomers, nakomelingen, Nederlanders; Immigranten in Nederland 1550-1993, Het Spinhuis.
99
Immigration and the Dutch Economy: Literature
Mattingly, H and S.A. Handford (transl.), 1976, Tacitus: The Agricola and the Germania, Penguin Books.
McCormick, B., and J. Wahba, 2000, Overseas Employment and Remittances to a Dual Economy, The Economic Journal, Vol. 110.
Ministerie van Financiën, 2002, Perspectief op integratie, rapport van de IBO-werkgroep
Doelmatigheid van het inburgeringsbeleid.
Ministerie van OCenW, 2001, Rijksbegroting 2001, Sdu, ‘s-Gravenhage. Ministerie van VROM, 2001, Ruimte maken, ruimte delen, Vijfde Nota over de Ruimtelijke Ordeing 2000/2020, De Haag.
Moscorola, F.C., 2001, The effects of immigration inflows on the sustainability of the Italian
Welfare State, Center for Research on Pensions and Welfare Policies, Working Paper no. 6/01, Turin.
Mountford, A., 1997, Can a brain drain be good for growth in the source country?, Journal of Development Economics, Vol. 53.
Nieuwenhuis, A., 2003, De macro-economische gevolgen van immigratie volgens MIMIC, CPB Memorandum 1/2003/01.
Rijksvoorlichtingsdienst, 2002, Strategisch Akkoord voor het kabinet CDA, LPF, VVD. Rijksvoorlichtingsdienst, 2003, Hoofdlijnenakkoord voor het kabinet CDA, VVD, D66. Roodenburg, Hans, 2000, Immigratie in Nederland: economische gevolgen, van Nimwegen,
Nico en Gijs Beets (red.): Bevolkingsvraagstukken in Nederland anno 2000, NiDi-rapport no. 58, Den Haag.
Scheffer, P., 2000, Het multiculturele drama, Jaarboek Koninklijke Vereniging voor Staathuishoudkunde 1999/2000.
SCP, 1976, Sociaal en Cultureel Rapport 1976, Sdu, ‘s-Gravenhage.
100
Literature
Simon, J., 1990, Auction the right to be an immigrants, in: J. Simon, Population matters: people, resources, environment and immigration, Brunswick and London.
Sinn, H. W. and M. Werding, 2001, Immigration Following EU Eastern Enlargement, CESifo Forum, Summer 2001.
Smith, J. P. and B. Edmonston, eds., 1997, The new Americans: economic, demographic and fiscal effects of immigration, National Academic Press, Washington D. C.
Stark, O., C. Helmenstein and A. Prskawetz, 1994, A brain gain with a brain drain, Reihe Ökonomie, Wien.
Steinmann, G., 1994, The effects of immigrants on the incomes of natives, in: G. Steinmann and R. Ulrich (Eds.), The economic consequences of immigration to Germany, Physica Verlag, Heidelberg.
Storesletten, K., 2000, Sustaining fiscal policy through immigration, Journal of Political Economy, 108, 300-322.
Storesletten, K., 2003, Fiscal implications of immigration- a net present value approach, Scandinavian Journal of Economics, forthcoming.
Tesser, P.T.M, J.G.F. Merens and C.S. van Praag, 1999, Rapportage minderheden 1999, SCP, ‘s-
Gravenhage.
Tesser, P.T.M and J Iedema, 2001, Rapportage minderheden 2001, Deel I Vorderingen op school, SCP, ‘s-Gravenhage.
The Economist, 2002, The longest journey. A survey of Migration, issue Nov. 2nd-8th. Tweede Kamer, 2001a, Knelpunten op de arbeidsmarkt en arbeidsmigratie, brief van de Minister van Sociale Zaken en Werkgelegenheid, vergaderjaar 2001-2002, 28 026, nr. 1, Sdu, ‘s-Gravenhage.
Tweede Kamer, 2001b, Aanpak onderwijsachterstanden. Voor- en vroegschoolse ecucatie, brief van de Staatssecretaris van Onderwijs, Cultuur en Wetenschappen, vergaderjaar 2000-2001, 27 020 en 27 190, Sdu, ‘s-Gravenhage.
101
Immigration and the Dutch Economy: Literature
Tweede Kamer, 2002, Integratie in het perspectief van immigratie, brief van de Minister van Grote Steden- en Integratiebeleid, vergaderjaar 2001-02, 28 198, nr. 1, Sdu, ‘s-Gravenhage.
United Nations, 2000, Replacement Migration: is it a solution to declining and ageing populations?, Population Division, Department of Economic and Social Affairs, New York.
van Beek, K.W.H. and B.M.S van Praag, 1992, Kiezen uit sollicitanten, Concurrentie tussen werkzoekenden zonder baan, Wetenschappelijke Raad voor het Regeringsbeleid.
van der Zwan, Arie, 2002, Waar blijft de ombuiging van het immigratiebeleid?, Socialisme & Democratie, nr. 4.
van Egmond, N., 2002, Migratie gaat ten koste van het milieu, de Volkskrant, 18 November. van Ewijk, C. and S. van Wijnbergen, 1995, Can abatement overcome the conflict between environment and economic growth, De Economist, Volume 143.
van Ewijk, Casper, Barthold Kuipers, Harry ter Rele, Martijn van de Ven and Ed Westerhout, 2000, Ageing in the Netherlands, CPB/Sdu, The Hague.
van Imhoff, Evert and Nico van Nimwegen, 2000, Migratie GEEN remedie tegen vergrijzing, Demos bulletin over bevolking en samenleving nr. 2, februari 2002, NiDi, Den Haag. van Ours, J., 2001, Arbeidmigratie, Justitiele Verkenningen, Vol. 27, No. 8. van Ours, J. and J. Veenman, 2002, From parent to child : early labor market experiences of
second-generation immigrants in the Netherlands, CentER Discussion Papers Series, No. 105. van Ours, J., J. Veenman and W. Verhoeven, 2002, Van ouder op kind; Scholing en arbeidsmarktpositie van tweede generatie allochtone jongeren, OSA, A185.
van Praag, Carlo and Paul Tesser, 2000, Immigratie in Nederland: sociale gevolgen, van Nimwegen, Nico en Gijs Beets (red.): Bevolkingsvraagstukken in Nederland anno 2000, NiDi-rapport no. 58, Den Haag.
Veenkamp, Theo, Tom Bentley and Alessandra Buonfino, 2003, People Flow. Managing Migration in a new European Commonwealth, Demos.
102
Literature
Weinstein, Eric, 2002, Migration for the benefit of all: Towards a new paradigm for economic immigration, International Labour Review, Vol 141, No. 3.
WRR, 1989, Allochtonenbeleid, Rapporten aan de Regering, nr. 36, Sdu, ‘s-Gravenhage. WRR, 2001, Nederland als immigratiesamenleving, Rapporten aan de Regering, nr. 60, Sdu, ‘sGravenhage.
Zorlu, A., 2002, Absorption of immigrants in European labour markets, Tinbergen Institute Research Series, No. 279, Thela Thesis.
103
Immigration and the Dutch Economy: Literature
104
Appendix 1
Appendix 1: Effects on the countries of origin This appendix relates to chapter 1 (Introduction). Brain-drain If emigrants have a higher educational attainment than the average population in the country of
origin, that country is said to suffer from ‘brain-drain’. A country undergoing brain-drain invests in the human capital of migrants but does not share in its returns. This is likely to hurt the economic perspectives of that country, and should be a matter of concern, particularly for
developing countries. References on brain-drain include Grubel and Scott (1966), Bhagwati (1976) and Haque and Kim (1995).
It goes without saying that brain-drain is most likely to occur if countries of destination have adopted immigration policies that favour high-skilled immigrants. But even if this is not the case, brain-drain may occur, as is shown in table A.1.1. Table A.1.1 Share of immigrants with secondary or higher education country of origin
1960s %
1980s
1990s
indexa
%
indexa
%
indexa
Turkey
11
154
25
205
44
201
Netherlands Antilles/Aruba
45
875
48
124
53
78
a
population country of origin = 100
Source: UNESCO, Social and Cultural Planning Office of the Netherlands
The vast majority of Turkish migrants who came to the Netherlands in the 1960s to do unskilled work, had little education. However, the share of those with at least secondary education was
higher than the Turkish average. In the following decades educational attainment in Turkey has increased. Taking a look at the Turkish migrants who came to the Netherlands in the eighties
and nineties for reasons of family reunification or formation, we can observe the same pattern. Still, most migrants have little education, but the share of those with at least secondary
education increased, both in absolute terms and relative to the Turkish average. So, even though the Turkish migration aimed at unskilled employment originally, the educational attainment of the migrants was higher than the Turkish average. The figures include, however, education acquired in the Netherlands, which should by definition be excluded from any brain-drain
estimate. Nevertheless, the figures in table A.1.1 suggest that, to a certain extent, brain-drain has
taken place. This might have been the result of a selection mechanism, implying that the higher educated have a higher propensity to migrate.
105
Immigration and the Dutch Economy: Appendices
The figures with respect to migrants from the Netherlands Antilles and Aruba show a different pattern.
During the 1960s, migrants from this part of the former colonies were relatively high-educated. The figures include those who came to the Netherlands to study and decided to stay afterwards. Consequently, for this group of immigrants, additional education acquired after arrival in the
Netherlands may be relatively important. This makes it difficult to conclude from the figures in
table A.1.1 that a brain-drain has taken place with respect to this migration flow. In the eighties, the share of migrants with at least secondary education had come close to the average in the
combined countries of origin, while in the nineties it fell below that level. So, over the years,
brain-drain from the Netherlands Antilles and Aruba, if it did take place at all, came to an end and changed into a migration flow of relatively low-educated. Brain-Gain The effects of brain-drain have been subject to debate. Mountfort (1997) and Beine, Docquier and Rapoport (2001) disputed the general opinion that emigration of relatively high-skilled
labour harms the country of origin. The basic argument of these authors is that investment in
education is endogenous. If there exists a possibility to emigrate to some rich country, this may create an incentive to invest in education. However, due to restrictive policies in the potential countries of destination and sometimes in the country of origin as well, not all the additional
human capital accumulated by this mechanism will eventually be lost due to emigration. The
country of origin may end up with a higher stock of human capital than it would have had if the possibility te emigrate had not existed. This phenomenon is called ‘brain-gain’.
Return migration may also add to the brain-gain (Stark, Helmenstein and Prskawetz, 1994). The education, skills and experience acquired during an emigrant’s stay abroad may be employed in the home country. As was pointed out in chapter 2, return migration from the Netherlands to non-western countries is far from negligible. However, only those who are young enough te become economically active in the home country may contribute to the brain-gain.
Evidence on the existence of brain-gain is theoretical, rather than empirical. Nevertheless, it seems possible that brain-drain may be mitigated, to some extent, by brain-gain. Income transfers Migrants from non-western countries tend to maintain financial ties with their country of
origin. They support the relatives they left behind financially and invest their savings in real
estate and business. WRR (2001) estimated that total remittances in 2000 amounted to 100 billion dollars worldwide, which is much larger than total aid for developing countries. In
106
Appendix 1
Turkey and Morocco, incoming remittances amounted to 3 percent and 6 percent of GDP. To a
certain extent, remittances can be considered as a compensation for the brain-drain of the home countries of the migrants. Nevertheless, the impact of remittances on economic development is
disputable. In general, they can have a positive impact on the current account, while remarkable remittances can also lead to Dutch-disease effects (McCormick and Wahba 2000).
Table A.1.2 contains some figures on remittances for the Netherlands with respect to four
migrant groups. Other relevant payments included in the table are social transfer payments to migrants who returned.
Table A.1.2 Income transfers from the Netherlands to the home countries of four ethnic groups in 2000 remittances
social transfer paymentsb
total transfers
total
per capitaa
million Euro
Euro
million Euro
million Euro
Morocco
170
1097
74
244
Turkey
227
1263
82
310
Netherlands Antilles/Aruba
21
293
11
33
Suriname
20
106
11
30
438
740
178
616
Total a b
First generation Collective provisions for old age, widow(er)s, disability and child support
The figures in table A.1.1 refer to payments arranged through formal monetary channels, and do not include cash payments and delivery of goods. The actual transfers to the countries of origin will therefore be higher than the figures given above.
107
Immigration and the Dutch Economy: Appendices
108
Appendix 2A
Appendix 2A: The stylized model This appendix discusses the analytical derivation of the stylized model presented in chapter 3 (Labour market). We consider the earnings of natives and the immigration surplus in a competitive economy with three production factors. Introduction Suppose the production technology in the host country can be summarized by a twice-
differentiable and continuous linear homogeneous production function with three inputs, capital K, high-skilled labour Lh, and low-skilled labour Ll, so that output Q=f(K,Lh,Ll). The
workforce L contains N native and M immigrant workers. All workers of the same skill level are substitutes in production: Q=f(K,Lh,Ll)=f(K,bN+$M,(1-b)N+(1-$)M), where b and $ denote the
fraction of high-skilled workers among natives and immigrants. We assume that natives own the entire stock of capital in the host country. Finally, the supplies of native and immigrant workers do not react to changes in wages (i.e. the supplies are perfectly inelastic).
In a competitive economy, each factor price equals the respective value of marginal productivity.
Let the price of output Q be numeraire. Then the rental rate of capital is r=fk= Mf/MK, the price of high-skilled labour is wh = fh = Mf/MLh, and the price of low-skilled labour is wl = fl = Mf/MLl.
Because the aggregate production function exhibits constant returns to scale, the entire output is distributed among the owners of capital and to workers. In the pre-immigration regime, the national income Q is given by Q = r K + wh Lh + wl Ll.
The setting of the model is equal to Borjas (1995, 1999b). We consider two kinds of economies: one economy with a fixed stock of capital (i.e. with perfectly inelastic capital) and one economy with a flexible stock of capital (e.g. with perfectly elastic capital). Inelastic capital In this economy the stock of capital is fixed. The impact of immigration on the earnings of
native production factors can be derived by differentiating the marginal productivity conditions (r=fk, wh=fh, wl = fl) with respect to the number of immigrants (note that MK/MM=0): Mfk MLh M Mr M ' % MM r MLh MM r ' $ gkh
' gkh
Mfk MLl M MLl MM r
M M % (1&$) gkl Lh Ll
$&b 1&b (1&m)m & gkk m p hp l pl
(2A.1)
109
Immigration and the Dutch Economy: Appendices
where m=M/(N+M) is the fraction of the workforce that is immigrant, ph and pl are the shares of
the workforce that are high-skilled and low-skilled, and gkh is the compensated high-skilled
labour supply elasticity of the return to capital.1 The derivations for the impact of immigration
on the earnings of high- and low-skilled labour are similar and lead to the following equations: Mwh M (b&$) (1&$) m ' ghh (1&m)m & ghk ph pl pl MM wh
(2A.2)
Mwl M (b&$) (1&$) m ' glh (1&m)m & glk MM wl ph pl pl
(2A.3)
The elasticities of the left-hand side of equations (2A.1) to (2A.3) are linear functions of the elasticities gij (i,j=k,h,l), which we assume to be constant over the interval [N,N+M].
The immigration surplus is the change in national income accruing to natives QN. We calculate this by tallying the gains and losses of the different production factors, which, in turn, we
approximate by linear extrapolation. The immigration surplus divided by national income Q is: )QN Q
' [ K
Mwh Mr % bN MM MM
% (1 & b) N
Mwl MM
]
M Q
(2A.4)
A useful property of the immigration surplus is that we can reformulate it as a weighted average of the elasticities of equations (2A.1) to (2A.3): )QN Q
' [ "k ( (
Mr M ( Mw h M ( Mw l M ) % "h ( ) % "l ( ) ] MM r MM wh MM wl
(2A.5)
where "i* is a linear function of share "i of production factor i=k,h,l in total production costs. To calculate the immigration surplus, Borjas starts with equation (2A.4) and takes the following approach: as the elasticities of equation (2A.1) to (2A.3) are constant by assumption, the partial derivatives (Mr/MM, Mwh/MM, Mwl/MM) vary over the interval [N,N+M]. Borjas approximates the
partial derivatives by linear interpolation. He evaluates them at some average point by taking the average values for the extremes of the interval [N, N+M]. As the derivatives for the point without immigration, Lh=bN and Ll=(1-b)N, are zero, the surplus is as follows: )QN Q
1
'
Mwh Mwl 1 Mr M [ K( *L'N%M) % b N ( *L 'bN%$M) % (1&b) N ( *L '(1&b)N%(1&$)M) ] h h 2 MM Q MM MM
The derivation uses the identity gik+gih+gil=0 (i=k,h,l).
110
(2A.6)
Appendix 2A
Rearranging the elements of the equation leads to: )QN Q
' &
1 Mr M b Mwh M 1&b Mwl M [ "k ( ) % "h (1&m) ( ) % "l (1&m) ( )] 2 MM r ph MM wh pl MM wl
(2A.7)
Now after some substitution, one can show that the immigration surplus equals: )QN Q
' &
1 $ 1&$ 2 $(1&$) [ " g ( )2 % "lgll( ) % "hghl ] m2 2 h hh ph pl p hp l
(2A.8)
One can prove that the immigration surplus is non-negative. Note that it is quadratic in the size of the immigration shock: if the number of immigrants is two times larger, the immigration surplus will be four times larger.
As some production factors gain from immigration and others lose, we are also interested in the amount of redistribution between the production factors. How much does each production
factor gain or lose? And how should these gains and losses be weighted to get the immigration surplus? Borjas uses the shares in the production costs ("k ,"h ,"l) as weighting factors. As a
consequence, the corresponding effects of immigration on wages and the return to capital are as follows: [
1 Mr M 1 b Mwh M 1 1&b Mwl M ( ), (1&m) ( ), (1&m) ( ) ] 2 MM r 2 ph MM wh 2 pl MM wl
(2A.9)
Somewhat remarkable is that the effects are about halved, while for the production factor capital
the effect is even exactly halved. The effects should therefore be interpreted as ‘average’ effects in a time-consuming transition period, where the effect in the beginning is almost zero, and the ‘full’ effect is evident after a certain period of time.
Although we certainly believe that the immigration surplus of equation (2A.8) is correct, we
would like to report ‘full’ effects of immigration. We therefore have to find a representation of the immigration surplus that is different from equation (2A.7). As a starting point, we take
equation (2A.5). Like Borjas, we are going to evaluate the change in national income accruing to
natives at some average point. That is to say, we will take average values of the weighting factors "i* by evaluating them at the extremes of the interval [N,N+M]. Define "i0 and "im as the
weighting factors for the points without and with immigration (so with m=0 and m=M/(N+M)). Then the immigration surplus can be expressed in the following way: )QN Q
m
("k % "k )
' [
0
2
(
m
m
("h % "h) Mwh M ("l % "l ) Mwl M Mr M ) % ) % ) ] ( ( MM r MM wh MM wl 2 2 m
0
m
0
(2A.10)
m
with [ "k , "h, "l ] ' [ "k, "h, "l ] and [ "k , "h , "l ] ' [ "k, "h (1&m)(b/ph), "l(1&m)((1&b)/pl) ] 0
0
0
111
Immigration and the Dutch Economy: Appendices
This immigration surplus equals exactly the immigration surplus of equation (2A.7). To see this, we rewrite equation (2A.10): )QN Q
'
1 m Mr M m Mw h M m Mw l M [ "k ( ) % "h ( ) % "l ( ) ] % 2 MM r MM wh MM wl 1 0 Mr M 0 Mw h M 0 Mw l M [ "k ( ) % "h ( ) % "l ( ) ] MM wh MM wl 2 MM r
(2A.11)
As the weighting factors "i0 are exactly equal to the shares "i, the second part of the right-hand
side of equation (2A.11) is equal to zero.2 Therefore, substituting the weighting factors "im of
equation (2A.10) in equation (2A.11) leads exactly to equation (2A.7).
The difference between our approach and that of Borjas does not lie in the immigration surplus, which is exactly the same for both approaches. The difference lies in the effects of immigration on wages and the return to capital. To calculate the immigration surplus, we use the following weighting factors:
[ "k , "h , "l ] ' [ "k, (
(
(
1 b 1 1&b " (1%(1&m) ), "l (1%(1&m) ) ] 2 h ph 2 pl
(2A.12)
while Borjas uses the weighting factors ("k ,"h ,"l). Our approach leads to effects of immigration on wages and the return to capital that are exactly according to equations (2A.1) to (2A.3). So, where the effects of Borjas should be interpreted as ‘average’ effects, our effects should be interpreted as ‘full’ effects of immigration. In Chapter 3, we report the latter effects. Elastic capital In this economy the stock of capital always adjusts so that the rental rate of capital does not
change. To determine the impact of immigration on the earnings of other production factors and on the consumer surplus we need to know how the stock of capital adjusts. This can be derived from the fact that the rental rate of capital does not react to immigration: Mfk Mr MK ' fkk ' % fkh $ % fkl (1&$) ' 0 MM MM MM
(2A.13)
so: $fkh % (1&$)fkl K MK K ' & fkk MM M M
(2A.14)
Now the impact of immigration on wages of high-skilled workers can be derived as follows:
2
This derivation uses the identity "kgki + "hghi + "lgli = 0 (i=k,h,l).
112
Appendix 2A
Mwh M Mfh MK M Mfh MLh M Mfh MLl M ' % % MM wh MK MM wh MLh MM ws MLl MM ws ' ghk
MK M $ (1&$) % ghh m % ghl m MM Lh ph pl
' [ ghh
2
"h ghk ($&b) & ] (1&m) m "k gkk ph pl
(2A.15)
The impact of immigration on wages of low-skilled workers can be derived in the same way: 2
Mwl M "l glk ($&b) ] ' [ gll & (1&m) m MM wl "k gkk ph pl
(2A.16)
As in the previous section, the change in national income accruing to natives can be written as: )QN Q
' [ bN
Mwh
% (1&b) N
MM
Mwl MM
]
M Q
(2A.17)
Again, the change in national income accruing to natives (i.e. the immigration surplus) can be expressed as a weighted average of the elasticities of equation (2A.1) to (2A.3): )QN Q
' [ "h ( (
Mwh M ( Mw l M ) % "l ( ) ] MM wh MM wl
(2A.18)
where "i* is a linear function of share "i of production factor i=h,l in total production costs. Now Borjas follows the same procedure to calculate the immigration surplus: he approximates the partial derivatives of equation (2A.17) by linear interpolation. After some substitution, he shows that the immigration surplus equals: 2
)QN Q
' &
"h ghk ($&b)2 1 "h [ ghh & ] (1&m 2) m 2 2 "k gkk p 2p 2 h l
(2A.19)
One can prove that the immigration surplus is non-negative. And it is again quadratic in the size of the immigration shock.
We follow once again the same procedure as for the previous subsection: we evaluate the change in national income accruing to natives at some average point by taking the average values of the weighting factors for the extremes of the interval [N,N+M]. The resulting immigration surplus: )QN Q
' [
m
("h % "h) 0
2
(
m
Mwh M ("l % "l ) Mwl M ) % ) ] ( MM wh MM wl 2 0
(2A.20)
113
Immigration and the Dutch Economy: Appendices
One can prove that this immigration surplus is equal to the immigration surplus of equation (2A.19) by following the procedure of the previous subsection. Chapter 3 reports changes in wages and amounts of redistribution that are according to the last equation, which implies effects of immigration that are about twice as large as those reported by Borjas. Simulations In Chapter 3 we use the model to simulate the effects of an increase in the number of workers
because of immigration. Note that in the model the immigrants are considered to be part of the population already. An increase in the number of workers by 5% thus corresponds to a fraction of immigrants m=M/L=0.05/(1+0.05)=1/21=0.0476. Therefore in this case the percentage of immigrant workers after their arrival is 4.76% of the total number of workers.
114
Appendix 2B
Appendix 2B: Elasticities for the Netherlands This appendix derives factor supply elasticities of prices for the Dutch economy as presented in chapter 3 (Labour market). We use empirical results on production functions that are part of the macroeconomic model JADE. Introduction How do wages react to an increase in the number of workers because of immigration? To
answer the question we need to specify the factor supply elasticities of prices. Most studies on immigration choose the size of the elasticities on the basis of the empirical literature. For the Netherlands the literature is, however, less extensive. Therefore, we derive the elasticities by
using production functions that are part of the macroeconomic model for the medium term, JADE. We first derive compensated price elasticities of factor demand (0ij = M log(qi)/M log(pj)
with quantity qi and price pj), and then derive compensated factor supply elasticities of prices (gij = M log(pi)/M log(qj) with price pi and quantity qj).
Price elasticities of factor demand The model JADE uses a nested CES production function f with output Q=f(K,Lh,Ll), where K
represents capital, Lh represents high-skilled labour and Ll represents low-skilled labour. Define r as the price of capital, wh as the price of high-skilled labour, and wl as the price of low-skilled
labour. The minimal cost function takes the following form: 1
c ( ' $ Q c ' $ Q ( 8r 1 & F % (1 & 8)w 1 & F ) 1 & F w ' ( µ wh
1 & 2
% (1 & µ)wl
1 & 2
1
)1 & 2
(2B.1) (2B.2)
where ($, 8, F, µ, 2) are parameters of the CES production function. Factor-demand relations
can be derived by differentiating the minimal cost function with respect to prices: K ' Lh ' Ll '
Mc ( r ' $ Q 8 ( )&F Mr c
wh Mc ( w ' $ Q (1 & 8) µ ( ) & F ( ) & 2 c Mwh w
wl Mc ( w ' $ y (1 & 8) (1 & µ) ( ) & F ( ) & 2 Mwl w c
(2B.3) (2B.4) (2B.5)
The derivation of the corresponding matrix of price elasticities can be found in, for instance,
Keller (1976). Define "i as the share of production factor i in the total costs of production. The
matrix of compensated price elasticities as follows:
115
Immigration and the Dutch Economy: Appendices
ηkk H = ηhk ηlk
ηkh ηhh ηlh
ηkl −(1 − α k )σ ηhl = α k σ ηll α σ k
αhσ αl σ αh αl (θ − α k σ ) − θ (θ − α k σ) 1 − αk 1 − αk αh αl (θ − α k σ ) (θ − α k σ ) − θ 1 − αk 1 − αk
(2B.6)
To quantify the elasticities, we need estimates for the substitution parameters F and 2. Draper
and Manders (1997) estimate both parameters by using data from the period 1969-1993 for two sectors, exposed and sheltered, of the Dutch economy. Draper (2001) re-estimates the model by using data from the period 1969-1999, but this study estimates the parameter F for the two
sectors jointly. The parameter 2 is not estimated, as the model includes only one type of labour.
The nested structure of the production function allows us to combine the parameter estimates of the two studies: we use the parameter F from Draper (2001), and we use the parameter 2 from
Draper and Manders (1997) by taking the average of the parameter estimates for the exposed and sheltered sectors (which are about equal in size in terms of total output).
For our purposes, we need substitution parameters F and 2 that hold for the entire Dutch
economy. Unfortunately, we lack empirical evidence for the other sectors of the economy, which include mining, quarrying, immovable properties, health care and government. Concerning the last two sectors, Hamermesh (1993) discusses four international studies on governmental and health care nonprofit institutions. His conclusions: the results on the price elasticities are too
varied and too few to allow general comparisons with results from profit-seeking firms; but they give no inkling that substitution parameters for capital, and between types of heterogenous labour, differ between for-profit and nonprofit sectors. The authors know of no empirical
evidence after 1993 that invalidates this conclusion. It therefore seems reasonable to assume that the substitution parameters for the government and health care sector are similar to the
substitution parameters of the market sector. On the remaining sectors mining, quarrying, and immovable properties there is no empirical evidence at all. We assume their substitution
parameters to be similar, too. In other words, we assume that the substitution parameters F and 2 for the market sector hold for the entire Dutch economy.
Next, we need the shares of the production factors in the total costs of production. For this we
use the Dutch national accounts, which report total costs of production and total labour costs for dependent employees. These figures make it possible to calculate the capital share "k in the total production costs. As our figures need to include the depreciation of capital, we use the
116
Appendix 2B
production costs in gross terms. We approximate the labour costs of self-employment by
assuming that the annual costs of a self-employed person equal the annual costs for a dependent employee. We also need to calculate the shares "h and "l for the two types of labour. We use numbers of people and gross wages by education level observed in the Loon Structuur
Onderzoek. The assumptions used to calculate the matrix of elasticities, with the year 2000 as base year, are:
[F,2] ' [0.320, 1.660], ["k,"h,"l] ' [0.350, 0.485, 0.165]
(2B.7)
The matrix of compensated price elasticities for the entire Dutch economy:
ηkk H = ηhk ηlk
ηkh
ηhh ηlh
0.053 ηkl −0.208 0.155 ηhl = 0.112 −0.505 0.393 1.155 −1.267 ηll 0.112
(2B.8)
The own-price elasticity of low-skilled labour is large; this is because the types of labour are
highly substitutable in production. The nested structure of the CES production function allows us to calculate the own-price elasticity of aggregate labour, which equals -"kF = -0.112. The size
of this number slightly contradicts the international evidence summarized by Hamermesh
(1993), who says that the own-price elasticity of labour demand is between -0.15 and -0.75. We are more in line with another finding reported in Hamermash (1993): | 0ll | > | 0hh |. Factor supply elasticities of prices In the previous section we derived compensated price elasticities. But we need the compensated factor supply elasticities to study the economic effects of immigration. Calculation of the
compensated factor supply elasticities is straightforward, as one can prove that for the nested CES production functions the following holds:
ε kk E = ε hk ε lk
ε kh
ε hh ε lh
−1 ε kl −(1 − α k )σ ε kl = α k σ − 1 ε ll α σ−1 k
−1
αh σ αh −1 (θ − α k σ − 1 ) − θ − 1 1 − αk αh (θ − 1 − α k σ − 1 ) 1 − αk
αl σ αl (θ − 1 − α k σ − 1 ) (2B.9) 1 − αk αl (θ − 1 − α k σ − 1 ) − θ − 1 1 − αk −1
So under the assumptions: [F,2] ' [0.320, 1.660], ["k,"h,"l] ' [0.350, 0.485, 0.165]
(2B.10)
117
Immigration and the Dutch Economy: Appendices
the matrix of compensated factor supply elasticities is:
ε kk E = ε hk ε lk
ε kh
ε hh ε lh
0.516 ε kl −2.031 1.516 ε hl = 1.094 −0.969 −0.125 ε ll 1.094 −0.367 −0.727
(2B.11)
The own-labour supply elasticities are in line with Borjas (1999b), who distinguishes three cases for the US economy: (ghh,gll) = (-0.5,-0.3), (-0.9,-0.6) and (-1.5,-0.8). A major difference occurs for the cross-labour-supply elasticity; Borjas assumes gsu = 0.05 while we use a negative cross labour supply elasticity. The negative cross elasticity results from the estimated production
functions for the Dutch economy, which yield that high-skilled and low-skilled labour are highly substitutable. International evidence on production functions mostly finds that the two types of labour are slightly complementary; Borjas follows this evidence.
118
Appendix 3A
Appendix 3A: The demographic impact This appendix relates to chapter 4 (Public sector). Table A.3.1 shows the demographic scenario that is used to analyse the impact of immigration
on future budgets. The table shows how the inflow of immigrants changes the age composition of population in the period until 2080 if the annual net-inflow is set equal to 0.05% of the
population3 and the age composition of this inflow coincides with that of the actually observed
inflow of immigrants. A higher or lower figure for the net inflow, it can be assumed, would lead to a proportional change of the results. A.3.1
Impact of additional immigration on age composition of population 2000
2020
2040
2060
2080
15.9
17.1
17.4
17.1
17.1
0
24.4
22.2
22.3
22.2
22.2
20-64
62.0
59.1
54.4
56.0
55.7
65+
13.6
18.8
23.3
21.8
22.1
Total
100.0
100.0
100.0
100.0
100.0
0.0
0.2
0.5
0.8
1.2
0
34.5
33.7
30.0
28.2
26.8
20-64
64.5
64.2
63.9
61.6
60.0
1.0
2.0
6.1
10.2
12.6
100.0
100.0
100.0
100.0
100.0
15.9
17.3
17.9
19.9
18.3
0
24.4
22.3
22.5
22.5
22.5
20-64
62.0
59.1
54.7
56.3
56.0
65+
13.6
18.6
22.8
21.2
21.5
Total
100.0
100.0
100.0
100.0
100.0
Base case population (millions)
a
Age group as % of total
Cumulated inflow (millions)
b
Age group as % of total immigrants
65+ Total Total population (millions)
c
Age group as % of total
a b
This is the base case projection by Statistics Netherlands (CBS) This projection was also carried out by Statistics Netherlands( CBS) and shows the additional population that results from an additional net
inflow of immigrants that equals 0.05% of the population. The projection includes the effects of offspring and mortality. c
This is the sum of the base case population and the cumulated inflow.
The upper part of table A.3.1 reveals the age composition in the base case scenario. The middle part of it presents the additional population that is generated by the inflow as well as its age
3
This figure is adjusted for the additional emigration that results from the immigration.
119
Immigration and the Dutch Economy: Appendices
composition. It also includes the offspring of the immigrants, i.e. the second and third
generation of immigrants. In the early stages of the process 65% of the immigrant population is between 20 and 65 years of age and only 1% is over 65. After around 80 years, when the age composition becomes more stable, these numbers become 60% and 13%.
The lower part of the table represents the sum of the base case and the additional population.
Comparing it with the base case projection (upper part of the table) reveals how the inflow
would change both the total population and its age composition. Table A.3.2 provides a detailed age composition of the first generation of immigrants when entering the country. Table A.3.2 Age composition of the first generation of immigrants age
0-10
11-20
21-30
31-40
41-50
51-64
65+
18
33
22
7
3
1
% share
16
Figure A.3.1
Age specific rate of return migration of non-Western residents % 3,0
2,5
2,0
1,5
1,0
0,5 average 0,0 0
5
10
15
20
25
30
35
40
45
50 age
55
60
65
70
75
80
85
90
95
An additional feature of immigration is formed by the relatively large percentage of return
migration among the first generation of immigrants. Figure A.3.1 shows the current age specific probabilities of return migration. It turns out that, until the age of 40, the average annual probability is around 2%. Over the age of 40, it gradually declines.
120
Appendix 3B
Appendix 3B: Equivalence of both measures of fiscal impact This appendix relates to chapter 4 (Public sector). This appendix explains that the two measures for the fiscal impact of immigration are
equivalent. More precisely, it shows that the long run budgetary impact of immigration (the second measure) hinges on the lifetime net contribution of the average immigrant (the first
measure). For this purpose we use a stylised example of immigrants who live for two periods. In the first of these they are ‘young’ and in the second they are ‘old’. The immigrants enter the
country at the beginning of the first period. Collective arrangements in the first period are such
that the average immigrants contribute T to the public sector when they are young and receive G when they are old. Furthermore we assume that the discount rate equals r. The interest rate is
assumed to correspond to the discount rate. For convenience, we assume that T and G remain constant through time.
For the average immigrant who enters the country at the beginning of period 1 this
leads to the following expression for the present value of their net lifetime contribution (NLC): NLC = T ! G/(1+r) If in each period one (young) immigrant enters the country, the budget balance in period t (BBt)
develops as follows: BB1
=
T
BB3
=
[T(1+r) + T ! G ] r + T ! G
BB2 BB4
=
Tr + T ! G
=
[T (1+r)2 + (T ! G)(1+r) + T ! G] r + T ! G
The first term of the right hand side in periods 2, 3 and 4 captures the effect on interest
payments by multiplying accumulated past budget balances (or net wealth creation) by the
interest rate. The second term stands for the contribution of the immigrant who enters at the
beginning of period t. The third term captures public expenditure on the immigrant who enters the country at the beginning of period t ! 1. By rearranging terms, this development of the
budget balance through time can be expressed by the following equation: BBt
=
r
∑
t−2 n=1
(T − G / (1 + r)) (1+r)n + T(1+r) ! G
This expression for the budget balance shows that its sign in the long run is eventually
determined by the first term of the right hand side, as the second and third term remain
121
Immigration and the Dutch Economy: Appendices
constant. In turn, the sign of the first term is determined by the sign of T !G/(1+r). As this
corresponds to the expression for the net lifetime contribution, this shows that budget balances in the long run will only be affected positively by immigration if the average immigrant has a positive lifetime contribution and vice versa.
The assumption that T and G remain constant does not affect this outcome. If both T and G are assumed to increase each period at some rate g, this conclusion also holds.
122