Journal of Communications Vol. 9, No. 9, September 2014
WSN Gateways Fault Tolerance for Surveillance Transmission in Smart Grid Communication Kaixuan Wang1,2, Xuesong Qiu1, Ning Fu3, and Haijian Yang3 1
State Key Laboratory of Networking and Switching Technology, Beijing University of Posts and Telecommunications, Beijing, 100876, China 2 Faculty of Information Management, Shanxi University of Finance and Economics, Taiyuan, 030006, China 3 Information and Communication Technology Service Center, Smart Grid Electric Power Research Institute, Beijing, 10076, China Email: {wkx, xsqiu}@bupt.edu.cn;
[email protected];
[email protected] transmission network, N1 contingency analysis or N1 principle is considered to avert the blackout [4]. A typical example is the wide-range blackout that affected the majority of Italy in 2003, which is induced by the dependence between power networks and communication networks [5]. Therefore, research on the fault tolerance is significant to construct the resilience surveillance communication network. There have been many studies on the fault tolerance in WSN (WSN, wireless sensor network). These approaches are either reconfiguration of topology with the mobility of nodes or backup method of the heavily redundancy on routing paths in independent local regions [6]. Although they reveal the effectiveness of fault tolerance, most of them focus on the single fault with the constrains of the power supply. Moreover, most of the existing works only illustrate the tolerance of the commonest sensor in random interdependent wireless sensor network and neglect to explore the significance of gateway node or sink node with fault in general networks. Later on, other researchers studied the wireless network for transmission line monitoring. Ref. [7] proposed the placement problem to find the optimal location of cellular enabled transmission towers. Unfortunately, gateway fault tolerance is not under the consideration. In addition, practical economic feasibility is still debatable since many of the base station need placed for away from the town. A reverse transmission mechanism is presented by [8], yet, fault tolerance is still limited, especially for the multiple faults simultaneously. A backup mechanism for monitoring the transmission line is illustrated, but authors neglect to explore the significance of analysis in wireless networks [9]. In this article, the two distinct characteristics of WSN are extracted which is deployed for the surveillance transmission line, and then the abstract network model is proposed, namely combination model, to deal with the fault tolerance problem. Here, the faults are divided into three types, which are a single fault, multiple faults and area faults. Furthermore, we explore the ability of tolerance for three fault types. To this end, the simulation experiments are carried out to get verification and discussion.
Abstract—Wireless sensors have attracted many researchers' attention because of their playing the very important role of smooth transition from the existing network to the smart grid. WSN (wireless sensor network) for surveillance of overhead transmission line is very promising for the efficiency as well as the economy. Meanwhile, it put some new challenges because of the N1 principle in the power utility design. Therefore, fault tolerance is of great importance in the monitoring the overhead transmission line. In this paper, we study the fault tolerance for the three types of faults. First, because of the two characteristics which are extracted from the applications, the novel network model is presented and it is used to explain the mechanism of the fault tolerance. Moreover, the quantitative analysis is proposed using the reliability depended on the features. The extensive experiments illustrate the effectiveness of our model and highlight some observations. Index Terms—Smart grid communication, fault tolerance, reliability
I.
INTRODUCTION
The rapid development of information communication technology has revolutionized the power utilities and drastically increased their interdependencies with information systems and steadily made the Smart Grid into reality. In the meanwhile, self-healing and resilience are the significant characteristics of the Smart Grid [1], yet, such effort need researcher a long way to go. Human inspection, the current mainly maintenance of the transmission of distributed power is time-consuming, exhausting and inefficient. Encouragingly, monitoring the status of transmission line of power is proposed using wireless sensor network and implemented the prototype by [2]. Vibration and tilt sensor can be installed in the conductor attachment points for detecting the abnormal events. However, the breakdown of tower pole still raises the probability of failure of the surveillance system [3]. Consequently, we put emphasis on the fault problem in surveillance transmission power line in the paper. On the other hand, in order to guarantee the robustness in power Manuscript received May 14, 2014; revised September 16, 2014. Corresponding author email:
[email protected] doi:10.12720/jcm.9.9.680-686 ©2014 Engineering and Technology Publishing
680
Journal of Communications Vol. 9, No. 9, September 2014
Our main contributions are summarized as follows: 1) based on the two characteristics, we construct the communication network model for the surveillance transmission line. 2) The low boundary of three kinds of fault tolerances is analyzed by definitely computing the reliability of networks. 3) Experiments not only illustrate the effectiveness of our approach but also draw the important observations. The rest of the paper is organized as follows. In Section II, introduce the fault tolerance network model, after deeply investigating the using the wireless sensor for the power transmission line. For the three kinds of the faults, the fault tolerance mechanism is explained. Section III includes the compute exactly the reliability and the analysis of reliability of the fault tolerance in this paradigm. The experimental evaluation is proposed in Section IV, along with various centrality metrics. Finally, Section VI provides some concluding remarks. II.
specifically, we puts emphasis on the gateways to relay the data hop by hop, and how to tolerate the faults caused by the damaged gateway when it suffers the corrosion, hail, frozen snow etc. A. The Two Characteristics The paper concentrates on the paradigm, in which WSN is used for the surveillance of the distribution transmission line. On the sake of the linear power transmission line extension for the few of miles in the rural area, the WSN, monitoring the status of the power system alone the line, must be coupled tightly with the power line in order to capture the abrupt the signal instantaneously. Therefore, WSN gateways show the linear characteristic as result of the hop by hop pattern. This distinguishing feature called linear topology is decided by the power line essentially. In this case, the information is relayed hop-by-hop until the terminal gateways or electricity substation. In conventional WSN, one of the most intractable problems may be the supply the power for the sensor. However, the sensor for the surveillance for power line can easily overcome it because there is a magnetic field around the power line for ever. The electric power cannot be stored and delivery timely from the power plant to the residents. Ref. [13] has acquired energy from the magnetic fields surrounding 132KV overhead transmission lines. The authors captured and stored the energy on a storage element to provide relatively adequate power to wireless sensor nodes, without any physical connection to the transmission lines. Even though it is impossible to provide the ample and enough power for sensor at present because of the constraint of engineering technology and heavier body, we could use this valuable power intermittently and periodically to sustained work in the WSN. This is second distinguishing feature which is different from the conventional sensor network.
MODEL
In the WSN network, the gateway is responsible for the role of the sink and relays the data from the near neighborhood sensors. The monitoring data may include the wind speed, temperature, humidity, load conditions in real time, insulator degradation, line conditions, and disturbances. Sensors may be tension sensors, accelerometers, tilt sensors, motion sensors, vision-based sensors, and infrared sensors, etc. [10]. Keeping the continuously automatic data acquisition and uninterrupted transmission are our aims when the faults occurred. Although, there are many papers which elaborate how to tolerate the faults when any of sensor is breakdown or its battery is exhausted within the network in this field, and remarkable results[11][12]. Here, we do not continue fault tolerance within the WSN, but will be concerned about the gateways to ensure the integrity of the monitoring data when they meet the abrupt faults. More
Buckup Node
… Gateway Node
Substation
Substation
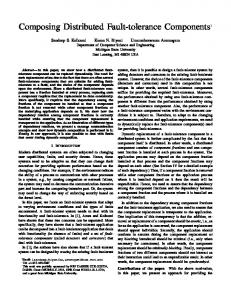
Fig. 1. Combination network model.
B. Network Model Based on the above two features, we can abstract the network model from the empiric background which is for surveillance power line using the wireless sensor networks , data relay in hop-by-hop, as follow Fig. 1. Two terminal nodes in Fig.1 always are the power transformer substations. The data is appended in the relay process from source terminal to the destination terminal. The information is converged to the substation which is processing the data in the information systems, such as
©2014 Engineering and Technology Publishing
EMS. Between the any of the two pole tower, there is a backup node attached the transmission line. The backup node is responsible for the backup the transferring data which is next to his gateway node in the direction of relay. Based on the available technologies, this network model is combination of the topology and the backup mechanism to enhance the reliability of the communication network. Considering the linear topology power transmission surveillance network, we study the data transferred
681
Journal of Communications Vol. 9, No. 9, September 2014
between the gateways in hop-by-hop way. Its work mode explains as follow in the view of fault tolerance. The gateway transmit the data from the source substation hop by hop to the destination substation in the normal, in the meanwhile, backup node store the redundant data when the neighbor gateway transfer the data in the relay direction. When the gateway crashes down or failures, the backup detect it timely and transfer the redundant data to the next backup node by pass the damaging the gateway. After that, next backup detect whether the neighbor gateway is health. If the answer is yes, the redundant data transfer the gateway node, if not, the relay data is transfer by the next gateway to the next backup node. Here, the time slot and the frame collision are not taken into account, and the more detailed of MAC layer and PHY layer are elaborated in [8].
1) Edge failures are independent and the node failure can cause correlative edge failure because the failure node cannot receive and transmit any of the signal and data. 2) Element reliabilities can be represented as Bernoulli distribution just as what the reliability theory claims generally. 3) The probability of the edge is i.i.d and the difference of arc and way node is distribution parameter. The unreliability of fault element is the cumulative distribution function) with different parameters, that
C. Formulation This section considers the formulation of network model. Given the undirected graph Gr (V , E) ,
is F ( x) 1 ei x and x 0 with parameter i 4) In our network model, there is no distinction between transient, and permanent faults. The questionable abnormalities are regarded as the permanent faults, in this paper, because once this fault happened, it is impossible to repair it in a few minutes. Definition: Tcutset and Kcutset Tcutset is the edge set which includes the one way
represents the two-way communication network. | V | ,
and one arc , expressed as follow: Tcutset {way, arc} E
the number of V, and | E | , the number of the E. V B R means the node of Gr consists of the backup nodes and gateway nodes. Especially, terminal stations can provide with the more functions than the gateways on account of the information systems. vi V , i {1,2, ,| V |} ,
and Tcutset (i) {way(i), arc(i)} ,presents the edge set the
and similarly e j V , j {1, 2,
,| E |} . Here, node
T {v1 or v|V | } . The edge set straightway connected the different
type
of
node
is
way
and
wayi {e | ( Ri , Bi )or ( Bi , Ri )} i (1, 2,...,| V | 1) . The bow connected with the two backup nodes or the two gateway nodes is arc , arci {e | ( Ri , Ri 1 )or ( Bi , Bi 1 )}
i (1, 2,
,| V | 2) and
E arc way .
Rel(Gr)
(i) , way (i) , arc (i) } , presents the edge set the corresponding to the node i and Cutset Tcutset Kcutset . Definition: Crizone . The Crizone is the subgraph which includes the five node and the edge that internet connected this nodes, presented as: Crizone(i) (G ', E ') .
E ' {(u, v) V 'V '} . Definition: Structure function ( x)
probability of xi as reliability value. In the paper, three kinds of fault are assumed, that is the single fault, multiple inconsecutive faults and multiple consecutive faults called area faults. The difference faults occurred, our objective is that, we will make the low boundary analysis of the reliability in the worst cases for the tolerance of fault using the method of reliability in detail based the above the network model to deal with the analysis of N1.
. The structure
function ( x) defines that how to influence the reliability of the whole system when the related the series of components is abnormal in the network. There is component vector X , X ( x1 , x2 ,..., xn ) and the xi is the ith component, then
n xi 0 iff xi 0 ( x) i n1 xi 1 iff xi 1 i 1
ANALYSIS
Here, without loss of generality, the usual convention ( X ) 0 means the system is failed or down state, and
Actually, in reliability theory, given any of the random graphs, it is NP-hard problem to compute reliability exactly from the source to the terminal nodes [14], but the proper and accurate results can be obtained by utilizing the particular linear topology feature. In order to access to the result related the different faults, we need take some assumptions:
©2014 Engineering and Technology Publishing
Kcutset { arc , way , arc } E , Kcutset (i) { arc
It is the subgraph induced by gateway node i , if and only if vertices of five node are included in V and V G , that is V ' {i 2, i 1, i, i 1, i 2} i (3, 4,...,| V | 2) and
represents the reliability of the graph. pr ( xi ) is the
III.
corresponding to the node i , Kcutset is the edge set which is include the one way and two arc ,expressed as:
( X ) 1 means the system is up or operational state. After specifying the function ( x) , a probabilistic structure is defined. Then the reliability Rel(Gr) of the network model can be defined by
682
Journal of Communications Vol. 9, No. 9, September 2014
Re l (Gr ) 1 URel (Gr ) pr ( ( x) 1)
URel (Gr L ) pr ( (Tcutset and Kcutset ) 0))
(1)
m 2 2
URel(Gr ) is the unreliability of the graph Gr . When the fault has occurred, how the state of arc and way affect the connectivity of the graph. Case one: When a fault occurred, the reliability of the whole network began to degenerate in the condition of the remaining the connected network. According to its by-pass mode, there is the arc which is connected the whole network, as the Fig. 2 shows.
Pr ( Tcutset (i ) i 1
(4)
m
Kcutset ( j )) j 1
i, j, k Custset , according to the first characteristic of the linear topology network model, obviously, i j {arc} and i j k . This result means equation (4) can be simplified greatly according to the inclusion-exclusion principle as follow. Assumed is the limited set, and S Ai S (i 1, 2,..., n, n 2) then,
X
n
n
i 1
k 1
pr{ Ai } (1)k 1
Fig. 2. One faulty model.
1i1 i2 ik n
pr ( Ai1 Ai2
Ain ) ,
and here
Let set Barc {arc | ( Bi , Bi 1 ) i 1,...,| v | 1} , and r | Barc | . Obviously, | v | always is odd, though there is only one gateway between the terminal substations. | v | 3 r , | V | 3 and at worst, the special arc 2 connected the backup node is down and lead to the break of the connected graph. And then,
m 2 URel (Gr L ) pr Tcutset (i ) Kcutset ( j ) j 1 i 1 2
Case two: When two and more than two faults occurred simultaneously, we assumed the node is gateway and gateway and i j
m pr (arc) pr ( way ) (m 2) pr (arc) 2
Computer complexity: As the equation (2) and (3) can be computed in O(1) , every factor in equation (5) is not more than three items, and computer complexity is not more than O(3m) . Similarly, the expression URel(Gr R ) can be calculated not more than O(3 p) . Therefore, the complexity of reliability is O(| v |) because of the linear topology characteristic.
( pr (arc))
k
(3)
IV.
i 1
Case three: If the more than two faults occurred simultaneously and Crizone(i) Crizone(i) . This often happens in the earthquake, flood and catastrophe things. In this condition, neighbors of gateways are crush down, and communication infrastructure will probably suffer the disaster. Because the backup node between the damaged gateways may not work normally, the damaged gateway nodes i , i 1 and faults can divided the whole network model into the two components Gr L and Gr R .
EXPERIMENTAL
A. Experiment and Parameter The validation of network model is set up in NS2 and we compare performance in Matlab. The parameters are referenced in [15]. The maximum distribution power tower pole distance is not more than 400 m because the high–voltage tower spacing is 400 m to 800 m. Backup nodes is far away the adjacent gateway about the half the maximum distance, that is no more than 200 m. The WiFi technology is used, as the surveillance is often carried out in the rural area outdoor without any obstacles. Normally, the average backup node is inspected in every 15 month and the gateway node 12 month with the replaced frequency is 60 month in the experiment as the aforementioned second characteristic [16]. The Bernoulli distribution parameter p is 0.5 due to randomness. The four experiments are used to show the results and make some discussions. Firstly, the reliability of proposed the network model in three cases is shown when
Rel(Gr ) Rel (Gr L ) Rel (Gr R ) (1 URel (Gr L )) (1 URel (Gr L )) We assume two Tcutset and m Kcutset are included in the Gr L , and two Tcutset and p Kcutset are included in Gr R , then m p | v | 5, 2 m, p because of Crizone of damaged gateway node i. Here, the reliability of the GrL as follow: ©2014 Engineering and Technology Publishing
(5)
2 pr (arc) pr ( way )
if not, the more Crizone(i) Crizone(i) explanations are detailed in the case three below. Here, we assume the k faults occurred, usually k 2 . At worst, one of the k special arc connected the backup node is down and lead to the break of the connected graph. And then,
Cr11i pr (arci )
m pr{Kcutset} (m 2) pr{arc}
j 1 | Kcutset ( j )|
2 pr{Tcutset )}
Rel(Gr ) 1 pr ( ( Barc) 0) 1 C pr (arc) (2)
k
pr ( Kcutset ( j ))
i 1 |Tcustset ( i )|
1 r
URel(Gr) pr ( ( Barc) 0)
m
pr (Tcutset (i ))
683
Journal of Communications Vol. 9, No. 9, September 2014
the node is constant. Secondly, the variation trends of the two cases, the single fault and multiple faults, are illustrated followed the increment of proposed the network nodes. Next, the objectives are the network models in [8] and [9] respectively called reverse model and the backup model. At last, the comparison results are presented by figures.
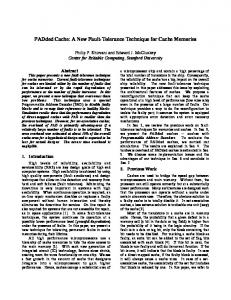
tolerant the single fault completely but still have the 99.4180% probability to connect network in the condition of the 11 nodes just as the Fig. 3 illustrates. In other words, network face the 0.5820% disconnected. While the multi faults are 82.9283% and zone fault is 0.3541%. These results point out the capability of fault tolerance is making big difference, especially for area faults.
B. Metric In the experiment, the fault tolerance in the reverse model and the backup model is evaluated with respect to the metric. As the result of fault tolerance in electric power communication network is not yet standards and regulations, we introduce the two expressions to roughly evaluate the different capability of fault tolerance. That is
1
0.8
Rel
0.6
0.4
average edge connected CH , average node connected
0.2
CN in [17] 0 n 1
CH
2
n 1
n
CH ij
i 1 j i 1
n(n 1)
CN
2
CNij
i 1 j i 1
,
n(n 1)
(6) 1 0.9 0.8 0.7
the survival factor of node pairs (i, j ) which is not directly connected in the graph [18]. Let k be the number of independent track between node pair (i, j ) and ml is the number of node in the independent track pl (1 l k ) between node i and node j , then
0 i j 1 rij k ml i j l 1 p 1 n p l 2
Rel
0.6
1 rij n i 1 j 1
0.5 0.4
Single Fault Two Faults
0.3 0.2 0.1
(7)
0
0
5
10
20
25
30
Fig. 4. Reliability variation.
m
aveCH
(8)
2 1.6
aveCN
Let i 1 , then get the survival factor of the any of the broken gateway to the source node. Because of the distance between backup node and gateway node is about the half of the two adjacent gateway nodes, we set the minimum CH weight the way is 1, and then arc is 0.5. The minimum weight is 1 if cutting off two adjacent gateway nodes, then CN is 0.7 as for the two adjacent backup nodes is no stronger than two gateway nodes generally.
combination model reverse model backup model
1.2 0.8 0.4 0
0
5
10
15
20
25
30
Node(s) aveCN 2
aveCN
1.6
C. Performance and Discussion 1) Reliability of the three cases Here, let the number of the proposed network node is 11. When a fault occurred, network is still connected and delivery data by its working mechanism. However, the Crizone still face the risk of break. The experimental results demonstrate that when a fault occurred, the network nearly keeps connected and
©2014 Engineering and Technology Publishing
15
Node(s)
The invulnerability of the graph is:
Iv(G )
Second Case Third Case
Fig. 3. Reliability of three cases.
Overall, CH and CN can reflect invulnerability of the network when faults occurred. The other parameter rij is
n
First Case
n
combination model reverse model backup model
1.2 0.8 0.4 0
0
5
10
15
20
25
30
Node(s)
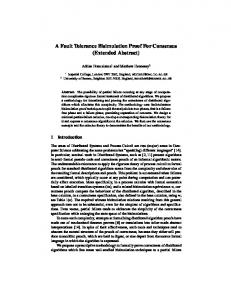
Fig. 5. CH and CN
2) Variation of reliability When the number of network node increase, the change of reliability reflect the variation of fault tolerance.
684
Journal of Communications Vol. 9, No. 9, September 2014
Fig. 4 explains this growth corresponding to the single fault and two faults occurred. The results point out the growth trend when the network nodes change as the figure shows. The correlation between the single fault and two faults is that the both can obtain nearly the 100% reliability when node number reaches the some critical point. In other words, there is the critical number 18 in this experiment. The difference is that there are about 5 nodes distinctions to achieve the same number in the range of the critical point.
network model is more proper the rural place which often extends away from the towns to residential areas. Naturally, this model is more suitable for the fault tolerance in surveillance transmission in Smart Grid Communication. V.
This paper studied the fault tolerance problem for the surveillance transmission in Smart Grid Communication. Based on the two distinct characteristics which are the particular for the power transmission line, the combination network model is proposed to deal with the fault tolerance. After that, we analyze the ability to tolerant the fault in case of single fault, multiple faults and area faults quantitatively at worst. The simulation experiment for the fault tolerance is more suitable for the wireless sensor network monitoring for the distributed power transmission line in the smart grid communication. Next work, we will go deep into critical area faults position and make a quantitative energy analysis on backup cost and fault tolerance in the future work.
3) CH and CN In order to show the effectiveness of fault tolerance in the proposed network model, the parameter CH and
CN are used to measure the invulnerability. The Fig. 5 reports the comparison of performance between three different network models. In those figures, metrics of CH and CN are decrease followed the nodes in all three network models owning to the linear characteristic mentioned above. The more denominator n(n1) becomes lager, the smaller the values of CH and CN are. However, the combination network model still outperforms the other network models. Notably, the backup network model is slightly less than the combination network model. Therefore, this observation demonstrates that the backup method is effective measures for the fault tolerance in surveillance transmission in Smart Grid Communication.
ACKNOWLEDGMENT This work is supported by the National High-Tech Research and Development Program of China (863) under Grant No. 2011AA05A116. REFERENCES
4) Survival factor In this simulation, survival factor is used to evaluate the capability of fault tolerance. For the further advantage of proposed the network model, the number of network nodes is increased to 50 in Fig. 6.
[1]
[2]
0.01 0.009
[3]
survival factor
0.008
combination network model reverse network model backup network model
0.007 0.006
[4]
0.005
[5]
0.004 0.003 0.002
[6]
0.001 0 10
15
20
25
30
35
40
45
50
Node(s)
[7]
Fig. 6. Survival factor.
The survival factor shows the reverse trend of the number of nodes, yet the other two models are more rapidly decrease to 0 than the combination network model. In particular, the combination network model can survive when the number of node grows to the large number. Because of the combination of the backup method and topology redundancy, this combination ©2014 Engineering and Technology Publishing
CONCLUSIONS
[8]
[9]
685
Ye. Y, et al., “A survey on smart grid communication infrastructures: Motivations, requirements and challenges,” IEEE Communications Surveys & Tutorials, vol. 15, pp. 5-20, February 2013. Y. Yang, D. Divan, R. G. Harley, and T. G. HabetIer, “Design and implementation of power line sensor net for overhead transmission lines,” in Proc. IEEE Power Engineering Society General Meeting, Calgary, 2009, pp. 1-8. R. A. Leon, V. Vinal, and G. Manimaran, “Application of sensor network of secure electric energy infrastructure,” IEEE Trans. on Power Delivery, vol. 22, pp. 1021-1028, April 2007. J. Shortle, S. Rebennack, and F. W. Glover, “Transmissioncapacity expansion for minimizing blackout probabilities,” IEEE Trans. on Power Systems, vol. 29, pp. 43-52, January 2014. D. T. Nguyen., S. Yilin, and M. T. Thai, “Detecting critical nodes in interdependent power networks for vulnerability assessment,” IEEE Trans. on Smart Grid, vol. 4, pp. 151-159, March 2013. C. Laoudias, M. P. Michaelides, and C. Panayiotou, “Fault tolerant target localization and tracking in binary WSNs using sensor health state estimation,” in Proc. IEEE International Conf. Communications, Budapest, 2013, pp. 1469-1473. B. Fateh, M. Govindarasu, and V. Ajjarapu, “Wireless network design for transmission line monitoring in smart grid,” IEEE Trans. on Smart Grid, vol.4, pp. 1076-1086, June 2013. T. Liang, et al., “A reverse transmission mechanism for surveillance network in smart grid,” in Proc. INFOCOM Computer Communications Workshops, Turin, 2013, pp. 61-66. X. Jun, et al., “A novel mechanism for surveillance transmission in smart grid,” in Proc. IEEE International Conf. Smart Grid Engineering, Oshawa, 2012, pp. 1-8.
Journal of Communications Vol. 9, No. 9, September 2014
[10] R. A. Leon, V. Vittal, and G. Manimaran, “Application of sensor network for secure electric energy infrastructure,” IEEE Trans. on Power Del, vol. 22, pp. 1021–1028, April 2007. [11] M. Bhuiyan, G. Wang, J. Cao, and J. Wu, “Deploying wireless sensor networks with fault-tolerance for structural health monitoring,” IEEE Trans. on Computers, pp.1-14, Oct. 2013. [12] L. Xuefeng, C. Jiannong, and T. ShaoJie, “Fault tolerant complex event detection in WSNs: A case study in structural health monitoring,” in Proc. IEEE INFOCOM, Turin, 2013, pp. 13841392. [13] J. A. Van Schalkwyk and G. P. Hancke, “Energy harvesting for Wireless Sensors from electromagnetic fields around overhead power lines,” in Proc. IEEE International Symposium on Industrial Electronics, Hangzhou, 2012, pp. 1128-1135. [14] W. Jin-Myung and F. Karray, “Cumulative update of all-terminal reliability for faster feasibility decision,” IEEE Trans. on Reliability, vol. 59, pp. 551-562, September 2010. [15] L. Ruixue, L. Jianming, and L. Xiangzhen, “A networking scheme for transmission line on-line monitoring system based on IoT,” in Proc. 8th International Conf. Computing Technology and Information Management, Seoul, 2012, pp. 180-184. [16] N. Action and M. Courage, “Wireless sensor networks for SCADA and industrial control systems,” International Journal of Engineering and Technology, vol. 3, pp. 1014-1024, December 2013. [17] M. A. Run-nian, et al., “Evaluation method of invulnerability of weighted network based on measurements of invulnerability,” Application Research of Computers, vol. 30, pp. 1802-1804, June 2013. [18] G. Qiang, L. Xianwei, and C. Zhixiong, “Survivability analysis of integrative emergency communication network for power system,” in Proc. International Workshop on Intelligent Systems and Applications(ISA), Wuhan, 2009, pp. 1-4.
©2014 Engineering and Technology Publishing
Kaixuan Wang received his B.S.,M.S. degrees in Computer Software and Theory from Shanxi University, Taiyuan, China, in 2000, 2005, respectively. Now, he is working toward his Ph.D degree in the State Key Laboratory of Networking and Switching Technology at Beijing University of Posts and Telecommunications. His research interests include network fault management, traffic engineering and smart grid communication. Xuesong Qiu was born in January 1973. He received the Ph.D degree from Beijing University of Posts and Telecommunications, Beijing, China, in 2000. He is a Professor and Ph.D supervisor. He published about 100 SCI/EI index papers. Currently, he presides over a series of key research projects on network&service management including the projects supported by National Natural Science Foundation and National High-Tech Research and Development Program of China. Professor Qiu has got 13 national and provincial scientific and technical awards, including the national scientific and technical awards (second-class) twice. Ning Fu works at Information and Communication Technology Service Center, Smart Grid Electric Power Research Institute. His research interests include smart grid communication and service managemnt. Haijian Yang works at Information and Communication Technology Service Center, Smart Grid Electric Power Research Institute. His research interests include smart grid communication and smart power distribution and utilization grid.
686