Large tracts of land throughout Tasmania are subject to slope instability and over .... Geological Survey Record 2005/04, Mineral Resources Tasmania, Hobart.
TASMANIAN LANDSLIDE MAP SERIES
WYNYARD - DEEP- SEATED LANDSLIDE SUSCEPTIBILITY
Department of Infrastructure Energy and Resources MINERAL RESOURCES TASMANIA
MAP 6
200 200
Western Bay
Shelter Point
100
Jacobs Boat Harbour
200
BASS IRBYS
STRAIT
20 0
200
ROAD
100
Chambers Bay
100
0 10
PORT
GATES
RD
100 100
Cree k
100
100
200 Cassidys
TABLE CAPE
ROAD
BA SS
AY HW HIG
Creek
100
HIGHW AY
BASS
E OR YM LL TO
10 0
100
Mi tch ell s
100
Creek 100
100
100
Boat Harbour 100
ROAD
TOLLY MORE
RI VE R
Tel ford s
Flowerdale
RD
WE STE RN
100
LINE
NA EN OL E PR
100
ROAD
FLO WE RD ALE
AD RO
W ES TE RN
MA RS HA LL S
RO AD
100 LE EO PR
100
Freestone Cove
R VE RI
LIN E
INGLIS
NNA
Fossil Bluff
Moorleah 100 BA
LL A
ST
RIV ER
T PI
10 0
IN GL IS
RD
100
AD RO
AD RO
WYNYARD
R LDE CA
WESTERN DRIVE
0 10
OIR ERV RES
PA GE S
OL DI NA
RD
LAPOIN YA
Burntwood Point
LINE
Ck
AD RO
s wick Bes
10 0
Lanaba Hill
100
100
HIG HW AY
EK CRE
RI VE R
Doctors Rocks
Baulds
100
DEEP
IN GL IS
0 10
BA SS
S ER OP CO
10 0 RD
RO AD
LANE
RO AD
Kerribirri
100
RIVER
Ck
100
FLOWE RDALE
Doctors Rocks
Misery Knob
100
ROAD
OLDIN A
Jones Hill 100
0 10
100
100
Ross Grange
ANDERS ONS
100
Creek
100
Pleasant Valley
Woody Hill
Woody Hill
100
100
100
0 10
PREOL ENNA
Woodburn
Busbys Hill
20 0
100
Nioka
Byes Hill
Lewana
Phipps Hill
100
DALLAS
0 10
BIG
Diamond Ranch
100
100 CR EE K
200
100
Gum Hill 0 10
100
200
s per Coo
ROAD
Creek
ROAD
0 10
Di st ille ry
Creek
Upper Calder
AD RO Maralinga Park
SEABR OOK
Lower Mount Hicks SEABROO K
10 0
Kayetta
200
200
100
Kelvin Lea
Creek
100
Kandra
RD
Banksea
Ca mp
100
200
Mount Hicks
0 10
0 20 100
sh kfi ac l B
200
Greenslopes
Gurnawee
RD
20
20 0
EP DE 0
Roaninna
LIMIT OF MODELLING HI CK S
Calder
200
Scotties
100
LIMIT OF MODELLING
Creek
HIGHW AY
100
100
LIMIT OF MODELLING
Seabrook
LANE PRE OLEN NA
Creek
VILLAG E
200
0 10
Wyndarra
LOCKETTS
Narbro Pennine Lodge
MUR CHIS ON
k Cree
MO UN T
K EE CR
Sup per
ROAD
100
ROAD
Anidlo
HOARE S
RD
Scale: 1:25 000 0
Landslide Map Series
Deep- seated Landslide Susceptibility
Background, Aim and Purpose
The landslide susceptibility zones shown on this map are for deep- seated landslides, which are typically large, i.e. >1000m3 in volume - as defined by the Australian Geomechanics Society (AGS) Landslide Risk Management Guidelines (AGS 2007a). These deep- seated landslide features describe failures along failure planes that extend well below any surficial soil horizons into deeply weathered regolith and/or underlying geological units. The depth of these landslides is thought to usually exceed 5m although this is only an estimate with little direct field evidence. Deep- seated landslides in this region mainly consist of the following types: rotational soil slides, translational soil slides, soil slides that are transitional into soil flows, and block or complex spreads.
This map is one of a set of thematic maps addressing regional landslide susceptibility and hazard for urban areas and surrounds in Tasmania. The project is undertaken by Mineral Resources Tasmania, in partnership with Local Government and sponsored by the Natural Disaster Mitigation Programme (involving Federal and State contributions). Large tracts of land throughout Tasmania are subject to slope instability and over 60 houses have been destroyed by landslides since the 1950s with many more significantly damaged. While only minimal loss of life has occurred such events are highly traumatic to those directly affected and the financial cost to individuals, organisations and the State runs into many millions of dollars. Recent disasters such as the Thredbo Landslide in New South Wales, serve to remind society of the potential for loss of life even from relatively small landslides. Fortunately, landslide damage can be avoided when ground conditions are properly understood before construction proceeds and, in already developed areas, this understanding can be used to mitigate the hazard through various measures.
Method A methodology has been specially developed for this map series and is used for other areas of Tasmania. It can be downloaded from the MRT website although minor changes in approach have been made since the first maps were completed. Furthermore, the Australian Geomechanics Society have published guidelines for landslide zoning (AGS 2007a,b) and changes have been made to conform to these as much as possible. The methodology used is based on: - Recording observations of land instability in- and surrounding- the study area (the landslide inventory). - Analysis of the processes that control each landslide type. - Computer assisted modelling that simulates each of the landslide processes to predict areas that could be affected by future landslides.
Caveats for Use The information provided is in the public domain and anyone is free to use it provided they read and understand the purpose and limitations. The following caveats shall apply to the maps. - The hazards identified are based on imperfect knowledge of ground conditions and models to represent our current understanding of the landslide process. As this knowledge improves our perception of the hazard and the depiction on the map may also change. - These maps can be used as a guide (or flag) to the need for specific assessment in potential hazard areas. - Planning decisions should not be made solely on the basis of the zones delineated on the map. - The scale limitations of the data should be considered at all times as exceeding this limit could lead to inaccurate decisions about the hazard. - Site specific assessment of landslide hazard and risk should be undertaken by suitably qualified and experienced practitioners in the fields of engineering geology and geotechnical engineering. - Practitioners undertaking site specific assessments should read the map text and associated documents to obtain a thorough understanding of the methodology and limitations of the maps. - Areas where no susceptibility or hazard is shown can still have issues with slope instability. - Anthropogenic influence on slopes cannot be predicted and the occurrence of slope instability resulting from the influence of human actions is specifically excluded from these maps. - The identification and performance of cut and filled slopes have not been specifically considered in map production and their scale is such that they often cannot be resolved on the maps. The presence of such slopes should always be considered in site specific assessments.
Soil slides and slides transitional into flows are common along the present and former coastal escarpments and incised valleys. They occur mainly associated with deeply weathered Tertiary basalts and associated sediments and, to a lesser extent, Permian mudstones. The large number of landslides, particularly in the Tertiary basalts, has facilitated the prediction of potential source, runout and regression zones. These zones are defined empirically from field observations (our own and from previous reports), desktop analysis and consideration of laboratory measurements of material properties. Complex spreads are by far the largest of the landslide types mapped and constitute a large part of the total landslide area. They are somewhat enigmatic in that they have failed on very low slopes within Tertiary basalt, significantly lower than the other types in the same geology. Many of these features have subdued and degraded landforms suggesting that they have not moved in recent times and/or that they are very slow moving. However, the authors have avoided the classification of ‘ fossil or dormant’ used in previous maps by this organisation in the absence of hard evidence as to their actual activity. Possibly some of these features were active in wetter climatic conditions than present but without supporting evidence it is not known how much wetter the climate needs to be and whether it could occur in Holocene- like conditions. In the Wynyard area, these features are demonstrably associated with detachment of deeply weathered basalts on underlying Tertiary marine sediments and possibly this is true elsewhere. It was decided not to attempt susceptibility modelling of the complex spreads because with the tools available and our poor knowledge of the geology it would result in perhaps unreasonably large areas of land being zoned as susceptible to deep- seated landslides. Geomorphological analysis of the landscape indicates that most of the landslides occur naturally in areas that have been steepened by active coastal erosion, along present and former coastal cliffs, and by erosion in incised river valleys. Much of the valley incision can be related to long term regional uplift perhaps spanning more than 1 million years. It was noted that many of the landslides are associated with springs, and therefore groundwater movement, and for this reason the springs are depicted on the map. The modelling method is described in Mazengarb (2005) but it has been necessary to modify some aspects to suit local conditions and to satisfy the AGS (2007a,b) guidelines. Source areas were identified where the slope of the landscape equals or exceeds a nominated threshold value for the underlying geological unit. A digital elevation model was constructed from which the source areas were derived. It is important to realise that the reliability of the source prediction is variable because the digital elevation model from which the source is derived is based on a combination of disparate datasets of varying resolution and quality. A setback (regression) value is assigned to allow the modelling technique to identify an uphill extent to which a potential failure could occur. The entire study area was divided up into 10m square grid cells. The technique employs multiple simulations from each source cell fanning at 1 degree intervals up to 10 degrees either side of the uphill aspect direction. This ensures a smooth cartographic result. Note that the regression angle is steeper than the source slope and is selected to provide the best fit with our field observations. Runout determination was performed in a similar manner with straight line simulations from each source cell fanning about the downhill direction, whose extent was primarily limited by a nominated shadow angle. An additional limiter was implemented to ensure the total distance travelled would not exceed 3.5 times the width of the source area traversed. This ensured that unrealistic runout distances were not created where small susceptible bluffs sat over deeply incised gorges composed of older, more competent basement geology. A final processing step involved an expand- and- shrink routine (one cell dimension) that filled in minor holes and smoothed ragged edges. This has further ensured that an acceptable cartographic output has been produced for the output scale of the maps. The following table lists the modelling parameters employed in identifying susceptibility zones (all angles are in degrees). Qualitative or quantitative susceptibility descriptors of ‘ Very Low’, ‘ Low’, ‘ Moderate’ and ‘ High’ as defined in the AGS (2007a) guidelines were not adopted as they could not be effectively applied. Instead the guidelines allow an alternate approach, although not entirely satisfactory, of ‘ susceptible’ or ‘ not-susceptible’.
Susceptibility Zones for First Time Failure
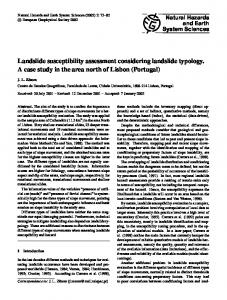
Conceptual Diagram Illustrating Deep- seated Landslide Modelling Techniques
500
1000
1500
2000
2500m
GDA94 - MGA Zone 55. Contour Interval 20 metres.
Regression area.
Source area.
Citation: Runout area. Mazengarb, C. 2010: Map 6, Wynyard - Deep- seated Landslide Susceptibility. Tasmanian Landslide Map Series. Mineral Resources Tasmania, Department of Infrastructure Energy and Resources, Hobart. 1 2
Calculations based on modelled area Prediction success is low because spread- type landslides were not modelled
The susceptibility map has a number of inherent limitations and must be regarded purely as an indication of stability from a regional perspective. The parameters chosen represent a pessimistic or worst case scenario that may with further site investigations be found to better than indicated in some instances. The model does not account for spatial variations in groundwater levels, pore pressures, weathering, lithology, fractures, structural orientation etc, all of which may have a significant affect on local stability but which are often poorly understood at a regional scale. Existing deep- seated landslides are included as a further type of susceptibility zone due to the possibility of reactivation.
Conclusions The deep- seated landslide susceptibility map identifies a significant number of past landslides as well as areas that are potentially susceptible to first time failures. Some of these areas are already developed or are under development pressure. A few of the deep- seated landslides have evidence of recent (European era) movement, the remainder are undated. The identified landslides and susceptible areas are not necessarily unstable in their present condition. However, it cannot be assumed that they are suitable for development without first undertaking a geotechnical investigation - as outlined in the Practice Note Guidelines for Landslide Risk Management (AGS 2007c,d). The risk of destruction of property, injury or loss of life should be estimated on a site by site basis within the identified landslides and landslide susceptible areas.
Regression area: An area up- slope of a source area that could fail following a deep- seated landslide movement (a.k.a retrogression or set- back area).
Acknowledgements:
Source area: An area of hillside with the potential to form a slope failure, identified largely on the basis of slope angle and geology.
Contributions to the map from M. Stevenson and J. Bowerman.
Runout area: An area down- slope of a source area where the moving earth, debris or rock can potentially travel.
Airborne Laser Data derived from Climate Futures for Tasmania LiDAR dataset, available from the LIST.
Base data from the Land Information System of Tasmania (LIST), Copyright State of Tasmania.
Map produced by the Geoscience Infromation Branch of Mineral Resources Tasmania using GIS software.
Susceptibility Zones for Landslide Reactivation
Hillside showing pre- failure and post failure profiles. Runout and regression lines for a hypothetical landslide are defined with their relationship to the modelled susceptibility zones for the pre- failure landscape.
Landslide, recent or active.
Disclaimer: While every care has been taken in the preparation of this data, no warranty is given as to the correctness of the information and no liability is accepted for any statement or opinion or for any error or omission. No reader should act or fail to act on the basis of any material contained herein. Readers should consult professional advisers. As a result the Crown in Right of the State of Tasmania and its employees, contractors and agents expressly disclaim all and any liability (including all liability from or attributable to any negligent or wrongful act or omission) to any persons whatsoever in respect of anything done or omitted to be done by any such person in reliance whether in whole or in part upon any of the material in this data.
Landslide, activity unknown.
Examples of Landslides Depicted on the Map
Crown copyright reserved.
Possible landslide, activity unknown.
References AGS 2007a: Guideline for Landslide Susceptibility, Hazard and Risk Zoning for Land Use Planning. Australian Geomechanics, 42(1), 13- 36.
LOCATION DIAGRAM
Data Sources
AGS 2007b: Commentary on Guideline for Landslide Susceptibility, Hazard and Risk Zoning for Land Use Planning. Australian Geomechanics, 42(1), 37- 58.
The sources for the digital elevation model (DEM) used in the susceptibility modelling are:
AGS 2007c: Practice note guidelines for landslide risk management, Australian Geomechanics, 42(1), 63- 114.
1 - Airborne Laser Scanning
AGS 2007d: Commentary on practice note guidelines for landslide risk management, Australian Geomechanics, 42(1), 115- 158.
2 - 1:5 000 topographic contours
Mazengarb, C. 2005: The Tasmanian Landslide Hazard Map Series: Methodology. Tasmanian Geological Survey Record 2005/04, Mineral Resources Tasmania, Hobart. 43p.
Airborne Laser Scanning data boundary.
Hellyer
Boat Harbour
1:5 000 topographic contour boundary. 3 - 1:25 000 topographic contours Remainder of mapsheet area
Rotational Landslide
Translational Landslide
WYNYARD
Further Information IMPORTANT: This map should be used in conjunction with an understanding of the information contained within the document "Tasmanian Landslide Map Series: User Guide and Technical Methodology". This document, and other information on this map series or Tasmanian landslides in general can be obtained from the MRT web site at www.mrt.tas.gov.au or by contacting the agency directly. Copies of the map images (PDF format) are freely available from the MRT website. GIS layers developed by MRT and shown on the map are supplied to each Council in the area and are available for purchase at a minimal cost of supply.
BURNIE PENGUIN
Miscellaneous Yolla
ULVERSTONE
Municipality boundary.
Riana
Spring or seep - which have a known association with landslides in many cases.
Hampshire
Block or Complex Spread (Source: United States Geological Survey fact sheet 2004- 3072)
LANDSLIDE MAP SERIES
D