Youth Self Employment: Its Nature and Consequences
ABSTRACT. This paper examines the extent of self-employment, characteristics of the self-employed, and the returns to self-employment experiences for a sample of teenagers and young adults in the United States. Using data from the National Longitudinal Survey of Youth, we find that the selfemployment experience of youth is quite different from that of adults. Consequences of youth self-employment, measured at age 27, suggest both positive and negative effects.
1. Introduction The rate of self-employment throughout much of the industrialized world has stabilized or decreased in recent years, after at least a decade of steady growth in some countries.1 In the United States, many policymakers in the 1990s sought to encourage continued growth in self-employment, for a variety of reasons. There is interest in “small business” as a source of economic (or employment) growth.2 Self-employment is also viewed as a vehicle for exit from poverty, particularly for women and racial minorities, and it has been viewed as a viable alternative to unemployment for displaced workers (Balkin, 1989; U.S. Department of Labor, 1992). Self-employment is also regarded as a solution to unemployment problems in general (OECD, 1995). Self-employment has also been proposed as a solution to youth unemployment problems. Individual governments have developed programs to assist youth in the formation of new enterprises, through financial assistance or specialized training, in both developed and developing countries including Germany, Great Britain, Italy, Final version accepted on October 9, 2002 Department of Economics Kent State University Kent, OH 44242 U.S.A. E-mail:
[email protected]
Donald R. Williams
India, Bangladesh, Botswana and Zambia, among others. In addition, international organizations such as the ILO, which has historically supported small enterprise development with the goal of creating new and better employment opportunities in the developing world, are proposing small enterprise development as a component of youth unemployment policy initiatives (ILO, 1999). Recent evidence suggests there are potential losses or costs associated with self-employment, however, such that strategies to promote it may be counterproductive. The failure rate among new enterprises in the first year is very high.3 In the United States, for example, more than one-fourth of self-employed individuals return to the “wage and salary” (or “paid employment”) sector to work for others in any given year (and many of the selfemployed leave the labor force altogether). The failure rates in developing countries are even higher. The evidence suggests that the ex post returns to self-employment among these “returnees” is not always as high as the returns to wage and salary sector employment. Williams (2000) reports that, for women, spells of selfemployment have negative earnings effects among those who return to the wage sector. The argument is that while out of the wage and salary sector, these workers lose potentially valuable labor market experience and opportunities for training or advancement within the firm. For those who are successful in self-employment, the increased income or non-pecuniary rewards that can be gained in self-employment may outweigh these costs. For those who are not successful, however, the costs may outweigh any gains that exist during the self-employment spell. Despite the potentially important consequences of leaving the wage labor market, the question of the long-term impacts of self-employment on workers has not received much attention in the economics literature.
Small Business Economics 23: 323–336, 2004. 2004 Kluwer Academic Publishers. Printed in the Netherlands.
324
Donald R. Williams
The current paper adds to the existing literature by focusing on the self-employment of the youngest workers, those in their teenage and young-adult years, in the United States. The paper addresses several questions. First, what is the extent of self-employment among this group of workers, and what are the characteristics of the self-employed in this group? Second, are they different from or similar to the self-employed older workers? Third, what are the consequences of self-employment for this group? Specifically, how do the later labor market experiences of the self-employed young workers differ from those of workers who did not engage in self-employment? Finally, do the returns to work experience differ according to sector of employment? Recent data from the Current Population Survey and data from the National Longitudinal Survey of Youth are used to address these questions. 2. Data This paper is primarily an empirical analysis of data from two large micro-level data sources in the United States, the Current Population Survey (CPS) and the National Longitudinal Survey Youth Cohort (NLSY). Both data sets have been used in previous studies of self-employed workers, and each has its advantages and disadvantages. They are described separately below.
for the “primary” job. Multiple jobholders who are wage employed in the primary job and selfemployed in the secondary job therefore are considered wage employed in this paper. The focus of this analysis is on young workers, those in the earliest stages of their working lives. Two groups are studied: teenagers (aged 16–19 years) and young-adults (aged 20–24 years).4 The two groups taken together are sometimes also referred to as “youth.” 2.2. Current population survey data The Current Population Survey is a monthly survey conducted with about 60,000 households throughout the U.S. It provides the basis for the Department of Labor’s monthly estimates of employment, unemployment, and labor force participation rates. One of its clear strengths is the size of the sample. It also is representative of the national population (appropriately weighted) and provides several standard characteristics of the population and workforce, including age, educational attainment, race, gender, and industry and occupation of employment. It does not provide the breadth of characteristics that some other data sets provide, however, and is of most value primarily for cross-sectional analyses.5 The data are available directly from the U.S. Department of Labor, Bureau of Labor Statistics. The present paper uses data from the March, 1995, CPS.
2.1. Definitions In both data sets, the self-employed are identified using the “class of worker” variables. Possible responses are that the worker was employed by a private sector employer or government sector employer, worked not for pay in a family farm or business, or was self-employed. This definition would include the “own account” workers found in some other data sets. In some analyses, researchers distinguish between enterprises that are incorporated and those that are unincorporated, often not counting the incorporated as selfemployed. (The statistics on self-employment provided by the U.S. Department of Labor make this distinction, for example.) Both the incorporated and unincorporated self-employed are included as self-employed in this analysis whenever possible. Information is used here only
2.3. NLSY data The National Longitudinal Survey Youth Cohort is an ongoing study of a national probability sample of 12,686 men and women who were aged 14 to 21 as of January 1, 1979. Through normal attrition and decisions to drop sub-samples over time, the sample was reduced to fewer than 8,900 individuals by 1994. The NLSY has many desirable properties: the data set is relatively large (though not as large as the CPS) and it includes large numbers of individual-specific variables related to economic, personal background, and other characteristics not found in other large data sets. In addition, its longitudinal structure allows us to observe individuals over significant parts of their early careers and allows for identification of changes in states over time (in this case, transi-
Youth Self Employment: Its Nature and Consequences
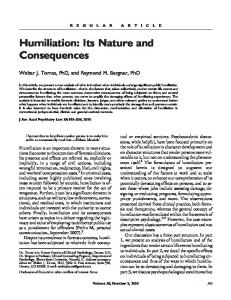
tions between the wage and salary sector and selfemployment). In the present context, we are able to observe the wages and other labor market outcomes for workers several years after their self-employment experiences have ended. One drawback is that the time period for the analysis is primarily the middle and late 1980s, since that is the time when the majority of the sample is in its youth. Thus it is difficult to generalize to current labor market conditions. Nonetheless, the NLSY is the best data set available for the longitudinal analysis of the teenage and young-adult populations in the United States in the past twenty years.6 The data are made available on CD-ROM from the U.S. Department of Labor, Bureau of Labor Statistics and Ohio State University. As mentioned previously, the years utilized in this analysis span the 1979–90 time period. During that time the ages of the samples ranged from 14–22 years to 25–33 years at the times of the interviews. 3. The nature of youth self-employment This section examines the prevalence of selfemployment among young workers, by age subcategory, compares with older workers, and describes some of the characteristics of the selfemployed in comparison with wage and salary sector workers. A preliminary view of selfemployment among youth is found in Figure 1. This figure presents self-employment as a percentage of total employment, by age, for the teenage and young adult NLSY samples over the 1979–89 time period.7 As has been documented elsewhere, self-employment tends to increase with age (Blanchflower, 2000; Manser and Picot, 1999). Compared with other (older) workers, teenagers have by far the lowest self-employment rates. The rate increases dramatically as the workers enter adulthood. In the U.S., the selfemployment rate tends to increase monotonically to age 65 (Manser and Picot, 1999). 3.1. Incidence of self-employment Other worker characteristics related to the rate of self-employment are examined in this section. Using data from the 1995 Current Population Survey, rates of self-employment among youth are
325
Figure 1. Percentage self employed, by age, 1979–1987 NLSY.
presented in the first two columns of Table I. For comparison purposes, self-employment rates for the entire population are presented in the third column, using the results presented in Manser and Picot (1999). These results are generally consistent with those for the entire population found in other studies, as well (see for example, Evans and Leighton 1989, 1990). The estimates indicate that self-employment rates differ consistently according to some worker characteristics, across age groups. Males are more likely than females to be self-employed, as are whites more likely than non-whites, at all ages. The highest self-employment rates tend to be found among workers in the agriculture and construction industries, and among those in the farming, fishing and forestry occupations.8 Some differences do arise by age, however. The finding that self-employment is more prevalent among part-time than full-time workers, for example, does not hold for teenagers. The very high selfemployment rate among sales occupations is found only when older workers are included. This reminds us that the labor market in which teenagers and young adults participate is very different from that of older workers, the opportunities differing as well as the skills brought by
326
Donald R. Williams TABLE I Self-employment rates, by characteristics
Characteristic
Teenagers
Young adults
All ages
Employment Status
Full-time Part-time
04.7% 03.5%
02.6% 03.3%
09.8% 13.2%
Gender
Male Female
04.7% 02.8%
03.8% 02.0%
13.0% 07.6%
Race
White Non-white
04.2% 00.8%
03.2% 01.5%
Schooling status
In school Not in school
04.1% 02.7%
02.6% 03.0%
Educational attainment
High school grad College grad
02.4% 00.0%
02.9% 02.3%
Marital status
Married Not married
02.5% 03.8%
04.1% 02.6%
Industry of employment
Agriculture Mining Construction Manufacturing Trade Finance, insurance, real estate Service Forestry
28.6% 35.1% 04.6% 01.8% 01.4% 09.0% 04.9% 11.9%
12.3% 03.6% 08.2% 01.2% 01.4% 01.1% 03.7% 53.6%
42.5% 04.4% 22.7% 03.7%
Manager Professional/technical Sales Administrative support Service Craft Operative Farming, fishing, forestry
03.5% 06.3% 01.2% 04.4% 02.9% 06.9% 01.7% 24.7%
05.0% 03.1% 02.4% 00.9% 02.7% 07.2% 01.3% 12.3%
17.8% 13.2% 15.9% 03.3% 06.8%
Occupation
13.4%
11.3% 11.2%
38.7%
Source: Columns (1) and (2), Current Population Survey data, March 1995. Column (3), Manser and Picot (1999), data for 1996.
the workers. This suggests we cannot immediately generalize results from samples of older workers to the teenage or young adult populations. 3.2. Characteristics of the self-employed Summary statistics for the CPS sample are presented in Table II, by self-employment status. We see there are several ways in which the selfemployed and the wage and salary sector employed differ. First, young self-employed workers are more likely to be male, white, and married (among young adults), to work in the agriculture, construction, and service industries, and to work in professional and technical or farming, fishing and forestry occupations. They
are less likely than their wage and salary counterparts to be high school graduates, or to work in sales, service, or operative occupations. Except for some industry and occupational distribution differences, these results are similar to those presented by Devine (1994) for the entire male and female population in 1990 (including older workers). Regarding the occupational distributions, older workers tend to be more heavily concentrated in executive, managerial, and sales occupations than do youth. It should be noted that most self-employed youth are not “long-term” self-employed. Table III presents the frequency of self-employment, measured as the number of years in which the individual reports some self-employment, for the
327
Youth Self Employment: Its Nature and Consequences TABLE II Characteristics of the self-employed Characteristics
Teenagers
Young adults
Self-employment
Wage employed
Self-employment
Wage employed
025.2 062.6 097.3 079.6 023.1 000.0 002.0
0019.5 0049.3 0086.3 0071.7 0036.1 0000.0 0003.0
054.2 067.8 091.6 023.4 086.9 009.8 031.8
0060.1 0051.3 0083.1 0026.5 0087.6 0012.7 0022.2
Industry of employment Agriculture Mining Construction Manufacturing Trade Finance, insurance, real estate Service Forestry
029.0 001.4 004.8 002.7 020.4 004.1 036.7 000.7
0002.8 0000.1 0003.8 0005.8 0056.0 0001.6 0027.3 0000.2
011.7 000.5 016.4 005.6 015.9 001.9 042.1 002.3
0002.5 0000.4 0005.5 0013.8 0032.6 0005.3 0033.1 0000.1
Occupation Manager Professional/technical Sales Administrative support Service Craft Operative Farming, fishing, forestry
001.4 006.1 007.5 012.2 026.5 007.5 008.2 030.6
0001.5 0003.5 0024.8 0010.3 0034.6 0003.9 0017.8 0003.6
009.8 011.2 012.6 005.6 018.2 022.0 008.4 012.1
0005.6 0010.5 0015.2 0018.0 0019.9 0008.5 0019.5 0002.6
Number of observations
147
3810
214
7110
Full time Male White In school High school grad College grad Married
Source: Current Population Survey data, March 1995.
NLSY sample. Of course most of the sample reports no self-employment activity. However, even among the self-employed the vast majority reports self-employment in only one survey year.
TABLE III Frequency of self-employment Years of self employment
Teenager (percent)
Young adult (percent)
All youth (percent)
0 1 2 3 4 5 6 7 8
97.9 02.0 00.1 00.0
92.0 05.2 01.8 00.6 00.3 00.1
90.5 06.4 01.9 00.7 00.4 00.1 00.0 00.0 00.0
Source: National Longitudinal Survey of Youth, 1979–1987.
4. Consequences of self-employment among 4. young workers 4.1. Theory As was noted previously, few studies of the consequences of self-employment have been conducted (and none, to our knowledge, have focused on youth), so there is little to draw on in order to develop theoretical arguments. One perspective suggests that self-employment will have positive effects on earnings. Suppose a worker, with a given stock of human capital and various skills,
328
Donald R. Williams
is able to make better use of his resources in selfemployment than in wage and salary sector employment. His skills might be better rewarded in self-employment, and over the long-run he might earn higher total income in that sector.9 An unemployed worker might be better off entering a spell of self-employment, even if it fails, than remaining unemployed for a long time. In the context of programs designed to alleviate youth unemployment, the hope is that the young, unemployed worker who moves into self-employment (with some initial training to improve his level of human capital) stands a better chance of long-term economic success there than in the alternative paid sector. In addition, self-employment can have positive effects on non-wage aspects of employment and the quality of life. For example, previous work suggests that the self-employed have higher levels of job satisfaction (VandenHeuvel, 1997) and more flexible working hours (Boden, 1999). From a simple human capital perspective, however, we posit that self-employment can also have negative effects. A spell of self-employment (as opposed to wage and salary sector employment) can lead to a change in the human capital of the worker, through the change in on-the-job experience. The worker might acquire new skills (learn about new methods or products or industries) which can improve his level of human capital. But he might also suffer a depreciation of his existing skills. In addition, he might miss out on the opportunity to develop new skills that are rewarded in the wage and salary sector, or opportunities for training or promotion within the firm. He might also impede his knowledge of the functioning of the labor market. Since high proportions of the self-employed ultimately return to the wage and salary sector, this can put the worker at a relative disadvantage upon his return. Consequently, the spell of self-employment, especially if an unsuccessful one, can lead to lower rather than higher long-term income. The same unemployed worker described above might be better off taking a (lower paid) job in the wage and salary sector than he is entering self-employment. In addition, self-employment can lead to negative non-pecuniary effects, such as higher job stress and health problems (Jamel, 1997). The acquisition of knowledge about how labor markets, and organizations, work is an important
part of the human capital gain from working in the wage, paid employment sector. This is an especially important part in the overall development of young workers. As such, there is reason to believe that the negative effects of self-employment, to the extent they exist, could even be greater or more costly for young workers than for older workers. If this perspective is correct, then the effects of self-employment on future income (and other labor market outcomes) is indeterminate and ultimately an empirical question. In previous work, Williams (2000) finds that the labor market return to self-employment experience is significantly less than the return to wage and salary experience among adult women who ultimately return to wage employment. Although no such differential is found for adult males, this lends support to the theory that self-employment can lead to a decrease in income over the longer term. The present paper is the first to analyze this issue for teenagers and young adults. 4.2. Effects on future labor market outcomes The analysis begins with a simple comparison of the values of several labor market variables, by prior labor market status. Using data from the NLSY, we first limit the sample to individuals who were aged 16 to 20 in 1979. This group is in its teenage and young adult years in the 1979 to 1984 time period. That is the period in which the selfemployment occurs. We then look at the labor market variables at two points in the future, when the worker is age 25 and age 27. The first measure gives the immediate effect of having engaged in self-employment as a youth, the second gives a slightly longer view (3 years). For this sample, the workers are age 25 in varying years, from 1984 to 1988, and age 27 in the years 1986 to 1990. One advantage to restricting the sample to these years is that the U.S. economy was pretty much in a single business cycle phase throughout the period. Table IV presents descriptive statistics for a small number of labor market variables in the periods mentioned, by early self-employment status of the workers. The samples are divided into groups who had engaged in self-employment while a teenager and not (IV(a)), and those who had engaged in self-employment as a young adult and not (IV(b)).
329
Youth Self Employment: Its Nature and Consequences TABLE IV Descriptive statistics, outcomes at age 25 and 7 by Youth Self-Employment Status (a) Teenagers Variable
Self-employed
Not self-employed
Mean
Std. dev.
Mean
Std. dev.
At age 25 Married w/spouse Weekly hours Part-time Union member College grad Health limitation Agriculture Construction Trade FIRE Manufacturing Weekly income Employed Self-employed
000.456 042.000 000.184 000.165 000.068 000.000 000.097 000.165 000.243 000.039 000.136 298.682 000.942 000.097
000.501 013.270 000.390 000.373 000.053 000.000 000.298 000.373 000.431 000.194 000.344 211.127 000.235 000.298
000.440 039.535 000.203 000.183 000.124 000.028 000.025 000.183 000.208 000.064 000.208 257.076 000.886 000.038
000.496 010.657* 000.402 000.386 000.330** 000.165*** 000.157*** 000.386 000.406 000.244 000.406** 148.168 000.318** 000.190**
At age 27 Married w/spouse Weekly hours Part-time Union member College grad Health limitation Agriculture Construction Trade FIRE Manufacturing Weekly income Employed Self-employed
000.583 040.806 000.243 000.146 000.097 000.010 000.078 000.146 000.233 000.039 000.136 277.625 000.913 000.126
000.496 012.201 000.431 000.354 000.298 000.099 000.269 000.354 000.425 000.194 000.344 191.522 000.284 000.334
000.510 040.180 000.176 000.181 000.094 000.033 000.022 000.181 000.191 000.065 000.210 291.049 000.895 000.042
000.500 010.519 000.380* 000.385 000.292 000.177** 000.147** 000.385 000.393 000.247 000.407** 172.047 000.307 000.201***
*** Indicates significant at 0.01 level. ** Indicates significant at 0.05 level. * Indicates significant at 0.10 level.
The results indicate there are clear differences in the future labor market experiences of the young self-employed compared to the young wage employed. Individuals who were self-employed as teenagers tend to work longer hours at age 25, to be less likely to report a health limitation, more likely to work in agricultural industries, and less likely to work in finance, insurance or real estate or in manufacturing industries. The self-employed teenagers ultimately have lower average weekly wages at age 27 than their non-self-employed cohort, and are much (3 times) more likely to be self-employed in the future.10 There are, however,
no significant differences in the probability of future employment at age 27, or in the probability of part-time employment at age 25. The results for young adult self-employment are stronger, with many significant differences in addition to those noted above. Most notably, those who are self-employed as young adults are less likely to have completed college at either age 25 or 27, are less likely to be (future) members of trade unions, and are more likely to be employed in the construction industry than are their nonself-employed counterparts. Except perhaps for the effect on educational
330
Donald R. Williams TABLE IV (Continued)
(b) Young adults Variable
Self-employed
Not self-employed
Mean
Std. dev.
Mean
Std. dev.
At age 25 Married w/spouse Weekly hours Part-time Union member College grad Health limitation Agriculture Construction Trade FIRE Manufacturing Weekly income Employed Self-employed
000.494 041.836 000.210 000.107 000.082 000.054 000.074 000.107 000.182 000.038 000.105 263.368 000.908 000.274
000.501 013.720 000.408 000.310 000.274 000.226 000.262 000.310 000.386 000.192 000.307 183.255 000.289 000.446
000.435 039.390 000.202 000.189 000.127 000.025 000.023 000.189 000.211 000.065 000.216 257.278 000.885 000.018
000.496** 010.397*** 000.401 000.391*** 000.333*** 000.156*** 000.149*** 000.391*** 000.408 000.247*** 000.411*** 146.539 000.318 000.134***
At age 27 Married w/spouse Weekly hours Part-time Union member College grad Health limitation Agriculture Construction Trade FIRE Manufacturing Weekly income Employed Self-employed
000.522 042.248 000.212 000.115 000.049 000.033 000.056 000.115 000.179 000.046 000.125 299.048 000.900 000.243
000.500 013.316 000.409 000.320 000.215 000.180 000.231 000.320 000.384 000.210 000.322 196.475 000.300 000.429
000.511 040.013 000.174 000.186 000.098 000.032 000.020 000.186 000.193 000.067 000.216 290.035 000.895 000.027
000.500 010.260*** 000.379* 000.389*** 000.297*** 000.176 000.142*** 000.389*** 000.394 000.249* 000.411*** 170.207 000.307 000.161***
*** Indicates significant at 0.01 level. ** Indicates significant at 0.05 level. * Indicates significant at 0.10 level.
attainment, none of these differences between the later experiences of self-employed youth can be viewed as a “negative” effect. Further research might want to explore the longer-term consequences of the educational attainment differential. Of course we cannot conclude from these results that early self-employment “causes” the differences in labor market outcomes we observe. The differences may simply reflect underlying differences between the self-employed and wageemployed workers. That is, there may be selfselection into the self-employment state according to characteristics that are correlated with these
later outcomes. Individuals who choose selfemployment might be those who are already less likely to complete schooling and who have lower earnings potential, for example. We attempt to control for this possibility in the next section. 4.3. Returns to self-employment experience The question of differential returns to previous self-employment is examined using multiple regression analysis to estimate earnings functions among both wage and salary and self-employed workers, with variables to capture the effects of
Youth Self Employment: Its Nature and Consequences
prior self-employment. Various measures of the extent of previous self-employment experience are constructed for each individual in the sample, for the years when they were teenagers and young adults. Log-wages at the later age 27 are then regressed on measures of individual-specific productivity related and personal variables (gender, race, educational attainment, industry of employment, etc.) as well as the prior self-employment experience and wage and salary experience measures. That is, the parameters from the following wage equation are estimated: Wi = a + b(Xi) + c(SEi) + d(WSEi) + ei, where Wi is the log wage for person i, Xi is a vector of the personal characteristics, SEi is person i’s amount of previous self-employment experience, and WSEi is her amount of wage and salary experience. The error term, ei, follows the standard assumptions for ordinary least squares regression. The variables included in the vector X are binary dummy variables indicating married, spouse present at age 27 (MSP27), union membership (UNION27), part-time employed (PART27), college graduate (COLL27), race (WHITE), gender (MALE), and whether the individual has a health limitation (HEALTH27). Also included are industry dummies for agriculture, trade, finance, insurance and real estate, and manufacturing employment. Finally, the regressions include a series of dummy variables indicating the individual’s age. The hypothesis that the returns to the two types of experience differ is tested by comparing the regression coefficients on the two experience measures, “c” and “d,” using a simple t-test. The basic results are given in Table V, for the entire sample (self-employed and wage employed together). Panel (a) presents the coefficient estimates for the basic model, while panel (b) gives the estimates when a “self-employed at age 27” variable is added. Only the experience and selfemployment coefficients are reported. Tables reporting the results for the other variables are available from the author upon request. Those results are consistent with the vast earnings literature with respect to the standard variables. Regarding the effects of prior self-employment, four different types of measures are used. The first
331
are dummy variables (TEENSLF, YTHSELF) simply indicating whether the individual was engaged in self-employment at any time during the teenage or young adult years. The second set measures the number of years in which either type of self-employment was recorded (YRSLFTN, YRSLFYTH) for teenagers and young adults, respectively. The third measure is the cumulative number of hours worked in the teenage and young adult years, using the average per week (CTHRS). The fourth set differentiates between hours in self-employment (CSHRS) and those in wage employment (CWHRS). Several alternative combinations of these variables are presented in Table V. Referring first to the hours variables, we find that additional hours of work experience are rewarded in the form of higher earnings. This is true at the aggregate level and when broken into its self- and wage- components. There are no statistically significant differences in the coefficients on the CSHRS and CWHRS variables. At the same time, there is some evidence for the TEENSLF variable that engaging in teenage selfemployment can lead to lower earnings in the future. This result holds even when current (age 27) self-employment is controlled for (panel b). This suggests that the effect is not due solely to some unobserved difference between the wage and self employed samples. The result of differential earnings according to youth self-employment status is also found when the sample is limited to the wage and salary sector employed (Table VI). In particular, those who engaged in teenage self-employment were found to earn between 11 and 14 percent less than others at age 27, across most specifications. At the same time, hours worked as a youth are found to be significantly rewarded in the wage labor market, but only those in wage and salary sector employment. The self-employed hours coefficient is positive and about the same magnitude as the wage hours coefficient, but it is not significantly different from zero. This suggests that the results in Table V, of positive and significant returns to self-employment hours, are due to the presence of self-employed individuals in the sample. That is, self-employment work experience appears to be rewarded only in the self-employed sector of the labor market.
t-value
t-value
00.3218
–0.140838 –3.53
00.03414 01.96 –0.065796 –1.29
Parameter estimate
(2) t-value
00.3353
–0.121603 –3.23
00.001251 10.56
Parameter estimate
(3)
00.332
t-value
00.3354
00.001617 04.66 00.001228 10.21 –0.135102 –3.42
Parameter estimate
(4)
t-value
t-value
00.336
–0.122671 –3.16
00.001274 10.71
–0.140514 –2.51 00.016759 00.55
Parameter estimate
(5)
00.3326
00.001279 10.74
–0.143442 –2.56 –0.00639 –0.22
Parameter estimate
(5) t-value
01.27 –2.19 10.60
t-value
0.3359
–0.131447 –3.32
0.02204 –0.11131 0.001265
Parameter estimate
(6)
00.3324
00.004602 00.28 –0.111808 –2.20 00.001277 10.69
Parameter estimate
(6)
The regressions also include controls for age, gender, race, educational attainment, health status, part-time status, and industry of employment.
Adj r-squared 00.3216
–0.125451 –3.20
–0.093718 –1.67 00.027065 00.88
TEENSLF YTHSELF YRSLFYTH YRSLFTN CTHRS CSHRS CWHRS SELF27
t-value
Parameter estimate
Variable
(1)
Specification
(b) With self27 variable
00.3181
00.001252 10.55
Parameter estimate
00.3319
t-value
Adj r-squared 00.3182
00.015747 00.95 –0.065935 –1.29
Parameter estimate
00.001278 03.84 00.00125 10.39
t-value
–0.096421 –1.71 00.003713 00.13
Parameter estimate
(4)
TEENSLF YTHSELF YRSLFYTH YRSLFTN CTHRS CSHRS CWHRS
t-value
(3)
Parameter estimate
(2)
Variable
(1)
Specification
(a) without self27 variable
TABLE V Regression results: Entire sample. Dependent Var = log(weekly wage at age 27)
00.3365
00.00218 04.65 00.001232 10.20 –0.138347 –3.50
–0.172209 –2.96 –0.035421 –0.88
Parameter t-value estimate
(7)
00.3327
00.00187 04.06 00.001252 10.36
–0.164366 –2.82 –0.042366 –1.06
Parameter t-value estimate
(7)
332 Donald R. Williams
t-value
0.3444
9.90
t-value
00.3456
00.001193 10.08
–0.157402 –2.75 –0.034326 –1.07
Parameter estimate
(5)
t-value
00.3434
–0.03009 –1.45 –0.145765 –2.61 00.001198 10.11
Parameter estimate
(6)
The regressions also include controls for age, gender, race, educational attainment, health status, part-time status, and industry of employment.
00.3325
0.001171
Parameter estimate
00.3447
t-value
Adj r-squared 00.3325
–0.02423 –1.17 –0.114728 –2.05
Parameter estimate
00.000488 01.01 00.001189 10.00
t-value
–0.124089 –2.16 –0.031282 –0.98
Parameter estimate
(4)
TEENSLF YTHSELF YRSLFYTH YRSLFTN CTHRS CSHRS CWHRS
t-value
(3)
Parameter estimate
(2)
Variable
(1)
Specification
TABLE VI Regression results: Wage employed sample. Dependent Var = log(weekly wage at age 27)
00.3327
00.001188 01.61 00.001194 10.00
–0.157291 –2.66 –0.034065 –0.71
Parameter t-value estimate
(7)
Youth Self Employment: Its Nature and Consequences
333
334
Donald R. Williams
To control for the potential bias resulting from self-selection into the self-employment state, the log-earnings equations are estimated using the Heckman two-step procedure (Heckman, 1979). We first estimate a probit specification of the determinants of self-employment status.11 The predicted probabilities of self-employment are used to compute the inverse-Mills ratio, which is then included as an explanatory variable in the earnings function (LAMBDA) for the sample limited to the wage-employed. The estimated coefficients and robust standard errors for two of the log-earnings specifications are presented in Table VII.12 The results again suggest that time spent in self-employment as a youth is negatively correlated with current earnings, and that the returns to self-employment experience are significantly lower than the returns to wage-employment experience in the wage and salary sector. 5. Summary and conclusions This paper has examined the extent of selfemployment in the United States and the impact that self-employment has on several economic outcomes, with a focus on teenaged and youngadult workers. Using data from the Current Population Survey for 1995 and the National Longitudinal Survey of Youth for the 1979–1990 period, we find that self-employment is fairly rare among young workers (between 1 and 4 percent), but that the characteristics of the youth selfemployed are similar to those of older workers.
Large differences exist by industry and occupational categories, however, which suggests that the nature of youth self-employment is quite different from that of adults. In particular, self-employed youth tend to work in agricultural and service industries and in forestry, fishing and farming occupations, while adults are more likely to be engaged in management and professional and sales occupations. It is not clear, therefore, whether experience gained in self-employment as a youth is easily transferred to adult self-employment. Nonetheless, self-employed youth are much more likely to be self-employed in early adulthood (age 27 in this paper) than are those who did not engage in early self-employment. The “consequences” of self-employment are found to be mixed. While there are many differences in the future outcomes of those who engaged in self-employment as a young adult compared to those who didn’t, only few could be perceived as “negative:” the youth self-employed tend to have lower levels of educational attainment and have lower average weekly earnings. In addition, these outcomes could reflect unobserved characteristics of the self-employed, however, and are not necessarily the result of self-employment status per se. The question of whether early self-employment experience is rewarded at later years also provides mixed results. The overall impression from the estimates presented here, however, is that selfemployed youth tend to have lower earnings at age 27, and that the self-employment experience is not
TABLE VII Regression results: Wage employed sample (with selectivity adjustment). Dependent Var = log(weekly wage at age 27) (1)
(2)
Variable
Parameter estimate
Standard error
t-value
YRSLFYTH YRSLFTN
–0.0286 –0.1153
0.0376 0.0561
–0.76 –2.06
CSHRS CWHRS LAMBDA
–0.0263
Adj r-squared
–0.3302
0.1881
–0.14
Parameter estimate
Standard error
t-value
0.0007 0.0012
0.0007 0.0001
1.06 9.91
0.0734
0.1457
0.50
0.3425
The regressions also include controls for age, gender, race, educational attainment, health status, part-time status, and industry of employment.
Youth Self Employment: Its Nature and Consequences
rewarded in the wage employment market at that time. This result is found to hold after controlling for endogeneity of self-employment status. Acknowledgements I gratefully acknowledge the financial support of the Kent State University Office of Research and Graduate Studies. An earlier version of this paper was presented at the Swiss Society of Statistics and Economics meetings, 23–24 March 2000, Solothurn, Switzerland. I am grateful to Jessica Ellis for her assistance in preparing the data for analysis, and to two anonymous reviewers for their helpful comments. Notes 1
The rate has increased in Canada, in stark contrast to the U.S. experience (Manser and Picot, 1999). For an analysis of the trends in self-employment among OECD countries, see Blanchflower (2000). 2 It is a commonly held view that small business is responsible for a disproportionate share of employment growth, despite some evidence to the contrary. 3 For a recent analysis of the determinants of success in selfemployment, see Taylor (1999). 4 This definition of teenagers differs from that used by others (e.g., in Europe) in its exclusion of 15 year olds. In the United States, however, employment among 15 year olds is very rare. 5 There is a longitudinal component to the data set, but it is limited to one-year comparisons and for only a small proportion of the total sample. 6 The NLS has added a new youth cohort, which should allow for similar analyses in a few years. 7 Each individual in the sample has the opportunity to appear in this figure several times, once at each age. 8 These results are consistent with those found by others, including Blanchflower for the OECD countries (2000). See also Lin et al. (2000) and Cowling and Taylor (2000). 9 See Bernhardt (1994). 10 All of these differences are statistically significant at the 90 percent confidence level or greater. 11 For recent examples of modeling self-employment probabilities or transitions, see Cowling and Taylor (2001) and Bruce (1999). The effect of spousal self-employment status, studied by Bruce is ignored in this work. 12 These specifications do not include the TEENSLF and YTHSELF variables, which were included in the Probit equation. Identification is obtained through the exclusion of the age variables from the Probit, and from the non-linearity of the Probit specification.
335
References Balkin, Steven, 1989, Self Employment for Low Income People, New York: Praeger Publishers. Bernhardt, I., 1994, ‘Comparative Advantage in SelfEmployment and Paid Work’, Canadian Journal of Economics 27, 273–289. Blanchflower, David G., 2000, ‘Self-Employment in OECD Countries’, Labour Economics 7, 471–505. Blanchflower, David G. and Bruce D. Meyer, 1994, ‘A Longitudinal Analysis of the Young Self-Employed in Australia and the United States’, Small Business Economics 6, 1–9. Boden, Richard J., Jr., 1999, ‘Flexible Working Hours, Family Responsibilities, and Female Self-Employment’, American Journal of Economics and Sociology 58(1), 71–83. Bruce, Donald, 1999, ‘Do Husbands Matter? Married Women Entering Self-Employment’, Small Business Economics 13(4), 317–329. Bruce, Donald and Herbert J. Scheutze, 2000, ‘The Wage Effects of Experience in Self-Employment’, presented at the Association for Public Policy Analysis and Management Fall Research Conference, Seattle, WA (November). Cowling, Mark and Mark Taylor, 2001, ‘Entrepreneurial Women and Men: Two Different Species?’, Small Business Economics 16(3), 167–175. Devine, Theresa J., 1994, ‘Characteristics of Self-Employed Women in the United States’, Monthly Labor Review 117(3), 20–33. Evans, David S. and Linda S. Leighton, 1990, ‘Small Business Formation by Unemployed and Employed Workers’, Small Business Economics 2(4), 319–331. Evans, David S. and Linda S. Leighton, 1989, ‘Some Empirical Aspects of Entrepreneurship’, American Economic Review 79(3), 519–535. Heckman, James J., 1979, ‘Sample Selection Bias as a Specification Error’, Econometrica 47(1), 153–162. House, William J., 1993, ‘Urban Self-Employment in Kenya: Panacea or Viable Strategy?’, World Development 21(7), 205–223. International Labour Office, 1998, Youth and Employment, ILO, Geneva, October. International Labour Office, 1999, Key Indicators of the Labour Market 1999, ILO, Geneva. Jamal, Muhammad, 1997, ‘Job Stress, Satisfaction, and Mental Health: An Empirical Examination of Self-Employed and Non-Self-Employed Canadians’, Journal of Small Business Management 35(4), 48–57. Lin, Zhengxi, Garnett Picot and Janice Compton, 2000, ‘The Entry and Exit Dynamics of Self-employment in Canada’, Small Business Economics 15(2), 105–125. Manser, Marilyn E. and Garnett Picot, 1999, ‘SelfEmployment in Canada and the United States’, Perspectives on Labour and Income (Autumn), 37–44. Organization for Economic Cooperation and Development, 1995, Self-Employment Programmes for the Unemployed, OECD, Paris. Taylor, Mark P., 1999, ‘Survival of the Fittest? An analysis
336
Donald R. Williams
of Self-Employment Duration in Britain’, The Economic Journal (March), 140–155. U.S. Department of Labor, Employment and Training Administration, 1992, Self-Employment Programs for Unemployed Workers, Occasional Paper 92-2. VandenHeuvel, Audrey, 1997, ‘Self-Employed Contractors and Job Satisfaction’, Journal of Small Business Management 35(3), 11–20.
Williams, Donald R., 2000, ‘Consequences of SelfEmployment for Men and Women in the United States’, Labour Economics 7, 665–687. Wilderman, Ralph E. et al., 1999, Self-Employment in 23 OECD Countries: The Role of Cultural and Economic Factors. EIM Research report 9811/E.